agent-session-inspector
Health Uyari
- License — License: MIT
- Description — Repository has a description
- Active repo — Last push 0 days ago
- Low visibility — Only 5 GitHub stars
Code Basarisiz
- process.env — Environment variable access in bin/agent-session-inspector.mjs
- network request — Outbound network request in bin/agent-session-inspector.mjs
- rm -rf — Recursive force deletion command in install.sh
Permissions Gecti
- Permissions — No dangerous permissions requested
Bu listing icin henuz AI raporu yok.
See where a coding-agent session's tokens and dollars went: a local inspector for Claude Code, Codex, GitHub Copilot, Cursor, Gemini CLI, OpenCode and Hermes sessions, with a step-by-step timeline, per-step cost and analytics. Nothing leaves your machine.
Agent Session Inspector




See exactly where a coding-agent session's tokens and dollars went. A local
inspector for Claude Code, Codex, GitHub Copilot, Cursor, Gemini CLI, OpenCode
and Hermes transcripts: every prompt, thought, tool call and injected piece of
context in order, each with its own token count and cost.
It answers the questions a usage total cannot: why one session cost $12, which
turn blew up the context, how much of it was system prompt and tool results
rather than conversation, and which tool kept failing.
Your sessions never leave your machine. The app collects nothing: no
telemetry, no analytics, no account, no cloud. It reads the transcript files
already on your disk, read-only, and serves them to your own browser on127.0.0.1. See Privacy for the details and how to check.
Quick start
Run it with Node.js 22.13 or newer, nothing to install:
npx agent-session-inspector
It serves on http://localhost:4747 (or the next free
port), bound to 127.0.0.1 only, and opens your browser. --port, --host and--no-open change that; --help lists everything.
No agent installed yet, or just want to look around first? --demo opens the
app on a set of synthetic sessions from several agents instead of your own:
npx agent-session-inspector --demo
npx agent-session-inspector@latest picks up a new release. To keep the command
around instead, install it globally:
npm install -g agent-session-inspector
Install script
The same build is on GitHub Releases, with an installer that needs only Node,curl and tar:
curl -fsSL https://github.com/kishanmundha/agent-session-inspector/releases/latest/download/install.sh | bash
It puts the app in ~/.agent-session-inspector and links anagent-session-inspector command into ~/.local/bin. Re-run the install
command to update. To uninstall:
rm -rf ~/.agent-session-inspector ~/.local/bin/agent-session-inspector
The install script needs bash, so it covers macOS, Linux and WSL. On Windows
use npx.
Features
Inspect one session
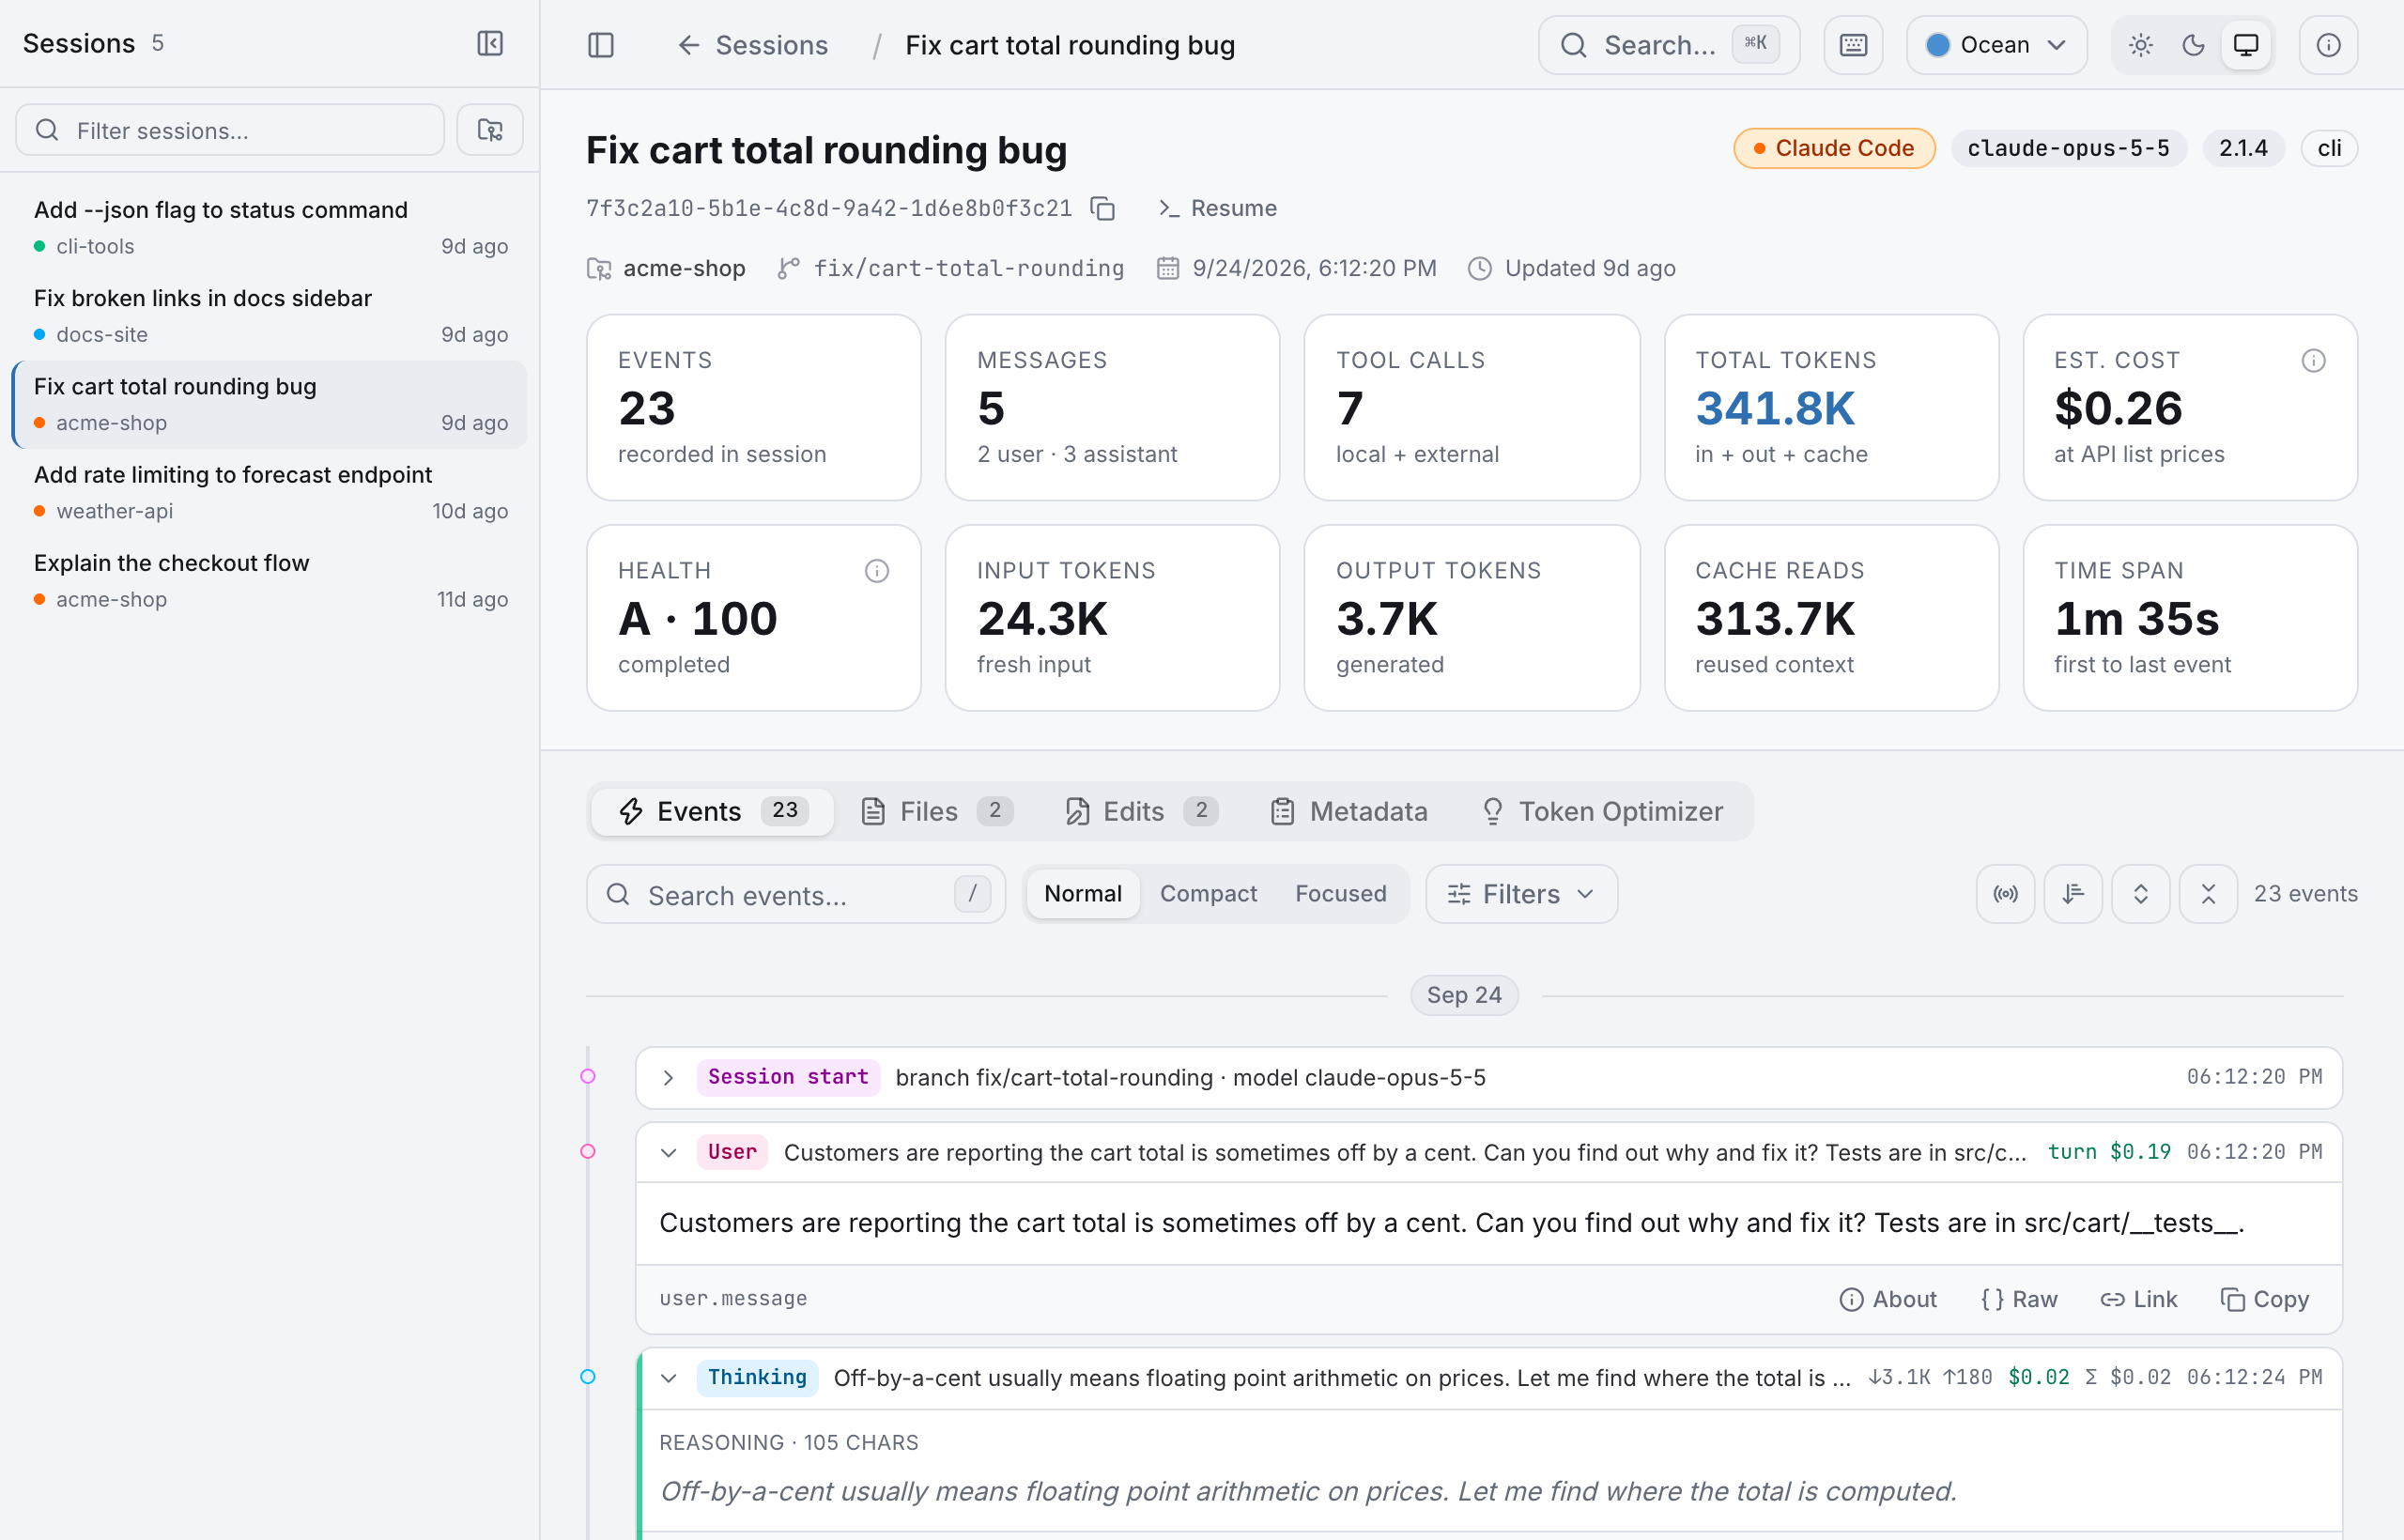
Step-by-step timeline. Prompts, reasoning, tool calls and their results in
order, with per-step token counts and cost. What the agent was given shows up
too: system prompt, tool catalog, MCP instructions and skill listings appear as
events with their size. Expand any event to see its content, or open the raw
record.
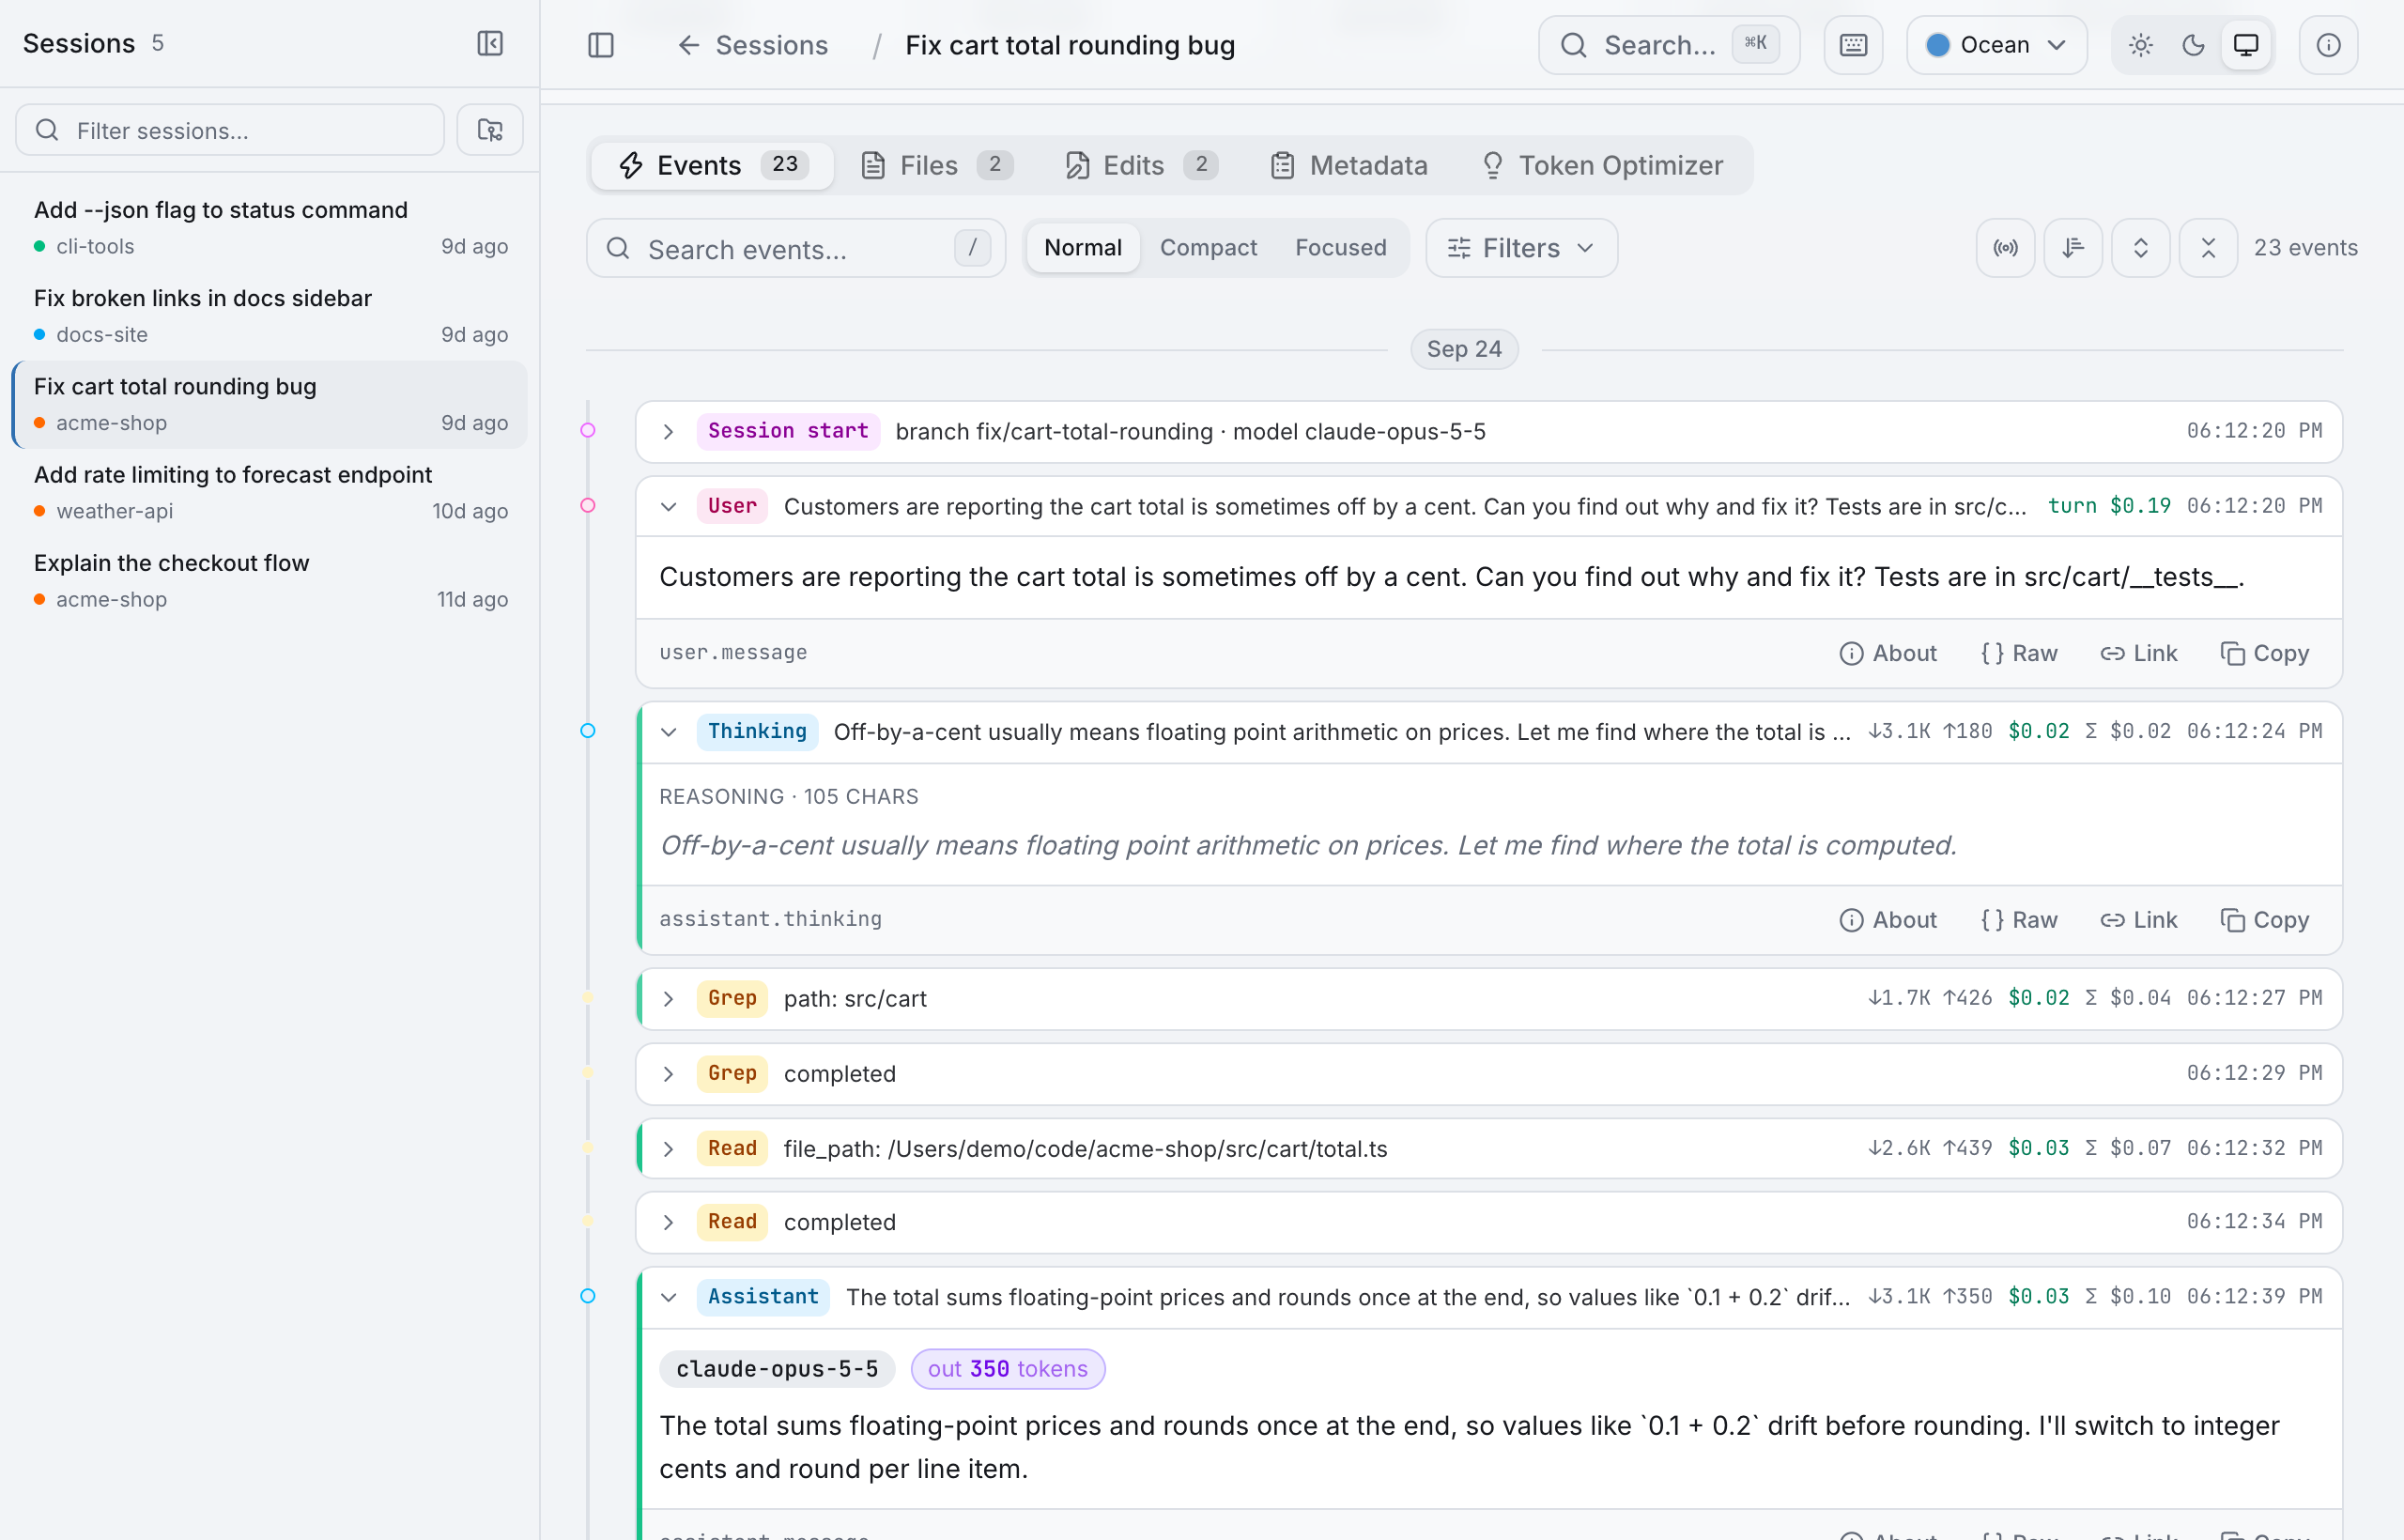
Cost and Token Optimizer. The Cost tab shows what the session cost by token
class, model and turn, with a table of every model request (context size,
uncached input, cache write, cache read, output) grouped by turn. The Token
Optimizer tab shows hints for trimming expensive sessions, where the context
went (system prompt vs. tool results vs. replies) and which tools ran most.
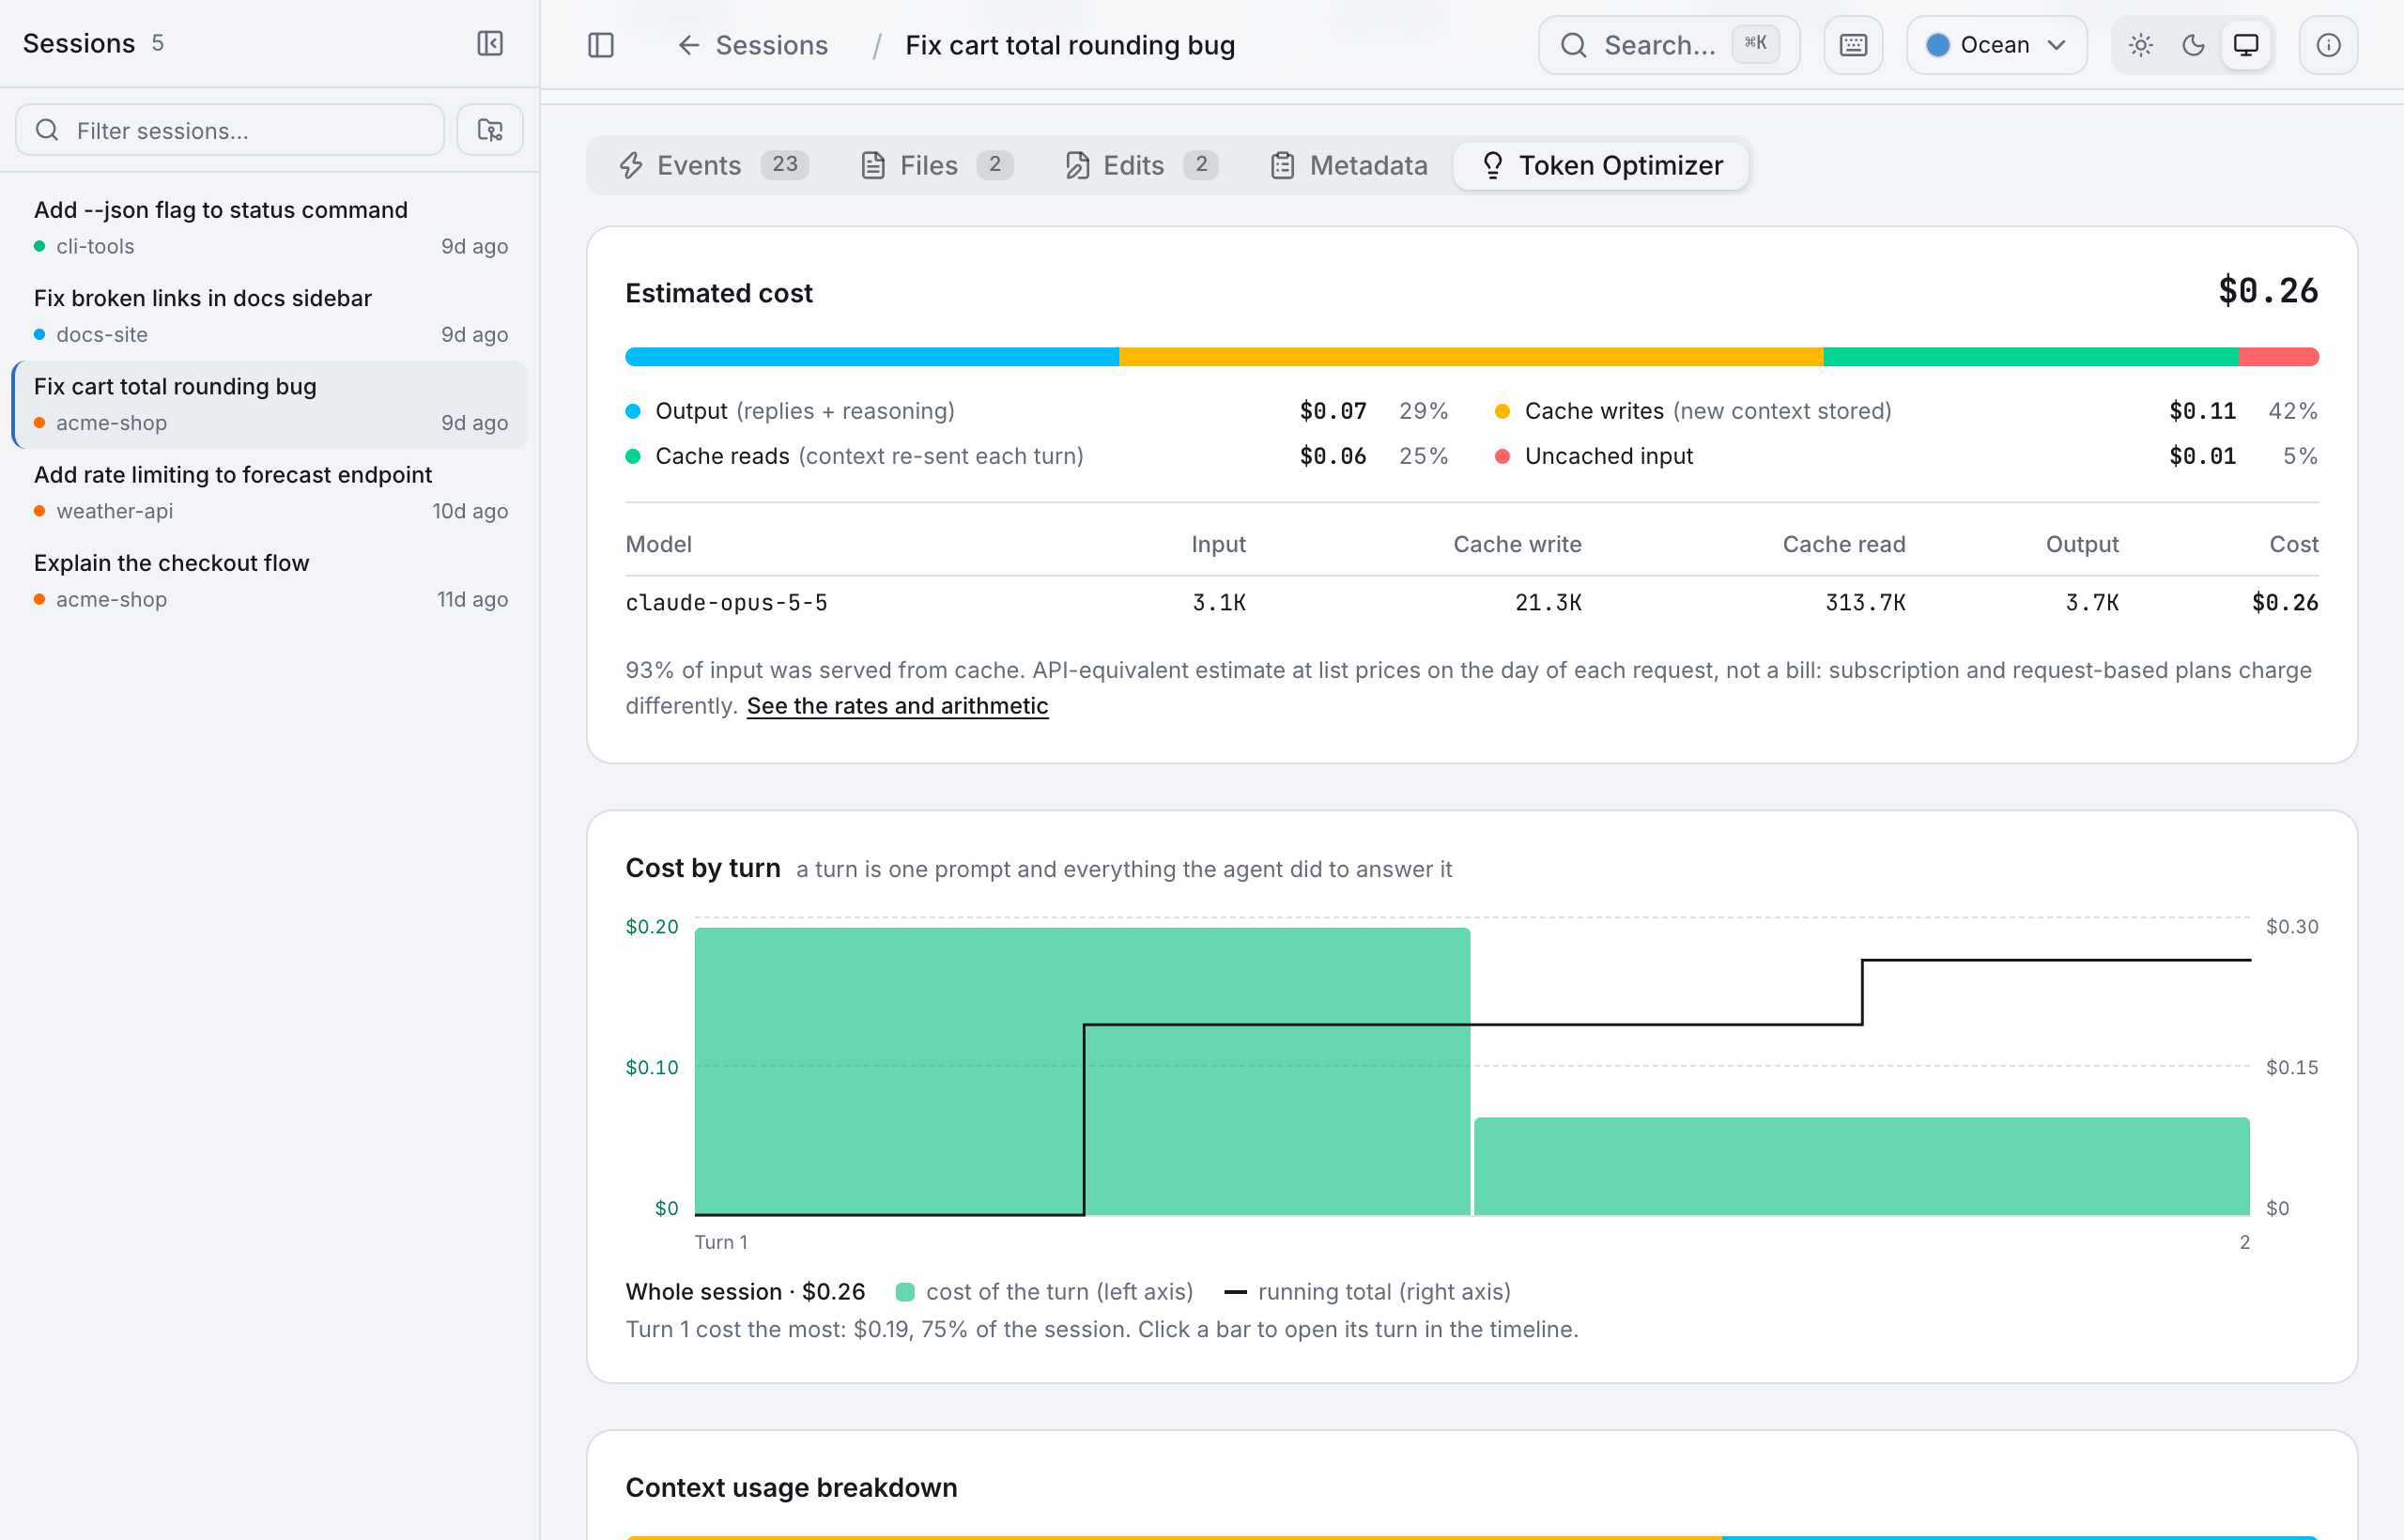
Session health. A score out of 100 and a grade for how smoothly the session
ran, with links to the failed tools, retry loops and interrupted turns that cost
it points. See Session health.
Edits per turn. A session's Edits tab lists each prompt with the files the
agent wrote, edited or patched in response, linked to the event in the timeline.
Find the session worth inspecting
Full-text search. ⌘K / Ctrl+K searches every transcript of every agent:
prompts, replies, reasoning, tool arguments and tool results, as well as titles,
repos and branches. Each hit shows the matching line and what kind of event it
came from.
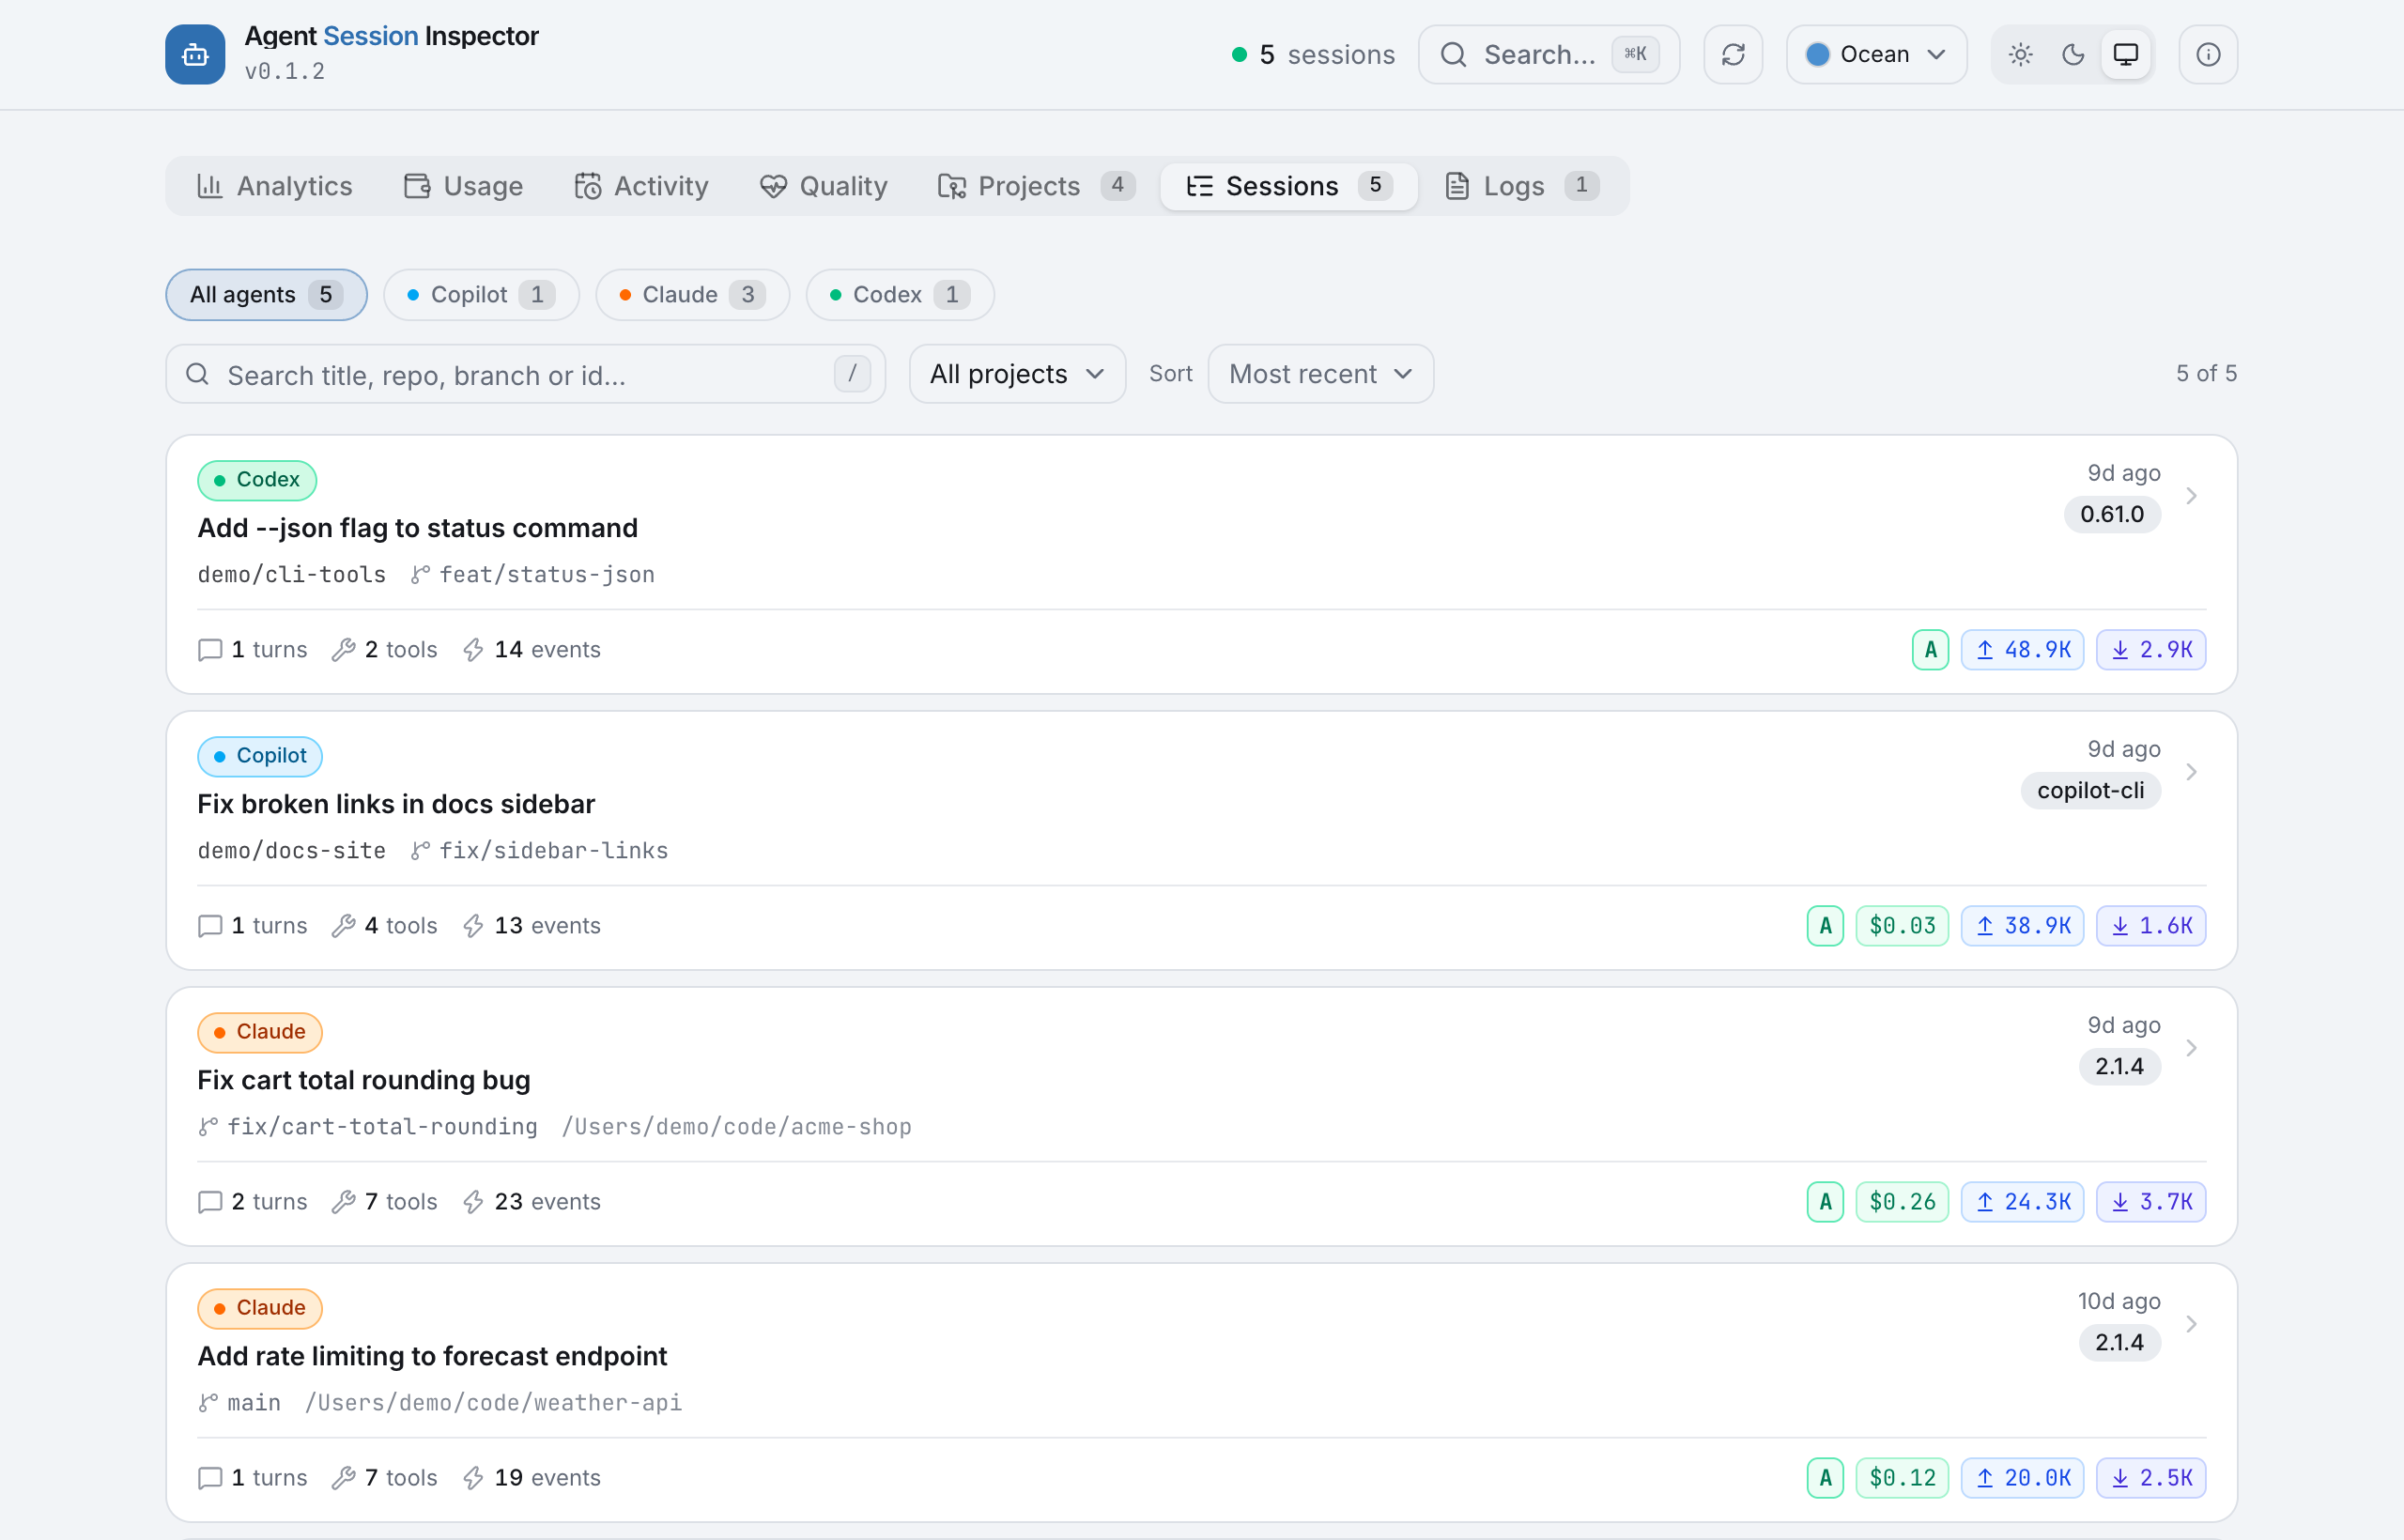
All sessions in one place. Every session of every supported agent on the
machine, filterable by agent. Each card shows turns, tool calls, health grade,
cost and tokens in/out at a glance.
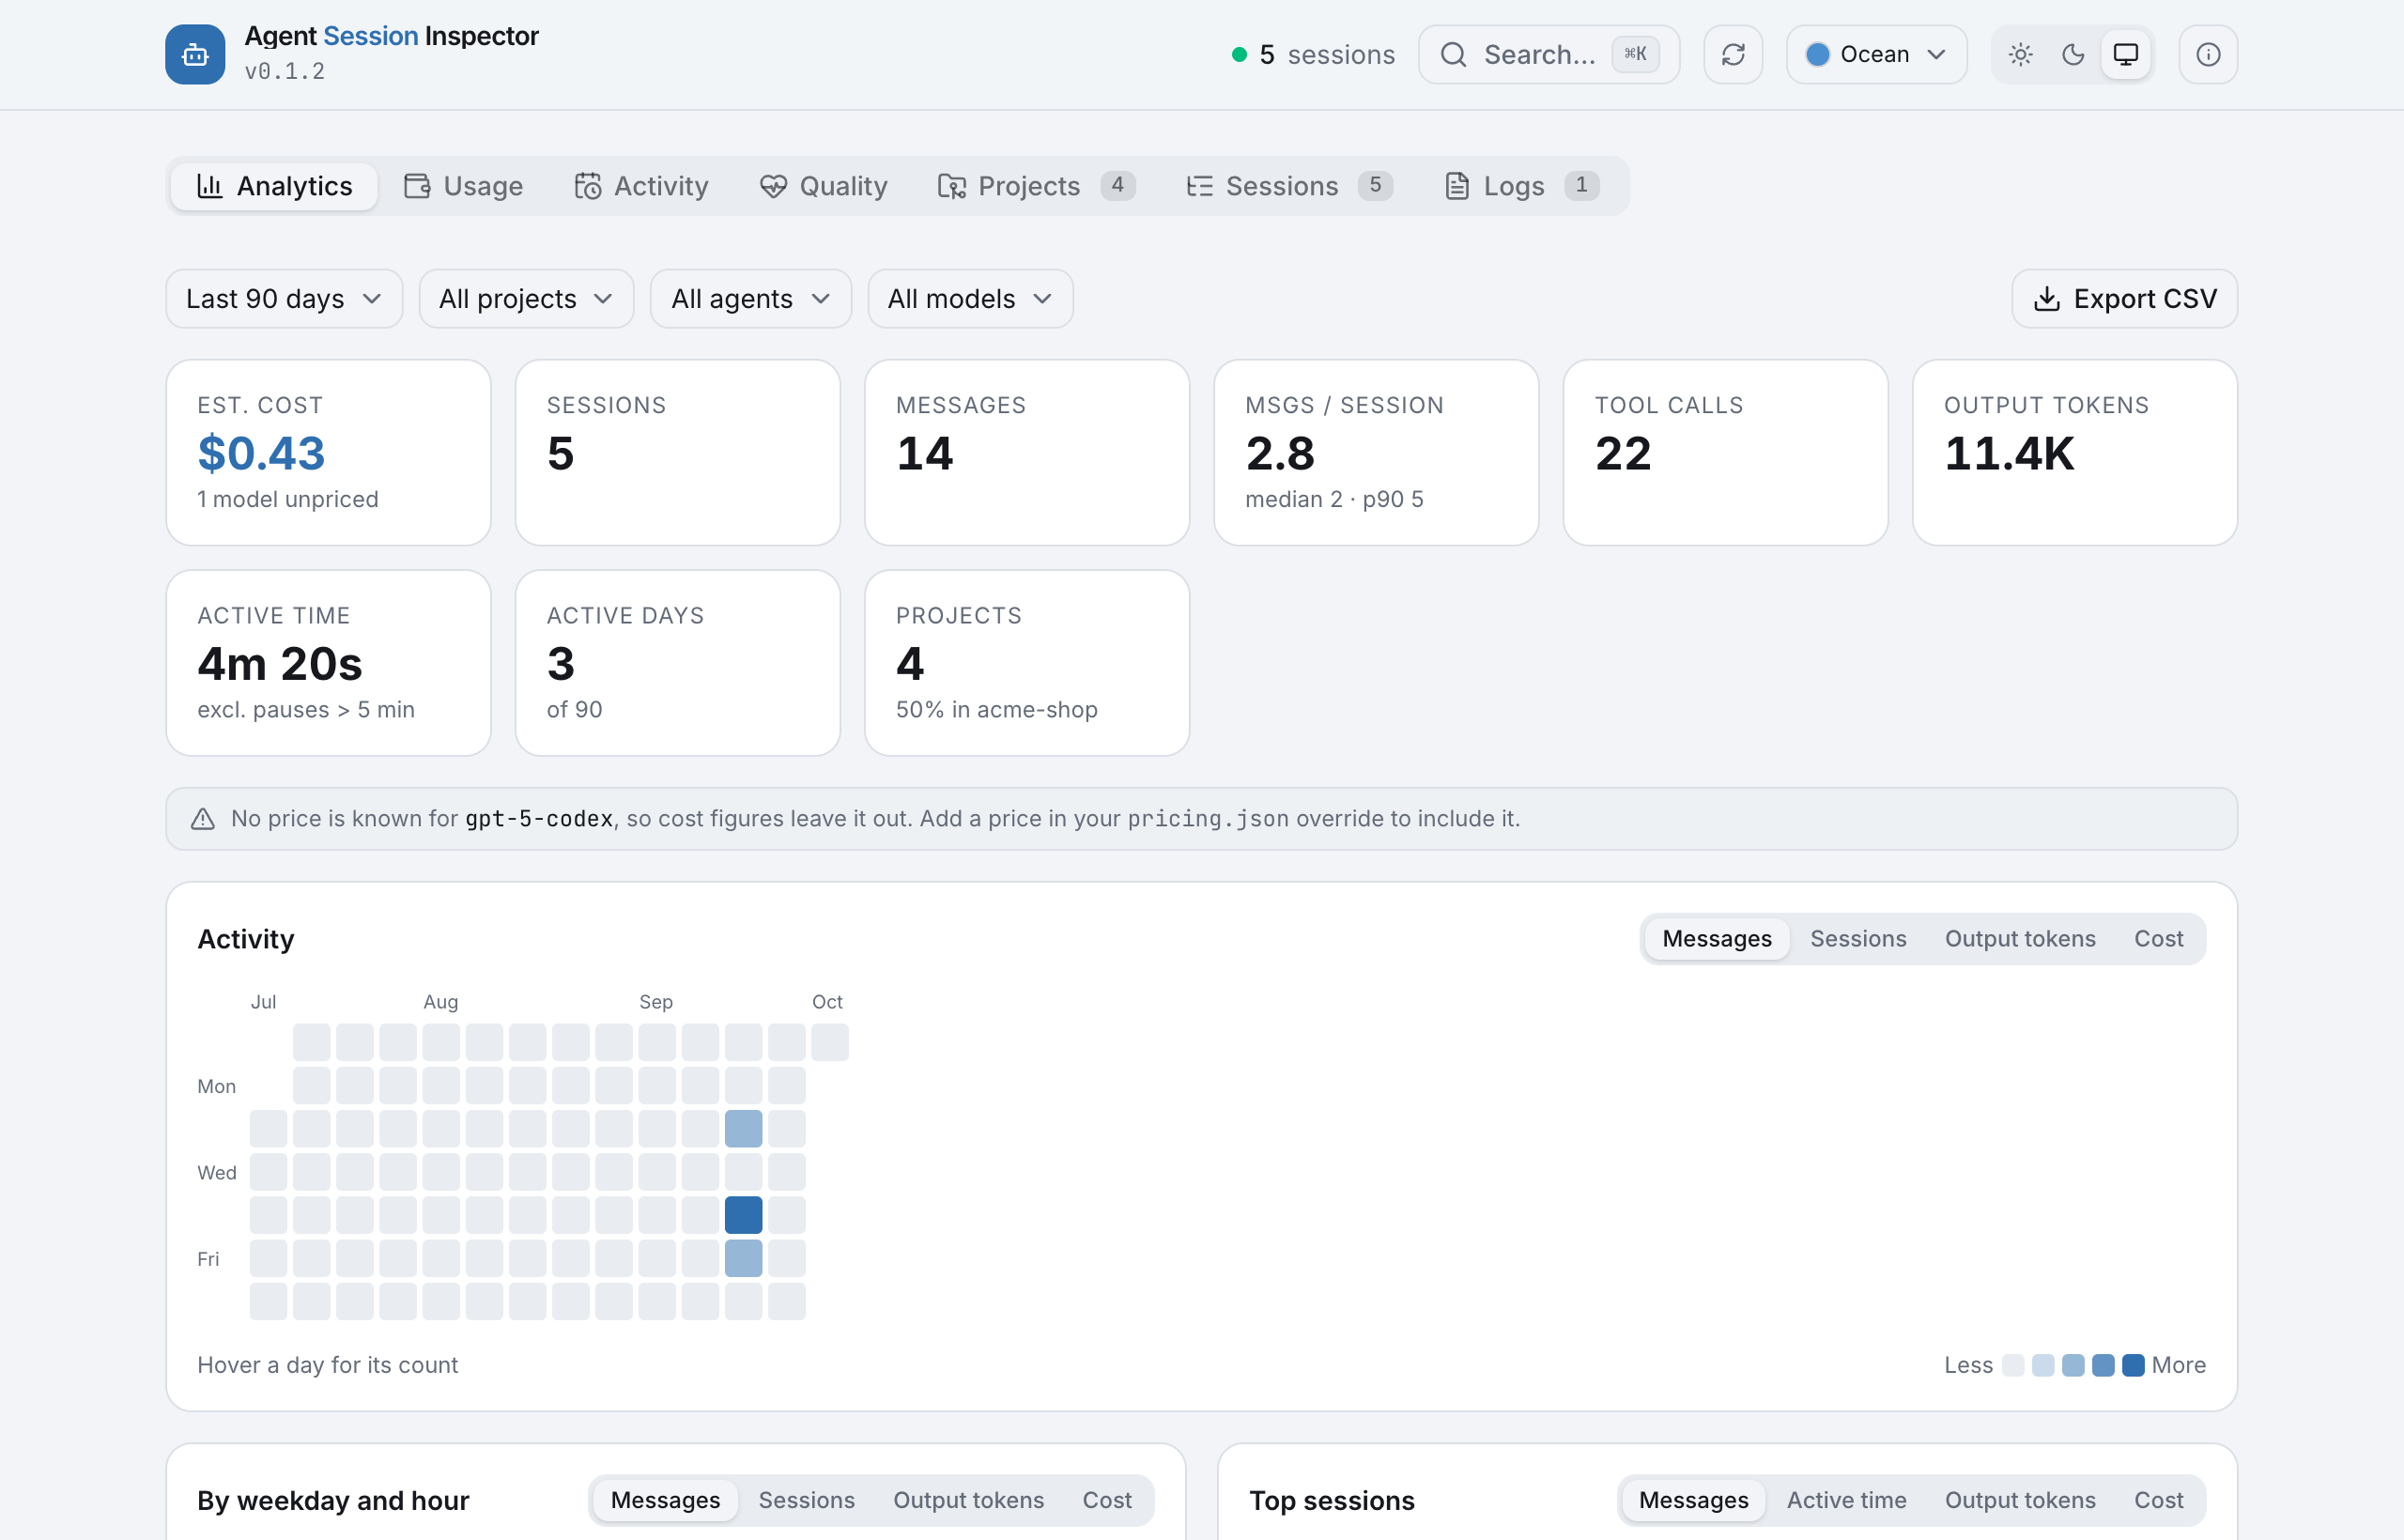
Analytics across sessions. Cost, messages, tool calls and active time for
the selected range, with an activity calendar and filters for project, agent
and model.
Projects. Sessions are grouped by the repository they ran in, so work
started from a subfolder or a git worktree lands in the same project. The
Projects tab lists each one with its sessions, cost and tokens, and picking a
project filters Analytics, Usage and Sessions together. Outside a repository,
the working directory is the project; the dated scratch folders the Codex app
creates for project-less chats count as one project.
Activity. One day at a time: how many sessions were working at once in each
15-minute slot, the agent time and cost of each session, and the day's split by
project, model and agent.
Skills and MCP tools. The Analytics tab counts which skills were loaded and
which MCP servers and tools were called, for the selected range.
Tool output. Which tools and MCP servers filled the context, over any date
range: the input the model wrote for their calls (commands, scripts, file
contents), the output they returned, and how much of both was re-sent.
Both stay in the prompt of every later request until a compaction, so a bigWrite or tool result early in a long session is paid for many times; the
re-sent count adds that up and prices it at each request's cache-read rate, and
the cost adds the model writing the input at its output rate. Expand
a shell tool to split it by command (cat, git diff, npm run test, …) or an
MCP server to split it by tool. Click any name for a page of every result
behind it in the range, by result or by session; open a row there to read what
the call asked for and what it returned, without leaving the list. The table points at what to trim (whole-file
reads, noisy commands, MCP servers that return large payloads), and each
session's Token Optimizer has the same table plus links to its largest results,
with the command that produced each one. Sizes are estimated at about 4 characters per
token, since transcripts rarely record a result's tokens.
Screenshots use synthetic demo data:
npx agent-session-inspector --demo
shows the same sessions. To reproduce them from a checkout, see
CONTRIBUTING.md.
Terminal reports
The same numbers are available without the web UI. Each command reads the
transcripts, prints a report and exits:
npx agent-session-inspector usage      # tokens and estimated cost per day
npx agent-session-inspector stats      # sessions, messages, tools and time, by agent
npx agent-session-inspector tools      # which tools and MCP servers filled the context
npx agent-session-inspector sessions   # recent sessions with cost and health
$ npx agent-session-inspector usage --by model --all
Token usage · all time · by model

Model                      Sessions  Input  Output  Cache read  Cache write   Total  Est. cost
─────────────────────────  ────────  ─────  ──────  ──────────  ───────────  ──────  ─────────
claude-opus-5-5                   1   2.5K    3.4K      318.0K        23.1K  347.0K      $0.26  ████████████████
claude-sonnet-5                   1   2.0K    2.5K      235.1K        19.1K  258.8K      $0.12  ███████▊
gpt-5.1                           1  11.6K    1.6K       27.3K            0   40.5K      $0.03  ██▏
─────────────────────────  ────────  ─────  ──────  ──────────  ───────────  ──────  ─────────
Total                             3  16.1K    7.5K      580.4K        42.2K  646.3K      $0.41
Reports cover the last 30 days unless --days <n> or --all says otherwise.--agent, --project and --model narrow them, and --json prints the data
for scripts. usage groups by day by default; --by takes week, month,project, model or agent. sessions --sort cost lists the most expensive
sessions first. <command> --help lists every option.
Scripting
The tables are for reading: values are rounded, and piping one drops the rules
and bars but keeps the rounding. For automation use --json, which prints exact
numbers under stable names:
npx agent-session-inspector usage --days 1 --json | jq '.total.costUSD'
npx agent-session-inspector sessions --sort cost --json | jq -r '.sessions[].id'
Every report carries schemaVersion (currently 1) and days (null for all
time). New fields may appear within a version; a field is renamed or removed
only with a new one. Costs are US dollars, or null where no price is known.
| Command | Fields |
|---|---|
usage |
by, rows[], total, unpricedModels. A row has key, sessions, inputTokens, outputTokens, cacheReadTokens, cacheWriteTokens, totalTokens, costUSD; total has the same without key. |
stats |
totals, messagesPerSession, agents[], projects[], tools[], skills[], mcpServers[], unpricedModels. |
tools |
charsPerToken, tools[], total (rows before --limit), unpricedModels. A row has name (mcp__server for an MCP server), sessions, results, chars (output), largest, inputChars, inputUSD (writing the input), carriedTokens and carriedUSD (re-sending input and output); an MCP server adds tools[] and a shell tool commands[], each with the same fields. |
sessions |
sort, total (matches before --limit), sessions[]. A session has agent, id, title, project, model, createdAt, updatedAt, userMessages, toolCalls, inputTokens, outputTokens, estimatedCostUSD, health. |
Supported agents
| Agent | Reads from | Session titles | Logs |
|---|---|---|---|
| GitHub Copilot CLI | ~/.copilot/session-state, ~/.copilot/logs |
checkpoint DB | yes |
| GitHub Copilot Chat (VS Code) | <Code>/User/workspaceStorage/*/chatSessions |
chat title | no |
| Claude Code | ~/.claude/projects/<project>/<session>.jsonl |
custom/ai titles |
no |
| Claude Cowork | <Claude>/local-agent-mode-sessions |
session descriptor | no |
| OpenAI Codex CLI | ~/.codex/sessions/YYYY/MM/DD/rollout-*.jsonl |
session_index.jsonl |
no |
| OpenCode | ~/.local/share/opencode/opencode.db |
session table |
no |
| Hermes Agent | ~/.hermes/state.db |
sessions table |
no |
| Gemini CLI | ~/.gemini/tmp/<project>/chats/session-* |
session summary | no |
| Cursor | <Cursor>/User/globalStorage/state.vscdb |
chat name | no |
<Code>, <Claude> and <Cursor> are the desktop apps' data folders:~/Library/Application Support/… on macOS, %APPDATA%\… on Windows,~/.config/… on Linux. VS Code Insiders is read too. The SQLite stores are
opened read-only.
Three things differ from the CLIs that log every request:
- Copilot Chat meters a whole request, and its prompt count is that of the
last model round. For a request that called tools, input tokens and cost are a
floor. - Hermes counts tokens per session, so its usage appears as one checkpoint at
the end of the timeline rather than per message. - Cursor rarely writes token counts to disk, so most of its sessions show the
timeline, tools and timing but no tokens or cost. Only the chat table ofstate.vscdbis read. A session that is not in it, such as one from the
Cursor CLI, is read from the plainer transcript under~/.cursor/projects,
which has no tool results and is timed to the minute.
Whichever directories exist on the machine show up; the rest are hidden.
Privacy
Transcripts hold your prompts, code and file contents, so the app is built to
keep them on the machine. Nothing about you or your sessions is collected, by
this project or anyone else:
- No data collection. There is no telemetry, analytics, crash reporting,
account or sync, and Next.js's own telemetry is switched off. - No outbound requests. The app reads the session files in place and talks
only to your browser. Fonts and the price table used for cost estimates are
bundled, not fetched. The one download is the app itself, whennpxor the
install script fetches it. - Local only. The server binds to
127.0.0.1, so other machines on your
network cannot reach it unless you pass--host. - Read-only. Session files are only read, and the SQLite stores are opened
read-only. The app never edits or deletes a transcript.
You don't have to take this on trust. The code is open, and the browser's
Network tab shows every request going to localhost and nowhere else; the app
works the same with the network disconnected.
How it compares
AgentsView and
ccusage read the same transcript files.
AgentsView is an archive and search tool across all your sessions; ccusage
prints usage and cost reports in the terminal. This project is for the step
after that: opening one session to see what the agent was given, what it did
with it, and what each step cost. It keeps no database and makes no outbound
requests.
How it works
Every agent writes a different transcript format, so the app normalizes them into
one canonical event vocabulary and the UI only ever sees that.
src/lib/providers/
  types.ts      canonical model: SessionMeta, AgentEvent, SessionDetail, SessionProvider
  analysis.ts   provider-agnostic stats + token-cost hints
  pricing.ts    dated price table lookup, per-event and per-session cost
  prices.json   bundled list prices, USD per million tokens
  fs-utils.ts   jsonl reading, directory walking, mtime-keyed caching
  sqlite-utils.ts  read-only access to agents that keep sessions in SQLite
  copilot.ts    ~/.copilot adapter
  vscode.ts     Copilot Chat in VS Code: replays the editor's chat change logs
  claude.ts     ~/.claude adapter
  cowork.ts     Claude desktop agent mode; reuses the Claude transcript parser
  codex.ts      ~/.codex adapter
  opencode.ts   OpenCode's opencode.db
  hermes.ts     Hermes Agent's state.db
  gemini.ts     Gemini CLI: replays the session logs under ~/.gemini/tmp
  cursor.ts     Cursor's state.vscdb, else its ~/.cursor/projects transcripts
  index.ts      registry: listSessions / getSession / listLogs across providers
Events are typed category.subCategory — user.message, assistant.message,assistant.thinking, tool.execution_start, tool.execution_complete,external_tool.requested, context.attachment, file.patch_applied,web.search, session.*. Anything an adapter emits outside that list still
renders through a generic card, so a new record type is never a crash.
Token accounting is centralized: adapters put per-message usage on the event
(inputTokens / outputTokens / cacheReadTokens) or, when a provider reports
running totals, attach data.sessionTotals. The latest sessionTotals wins over
summation.
Cost estimates
Each session, and each request in the timeline, shows an estimated cost in
dollars. Adapters attach data.billedUsage to the events that carry usage, with
uncached input, cache reads, cache writes and output kept as separate,
non-overlapping counts, and pricing.ts multiplies them by the model's list
price. The Cost tab splits the total by token class and by model.
The figure is an API-equivalent estimate, not a bill: subscription and
request-based plans charge differently, and requests an agent makes outside the
transcript (title generation, for example) are not counted.
Prices are never stored with a session; cost is computed on every load. To
correct a price, add a model the bundled table does not know, or record a price
change, create ~/.agent-session-inspector/pricing.json. It is merged overprices.json per model and picked up without a
restart:
{
  "my-local-model": { "input": 0, "output": 0 },
  "claude-opus-5-5": [
    {
      "input": 4,
      "output": 20,
      "cacheRead": 0.2,
      "cacheWrite": 5,
      "cacheWrite1h": 8
    },
    {
      "from": "2027-01-01",
      "input": 3,
      "output": 15,
      "cacheRead": 0.15,
      "cacheWrite": 3.75,
      "cacheWrite1h": 6
    }
  ]
}
A model with several entries is priced by date: each request uses the entry
whose from day is the latest one on or before the request, so a price change
does not rewrite the cost of older sessions. Models with no price show as
unpriced and are left out of the total rather than counted as free.
Session health
Every session gets a score out of 100 and a grade (A to F), shown on its card
and in its header. The score is rule-based and read straight off the transcript
by health.ts: it measures how smoothly the session ran, not whether the result
was any good. A session starts at 100 and loses points for:
| Signal | What it means | Points |
|---|---|---|
| Unfinished | Ends on an API error, or stops without a final reply | 25 / 15 |
| Tool failures | Share of tool results that failed | up to 25 |
| Retry loops | The same tool failing three times in a row | 6 each, max 18 |
| API errors | Errors and retried requests | 2 each, max 10 |
| Interrupted turns | Turns stopped before the agent finished | 4 each, max 12 |
| Compactions | Context summarized mid-session | 3 each, max 9 |
90 and up is an A, 80 a B, 70 a C, 60 a D. A session that is still running is not
marked down for being unfinished. Click the Health card on a session to see what
it lost points for and jump to those events; the Quality tab on the home page
shows grades, outcomes and the most common problems across sessions.
Contributing
Bug reports and pull requests are welcome; open an
issue for anything that looks wrong, ideally with the
agent, OS and Node version. CONTRIBUTING.md covers running
from source, demo data, adding a provider and releasing.
License
MIT © Kishan Mundha
Yorumlar (0)
Yorum birakmak icin giris yap.
Yorum birakSonuc bulunamadi