kubegap
Health Warn
- License — License: MIT
- Description — Repository has a description
- Active repo — Last push 0 days ago
- Low visibility — Only 5 GitHub stars
Code Pass
- Code scan — Scanned 12 files during light audit, no dangerous patterns found
Permissions Pass
- Permissions — No dangerous permissions requested
No AI report is available for this listing yet.
Read-only Kubernetes operations audit as an Agent Skill. 403 checks, a report a person can read, every morning.
kubegap
한국어: README.ko.md





Five minutes of reading every morning, instead of an afternoon of digging.
Auditing a cluster is toil. Google's Site Reliability Engineering book calls work toil when it is manual, repetitive, automatable and grows with the service, and says reducing it is the point of SRE. kubegap takes that toil off your hands so your time goes to engineering.
kubegap comes out of running three clusters alone on three platforms: a small k3s cluster, EKS at work, and a client's Kubernetes on Azure. Alerts and dashboards catch only what someone already defined. Everything else shows up only when you go digging through the cluster by hand, and three clusters do not leave time for that every day. kubegap does the digging: it reads the cluster, judges it against 403 written checks, and writes a report a person can read.
kubegap is a skill in the Agent Skills standard, the open format that coding agents such as Claude Code and Codex read, so any of them can run it with one command. It reads your cluster, read-only, and never touches a Secret value. It grades the cluster against 403 checks in 12 areas. Then it writes you a report: what is wrong, what the evidence is, why it happened, what to do, and, when the check definition records one, a public case that looked the same.
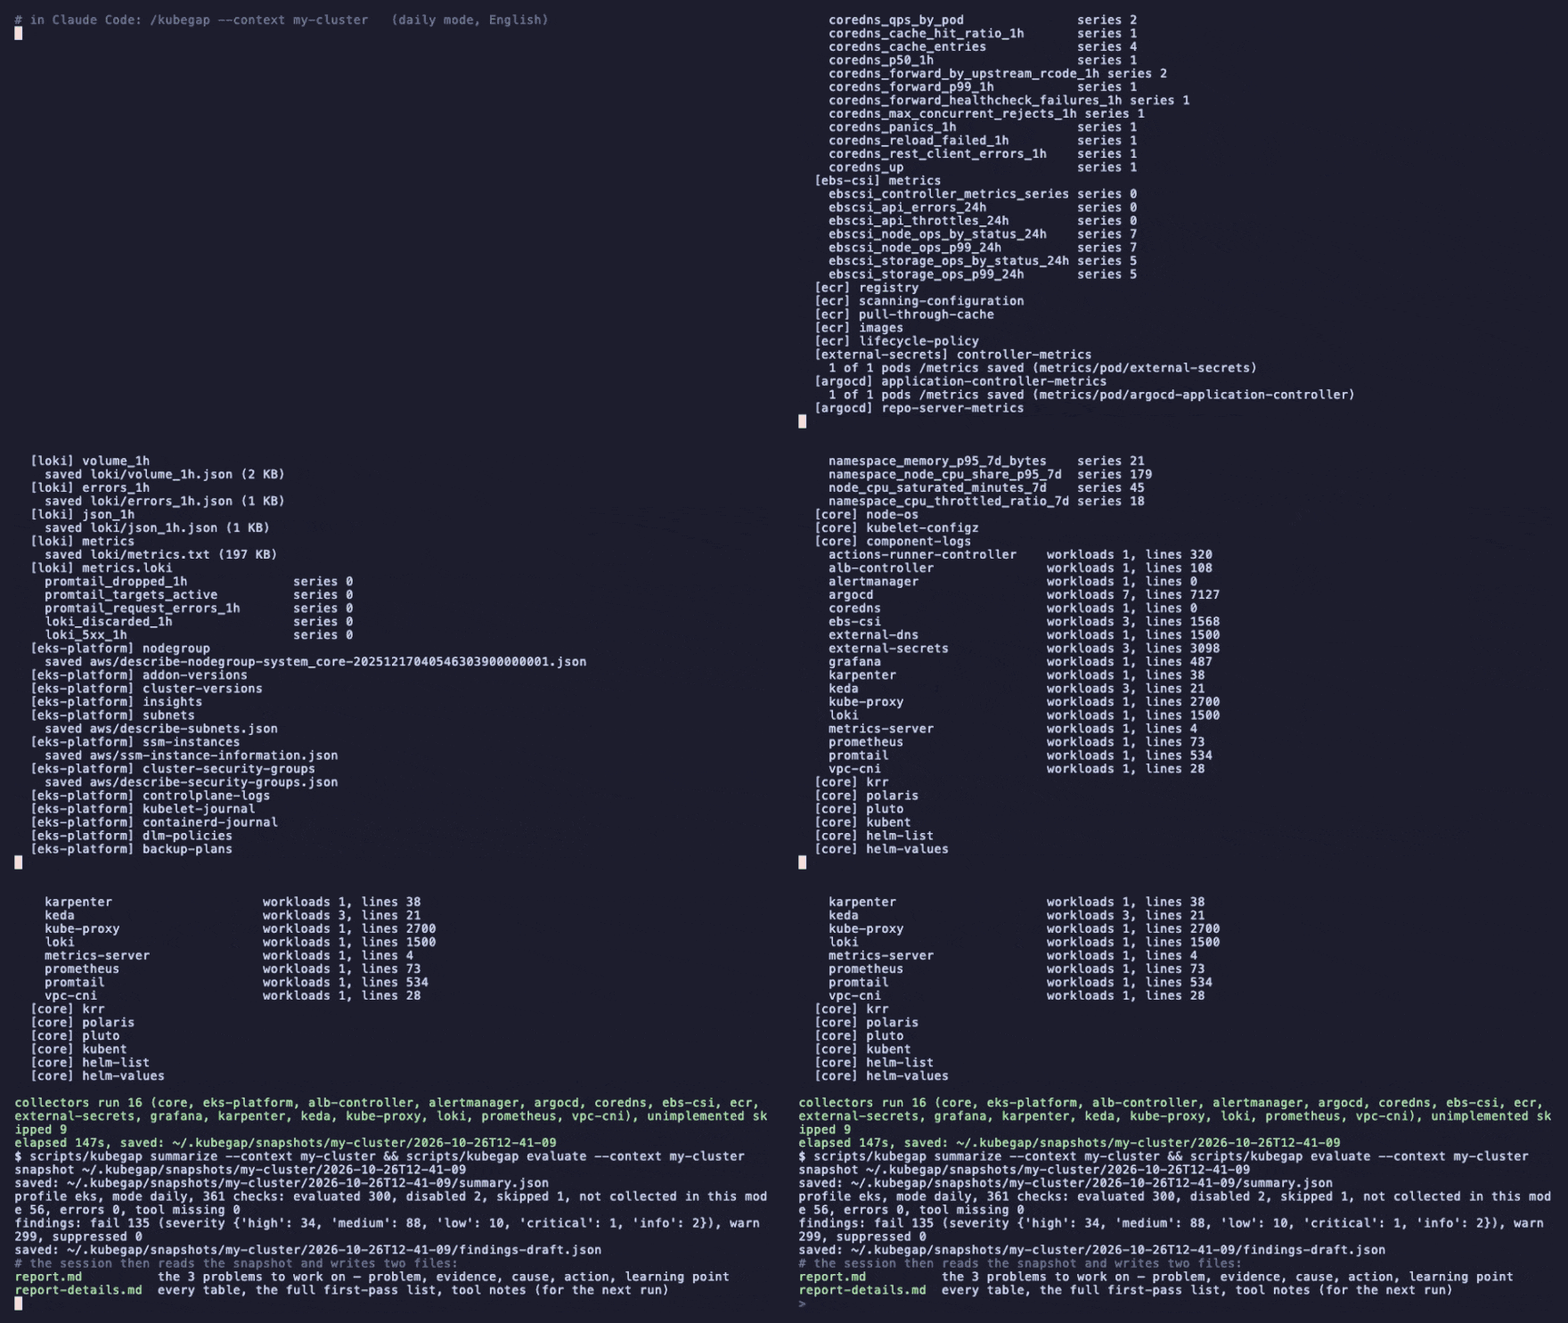
Replay of a real daily run with names masked.
What you get
The report writes every problem in six parts: the problem, the evidence with its source file, the cause, the fix and how long it takes, why this happens, and the checks the verdict rests on. Below is the first problem from a full audit of a real 8-node EKS cluster. Names are masked.
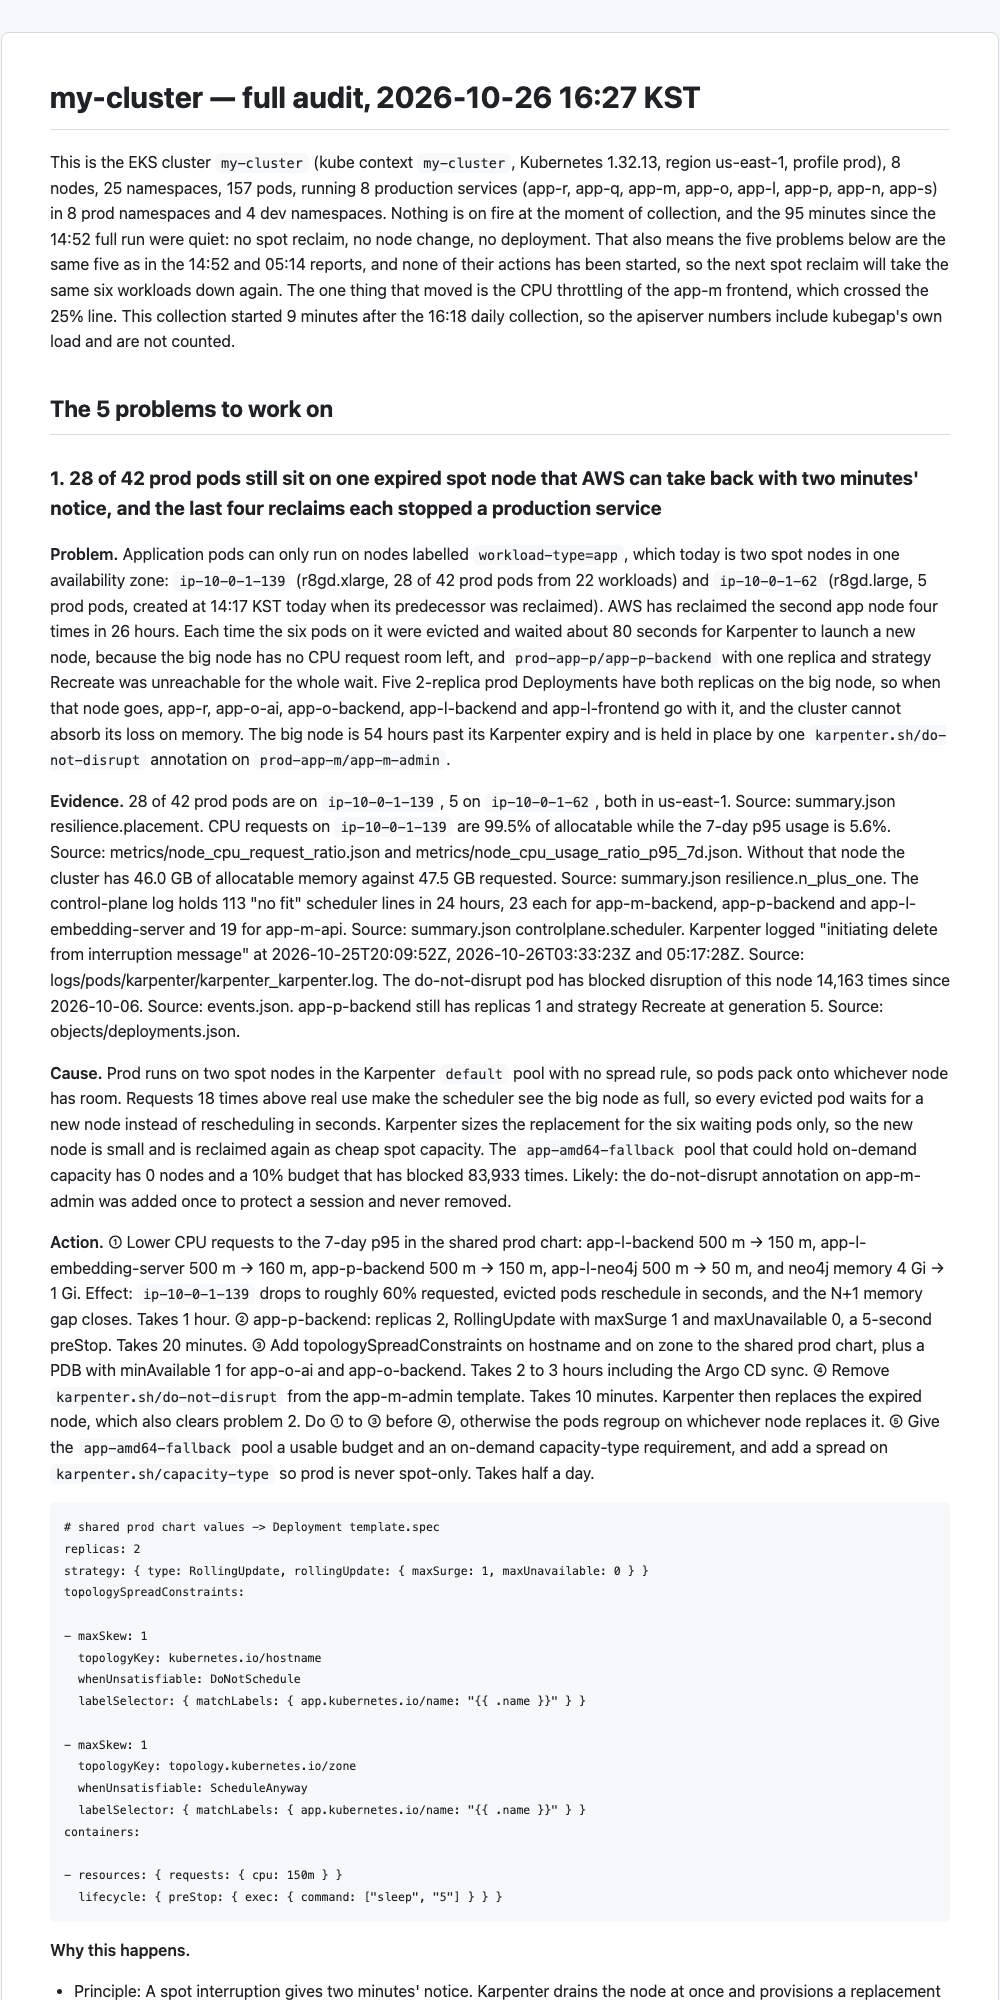
Why this happens.
- Principle: A spot interruption gives two minutes' notice; Karpenter drains the node at once and provisions a replacement sized for the pending pods, so the gap users see equals node launch time plus pod start time unless the remaining nodes have request headroom. The scheduler places by requests, not usage, so requests 18 times above real use turn an idle node into a "full" one.
- Cases: No public case recorded for this check. The check definition records its own measurement: on the first real run of this check, a single spot reclaim stopped a production service for 2 minutes 7 seconds while that node held 27 production pods (64%).
- Read next: the Kubernetes docs on Pod Topology Spread Constraints, the Karpenter docs on Disruption, and the AWS docs on EC2 Spot Instance interruption notices.
The full sample reports, daily and full, for an EKS cluster and a small k3s cluster are in samples/.
Three things to know:
- One command, every morning.
/kubegapis the daily run: a one-page report with the 3 problems to work on, compared with yesterday's daily run./kubegap fullis the deep one: everything collected, the 5 problems, every table. - It only reads and never changes anything. The only Kubernetes verbs it uses are
get,listandwatch, and it never reads a Secret value or stores a ConfigMap value, with one exception:helm listreads Helm's own release records, which Helm stores in Secrets, and only their metadata is kept. The exact ClusterRole and IAM policy are indeploy/permissions/. The numbers come from deterministic scripts and are the same on every run. The judgment and the writing come from the agent, and every change it makes to a first-pass verdict is written in an adjustment table with the reason. - It doesn't just find problems; it explains them. Every problem ends with the principle behind it, a public case when the check definition has one, and what to read next. Sources are never invented: that section cites only what the check definition or a primary document says.
The daily run is for whoever is on the hook for a cluster this morning: a solo operator, the on-call engineer, a platform team that wants one page before standup. The full run is for the moments that deserve an afternoon: taking over a cluster, preparing an upgrade, a quarterly review, a post-incident look at what else is fragile. kubegap is not a monitoring or alerting system, and it does not fix anything. It audits the monitoring you already have, and it only reads.
On its first run against a production EKS cluster, kubegap caught a live spot interruption that took a backend down for 2 minutes with zero alerts firing. That finding has been the first problem of every report on that cluster since.
Install
git clone https://github.com/KyungHwanKim-devs/kubegap ~/src/kubegap

# Claude Code
ln -s ~/src/kubegap ~/.claude/skills/kubegap
/kubegap

# Codex
ln -s ~/src/kubegap ~/.agents/skills/kubegap
$kubegap
The folder must be named kubegap. Other Agent Skills hosts such as Cursor and GitHub Copilot take the same link in their own skills folder, and npx skills add KyungHwanKim-devs/kubegap installs it in one line.
You need kubectl, jq, python3 3.11 or newer, and a kubeconfig that can read the cluster. /kubegap asks once whether you want the report in English or Korean and confirms the context. It checks for optional tools and installs them only with your consent. Then it finds and port-forwards Prometheus and Loki and runs collection through to the report. The optional tools aws, helm, krr, polaris, pluto, kubent, promtool, amtool, argocd and ssh are not required. If one is missing, only the checks that depend on it are dropped, and the report lists it under "tools missing".
Supported platforms: macOS on Apple Silicon and Intel, Linux on amd64 and arm64, and Windows through WSL2.
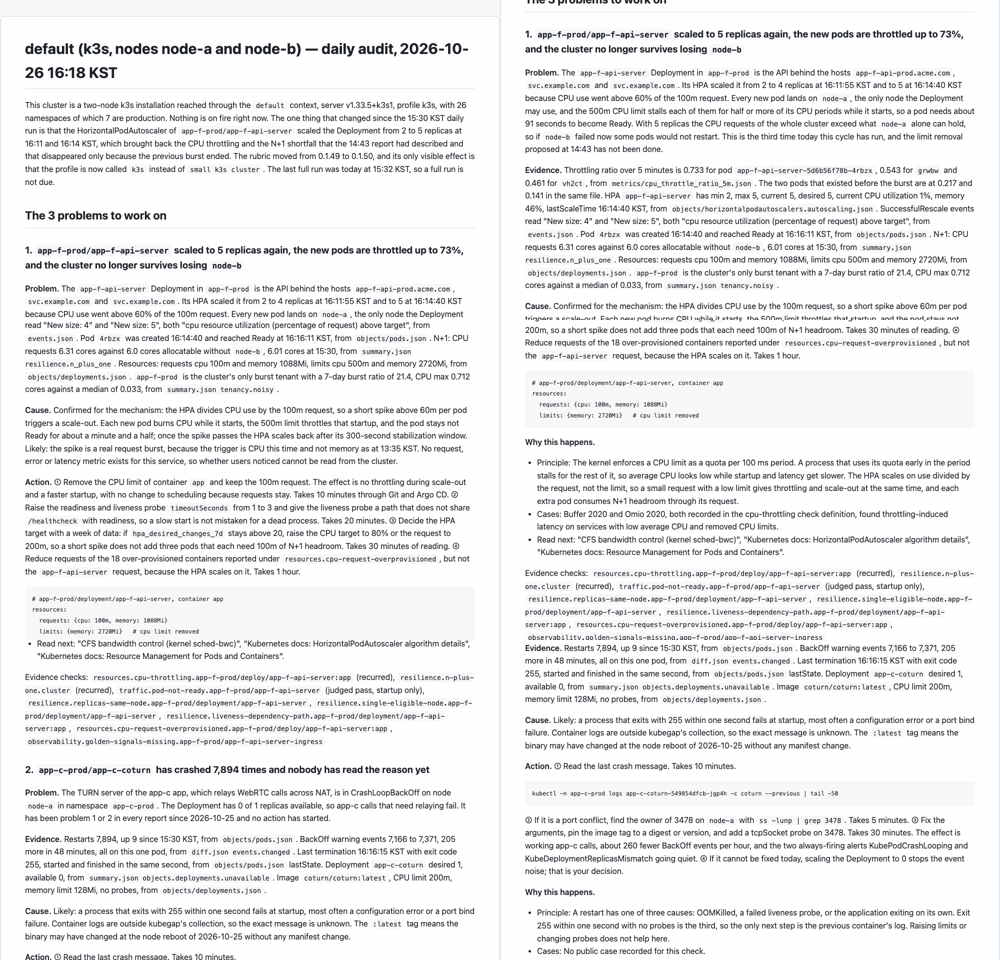
/kubegap                      # daily: the 3 problems to work on, what changed since the previous daily run
/kubegap full                 # everything: all 12 areas, the 5 problems, every table in report-details.md
/kubegap focus resilience     # one area in depth
/kubegap explain <finding-id> # one finding, explained down to the raw files
/kubegap --compare <A> <B>    # diff two snapshots
Two modes
daily (default) |
full |
|
|---|---|---|
| Collects | Kubernetes objects, events, Prometheus metrics, component logs, AWS inventory | the same plus node OS scripts (SSM/SSH), CloudWatch control-plane logs and metrics, cost and pricing, ECR, service quotas, krr/polaris/pluto/kubent/helm |
| Checks | 403 minus the ones that need full-only inputs; those are reported as "not collected", not as findings | all 403 |
| Report | report.md: the 3 problems, each with evidence, cause, action and cases; what changed since the previous daily run; what the run could not see. report-details.md: every table |
report.md: the same shape with 5 problems. report-details.md: the 12-area detail and the full first-pass list as well |
| Compared with | the previous daily snapshot | the previous full snapshot |
Set mode: full in ~/.kubegap/config.yaml to make full the default. Daily and full snapshots live side by side under the same context folder and are never compared with each other.
A full snapshot is about 40 MB. scripts/kubegap prune --keep-daily 14 --keep-full 4 removes older ones, and retention in the config sets the defaults. It deletes without asking, so with retention set a bare scripts/kubegap prune already removes folders. Add --dry-run to see the list first. The latest daily and the latest full always stay.
What it checks
Twelve areas, 403 checks. Each row gives the count and a few examples; the full list is docs/CHECKS.md, which also says how many checks carry a public incident write-up and links each one. The rest are configuration rules with no known public incident, and the report says so instead of inventing one.
| Area | Checks | Examples |
|---|---|---|
| Resources | 15 | requests 3x above 7-day p95 usage, repeated OOMKills, nodes full of requests but single-digit utilization |
| Scaling | 27 | HPAs stuck at min for 15 days, expired Karpenter nodes never replaced, KEDA external triggers without fallback |
| Observability | 64 | no symptom-based alerts, alerts firing for 7 days straight, observability stack on emptyDir, ingress controller metrics not scraped |
| Traffic | 54 | database ports open to the internet, unhealthy ALB targets, deregistration delay longer than termination grace |
| Resilience | 43 | all replicas on one node, no PDB, backup dumps on the same disk as the source, workloads that can only land on one node |
| Hygiene | 34 | latest tags, deprecated APIs, Helm releases left in a pending or failed state, dependence on custom node labels |
| Storage | 25 | unencrypted EBS, StorageClasses without expansion, local-path volumes over capacity |
| Security | 46 | NetworkPolicies not enforced, IMDSv1 allowed, plaintext secret env vars (names only), wildcard RBAC |
| Cost | 13 | idle compute ratio, monthly cost of request waste, ECR repos without lifecycle |
| Multi-tenancy | 13 | prod namespaces without quota/NetworkPolicy/PSA, CI and prod on the same nodes |
| Node OS | 37 | disk and inodes, kernel OOM and NIC errors, no kubelet reservations, cgroup v1, images over 3 GiB |
| Platform | 32 | Kubernetes EOL, outdated add-ons, AMI age, service quotas near limit, slow k3s etcd, secrets encryption off |
Where it runs:
| Cluster | What it can see |
|---|---|
| EKS | Everything: inside the cluster and the AWS side (control-plane logs, node groups, add-ons, spot, cost) |
| k3s | Everything: inside the cluster and the node side (etcd, datastore, disks, kernel) |
| GKE, AKS, kubeadm and others | Everything inside the cluster. Nothing on the cloud side yet |
Components such as Karpenter, Argo CD and Prometheus are checked only when installed; the supported list is the folder names under collectors/.
What kubegap expects of a cluster is chosen from its platform and size: a production cluster is held to HA expectations such as a backup, an SLO and an alert router, a 1–3 node cluster is not asked for multi-zone spread or a PDB, and a dev namespace is held to less. The choice is automatic and can be overridden per cluster or per namespace in the config file; the profiles and what each one switches are described in config.example.yaml and rubric/profiles/.
What to check before the first run
kubegap does not have its own credential store. It reuses what is already on your machine: the kubeconfig, the AWS CLI, your SSH setup. This section lists each connection, where kubegap takes the information from, and how to check it yourself before the first run.
| Connection | Where it comes from | How to test |
|---|---|---|
| Kubernetes API | kubeconfig current context, or --context <name> |
kubectl get nodes |
| AWS (EKS only) | aws_profile / aws_region in ~/.kubegap/config.yaml, else the kubeconfig exec env AWS_PROFILE, else the AWS CLI default |
aws sts get-caller-identity --profile <p> |
| Prometheus, Alertmanager, Loki, Grafana | discovered in the cluster and port-forwarded; or prometheus_url / alertmanager_url / loki_url / grafana_url in config |
kubegap setup --context <name> (section 3/4) |
| Grafana dashboards | grafana_api_token in config (Viewer service-account token) |
same; skipped as "no credentials" without it |
| Node OS (EKS) | SSM send-command with the kubegap-node-read document, using the AWS credentials above |
scripts/kubegap nodes --context <name> |
| Node OS (k3s, bare metal) | SSH with ~/.ssh/config user and key, or the ssh: block in config |
scripts/kubegap nodes --context <name> |
| Node OS (no SSM, no SSH) | the DaemonSet in deploy/node-access/daemonset.yaml, read through kubectl exec |
scripts/kubegap nodes --context <name> |
| Optional tools | your PATH; kubegap setup lists what is missing and installs with consent |
kubegap setup --context <name> (section 1/4) |
Kubernetes. kubegap uses your kubeconfig's current context (kubectl config current-context) or the context given with --context <name>. You must already be able to run kubectl get nodes against the cluster with read permissions (see Required permissions for the exact ClusterRole). There is nothing else to configure.
AWS (EKS only). The AWS CLI must already work with credentials that carry the IAM policy in deploy/permissions/iam-policy.json. kubegap takes the profile and region from aws_profile / aws_region in ~/.kubegap/config.yaml when set, otherwise from the kubeconfig's exec env (AWS_PROFILE, as written by aws eks update-kubeconfig --profile <p>), otherwise from the AWS CLI default. A quick test: aws sts get-caller-identity --profile <p>. On a non-EKS cluster the AWS part is skipped entirely.
Prometheus / Alertmanager / Loki / Grafana. These are discovered inside the cluster (kube-prometheus-stack, Loki, Grafana Services) and reached through an automatic port-forward. If they live elsewhere (another cluster, a managed service, a VM), set prometheus_url, alertmanager_url, loki_url, grafana_url in the config and kubegap uses those addresses instead of port-forwarding. Grafana datasource and dashboard checks need grafana_api_token, a service-account token with the Viewer role; without it that part is skipped and reported as "no credentials". Without a metrics store, the checks that need 7-day usage history are skipped and the report says so.
Node OS access. This is the only part that may need preparation on the nodes themselves.
- EKS: nodes are read through SSM
send-command. The commands live in an SSM document,deploy/permissions/ssm-document.yaml, that has to exist in your account once:kubegap setupreports whether it is there and current, and uploads it when you agree (setup --install-ssm-document; this one call needsssm:CreateDocument,ssm:UpdateDocument,ssm:UpdateDocumentDefaultVersionandssm:ListDocumentVersionson your own credentials, not on the audit key). The node IAM role must includeAmazonSSMManagedInstanceCore(the EKS-optimized AMI already runs the SSM agent). - k3s / bare metal / kubeadm: nodes are read over SSH. kubegap connects to each node's InternalIP with the user and key from your
~/.ssh/config. If that is not how you reach the nodes, add anssh:block to the config:user,key,port, andhosts:mapping node name → address (oruser@address) for networks where the node InternalIP is not reachable from your machine (overlay networks such as Tailscale). Only nodes whose host key is already in your~/.ssh/known_hostsare reached, so connect to each node once by hand before the first run, or setaccept_new_hosts: truein that block. The user needs the log-reading groups described indeploy/node-access/README.md; the optional sudoers file unlocks the remaining root-only reads. - Neither SSM nor SSH (GKE, AKS, managed nodes): apply
deploy/node-access/daemonset.yamland kubegap reads nodes throughkubectl execinto that pod. The kubeconfig user also needsdeploy/permissions/role-daemonset-exec.yamlfor the exec. - Without any of these, only the node-OS checks (
node.*) are skipped as "no node access". Everything else runs.
Optional tools. helm, krr, polaris, pluto, kubent, argocd, promtool, amtool are found on your PATH. kubegap setup lists what is missing, which checks each one powers, and installs them with your consent (policy install_tools: ask|always|never in the config).
The config file. ~/.kubegap/config.yaml, created by copying config.example.yaml. Every key is listed there with a comment: context, profile, namespace_profiles, confirm_context, install_tools, language, snapshots_root, retention, aws_profile, aws_region, prometheus_url, alertmanager_url, loki_url, grafana_url, grafana_api_token, node_access, ssh, suppress, overrides. The file is optional; without it kubegap uses the current kube context and discovers everything else.
One command validates all of the above: kubegap setup --context <name>. That is scripts/kubegap setup, and /kubegap runs it for you. It prints four sections:
- which tools are missing and what each one powers;
- whether the cluster is reachable and how many nodes it has, plus the EKS name, region, account and AWS profile it resolved;
- whether Prometheus, Alertmanager, Loki and Grafana were found and connected;
- whether the AWS credentials pass each permission probe.
scripts/kubegap nodes --context <name> then checks node access per node: SSM or SSH reachability, and which privileged reads are allowed.
Required permissions
kubegap never changes the cluster. It makes read calls only. Secret values are never read or recorded; only their names and types are. The one exception is Helm: Helm stores each release record in a Secret, so helm list reads those Secrets; kubegap keeps only the release name, status, versions and date from it and never collects the release values. ConfigMap values are not recorded either: the snapshot keeps each key's length and shape, and the real value only for the configuration keys kubegap parses, listed in KEEP_VALUES in lib/scrub.py (CoreDNS Corefile, kube-proxy config, local-path-provisioner paths, a few Argo CD flags). Component pod logs are aggregated into the summary and then deleted from the snapshot.
- Cluster:
deploy/permissions/clusterrole.yaml— get/list/watch on everything plusnodes/proxyandnodes/metrics, Secrets excluded. - AWS (EKS):
deploy/permissions/iam-policy.json— Describe/List/Get actions, CloudWatchGetMetricData, and SSMSendCommandlimited in two ways: only the documentkubegap-node-read(deploy/permissions/ssm-document.yaml), which embeds the read commands and takes no free command text, and only instances taggedkubernetes.io/cluster/<CLUSTER_NAME>=owned, the tag managed node groups and Karpenter already put on every node. Replace<ACCOUNT_ID>and<CLUSTER_NAME>in the policy before attaching it; the account id keeps a same-named document shared from another account from matching. A key with this policy can run those commands on that cluster's nodes and nothing else. - Every command that reaches a node, on any backend:
deploy/node-access/COMMANDS.md. It is generated from the collector definitions and a test keeps it current. - Nodes reached over SSH (k3s, bare metal):
deploy/node-access/README.md— one line to join the log-reading groups, optionally a sudoers file allowing read-only commands. Without it, only those node checks are skipped as "no node access". - Nodes with neither SSM nor SSH (GKE, AKS, kubeadm): apply
deploy/node-access/daemonset.yamland kubegap reads nodes throughkubectl execinto that pod. It runs privileged; you can delete it after the audit. The exec needs one more permission,getandcreateonpods/execin thekubegapnamespace:deploy/permissions/role-daemonset-exec.yaml, applied after the DaemonSet because that file creates the namespace. It opens a shell in that pod and writes nothing to the cluster.
What leaves your machine
kubegap itself sends nothing anywhere. Everything it collects is written to ~/.kubegap/snapshots/ on your machine. The agent that runs the skill then reads those files to write the report, and what it reads goes to that agent's model API: Anthropic's for Claude Code, OpenAI's for Codex. In practice that is the summary, the first-pass findings, and the raw files the agent opens to check a number: object specs, events and metrics. Secret values are never collected, so they cannot leave. ConfigMap values are not written to the snapshot, apart from the configuration keys listed in lib/scrub.py. Component pod logs are read by code, counted into the summary with masked sample lines, and deleted before the agent starts; set keep_component_logs: true in the config only if you accept that raw log lines may then be read by the agent. Still stored as collected, and so readable by the agent: node journals under logs/node/ (kubelet, containerd, k3s), CloudWatch control-plane log queries under logs/cloudwatch/, and Grafana dashboards. Tokens, account ids and private IPs are masked in the report, not in the snapshot. There is no mode that keeps the data local, because the report is written by the model. If that is not acceptable for a cluster, do not run kubegap against it.
Configuration (optional)
kubegap works without a config file. To pin a context, set an AWS profile, point at Prometheus/Grafana, give SSH addresses, or suppress checks and override thresholds, copy config.example.yaml to ~/.kubegap/config.yaml. Collected data and reports accumulate under ~/.kubegap/snapshots/<context>/<timestamp>/, and every run is diffed against the previous one.
How it works
Scripts collect and grade; the agent interprets and writes. The script side runs five steps, discover, collect, summarize, evaluate and diff, and gives the same result for the same input every time. The agent then reads that result and writes the report by following SKILL.md.
scripts/kubegap gathers data with kubectl, PromQL, the AWS CLI, HTTP APIs and node shells and condenses it into summary.json. It then grades every check in checks.yaml under each collectors/ folder as pass, warn or fail and writes the result to findings-draft.json. The agent reads that first pass, adjusts severity for symptoms, recurrence and cluster profile, and writes the report. A check is one YAML entry with its rule, why it matters, the fix, verification commands and test cases, and scripts/kubegap selftest runs every check's test cases.
Docs: SKILL.md is the agent procedure, references/development.md explains how to change checks and the rubric, CONTRIBUTING.md is the contribution guide, and docs/DESIGN-DECISIONS.md records the choices that shape the tool and why.
License
MIT. See LICENSE.
Reviews (0)
Sign in to leave a review.
Leave a reviewNo results found