nightmend
Health Warn
- License — License: Apache-2.0
- Description — Repository has a description
- Active repo — Last push 0 days ago
- Low visibility — Only 5 GitHub stars
Code Fail
- Hardcoded secret — Potential hardcoded credential in agent/agent.example.yaml
Permissions Pass
- Permissions — No dangerous permissions requested
This platform is an AI-driven monitoring system that connects to your infrastructure to analyze alerts, diagnose root causes, and execute automated remediation scripts (runbooks) to fix issues. It also allows AI coding assistants to query live production data via MCP.
Security Assessment
The overall risk is Medium. By design, this is a highly privileged tool. It ingests sensitive production metrics and logs, makes external network requests to DeepSeek AI APIs, and has the ability to execute shell commands and scripts for auto-remediation. The automated scan flagged a failed check for a potential hardcoded credential in an example configuration file (`agent.example.yaml`). While this is likely just a default placeholder for the demo environment, developers must ensure no real secrets are committed when configuring the tool. No inherently dangerous broad permissions were requested during installation, but the runtime capabilities involve deep system access.
Quality Assessment
The project is new but actively maintained, with repository updates as recent as today. It is properly licensed under Apache-2.0, making it safe for commercial and open-source use. However, community trust and visibility are currently very low. With only 5 GitHub stars, the tool has not yet undergone widespread public testing or community-driven security auditing.
Verdict
Use with caution — the core functionality is inherently invasive and the project lacks widespread community validation, so you should thoroughly review the runbook scripts and sandbox the environment before connecting it to critical infrastructure.
AI-powered open-source monitoring platform with auto-remediation. 6 built-in runbooks, MCP integration (global first), DeepSeek root cause analysis. 5-minute Docker setup.
NightMend
Your team gets 200+ alerts daily. 80% are noise. AI fixes them while you sleep.


Live Demo | Install | Docs | 中文文档

What Makes NightMend Different
You've tried Grafana + Prometheus. You know Datadog. They tell you something broke. None of them fix it.
NightMend is the first open-source AI platform that doesn't just monitor — it heals:
- AI Analyzes — DeepSeek reads logs, metrics, topology to find the real cause
- AI Decides — Picks the right Runbook from 13 built-in auto-remediation scripts
- AI Fixes — Executes the fix with safety checks and approval workflows
- AI Learns — Same problems get resolved faster next time
Global First: World's first open-source monitoring platform with MCP (Model Context Protocol) integration — your AI coding assistant can query live production data directly.
Quickstart
Try Online (no install): demo.lchuangnet.com — [email protected] / demo123
Self-Host in 3 Steps:
git clone https://github.com/LinChuang2008/nightmend.git && cd nightmend
cp .env.example .env                    # Optional: add DeepSeek API key for live AI
docker compose up -d                    # Open http://localhost:3001
First registered account becomes admin. On first startup, the backend auto-creates tables, alert rules, and dashboard components.
Feature Comparison
| Feature | NightMend | Nightingale | Prom+Grafana | Datadog | Zabbix |
|---|---|---|---|---|---|
| AI Root Cause Analysis | Built-in | - | - | Enterprise | - |
| Auto-Remediation | 13 Runbooks | - | - | Enterprise | - |
| MCP Integration | First | - | - | Early | - |
| PromQL Queries | ✓ | - | Native | Enterprise | - |
| Self-Hosted | Docker | K8s/Docker | Complex | SaaS | Yes |
| Cost | Free | Free/Ent | Free | $$$ | Free/Ent |
| Setup Time | 5 min | 30 min | 2+ hrs | 5 min | 1+ hr |
Sweet Spot: Small-to-medium teams who want AI-powered ops without enterprise licensing costs.
Honest disclaimer: We're early stage. For mission-critical systems at scale, use proven solutions. For teams ready to experiment with AI ops, we're your best bet.
How It Works
  Alert Fires        AI Diagnosis          Auto-Fix              Resolved
  ┌──────────┐     ┌──────────────┐     ┌────────────────┐    ┌────────────┐
  │ Disk 95% │────>│ "Log rotation│────>│ log_rotation   │───>│ Disk 60%   │
  │ on prod  │     │  needed on   │     │ runbook starts │    │ Fixed in   │
  │ server   │     │  /var/log"   │     │ safely         │    │ 2 minutes  │
  └──────────┘     └──────────────┘     └────────────────┘    └────────────┘
13 Built-in Runbooks: disk_cleanup | service_restart | memory_pressure | log_rotation | zombie_killer | connection_reset | cpu_high | docker_cleanup | network_diag | mysql_health | redis_health | nginx_fix | swap_pressure
AI Runbook Generator: Describe a scenario in natural language, and AI generates an executable Runbook with safety checks — via /api/v1/ai/generate-runbook.
Prometheus AlertManager Bridge
Already running Prometheus? Add 3 lines to alertmanager.yml and get AI diagnosis on every alert:
receivers:
  - name: 'nightmend'
    webhook_configs:
      - url: 'http://your-nightmend:8001/api/v1/webhooks/alertmanager'
        http_config:
          authorization:
            type: Bearer
            credentials: 'YOUR_TOKEN'
route:
  receiver: 'nightmend'
What happens: Prometheus fires alert → NightMend receives it → AI analyzes root cause → diagnosis appears in real-time on the Demo page via SSE.
Two modes: Diagnosis-only (safe, read-only analysis) or Auto-remediation (AI picks and executes the right Runbook).
Screenshots
Dashboard — Real-time metrics across all hosts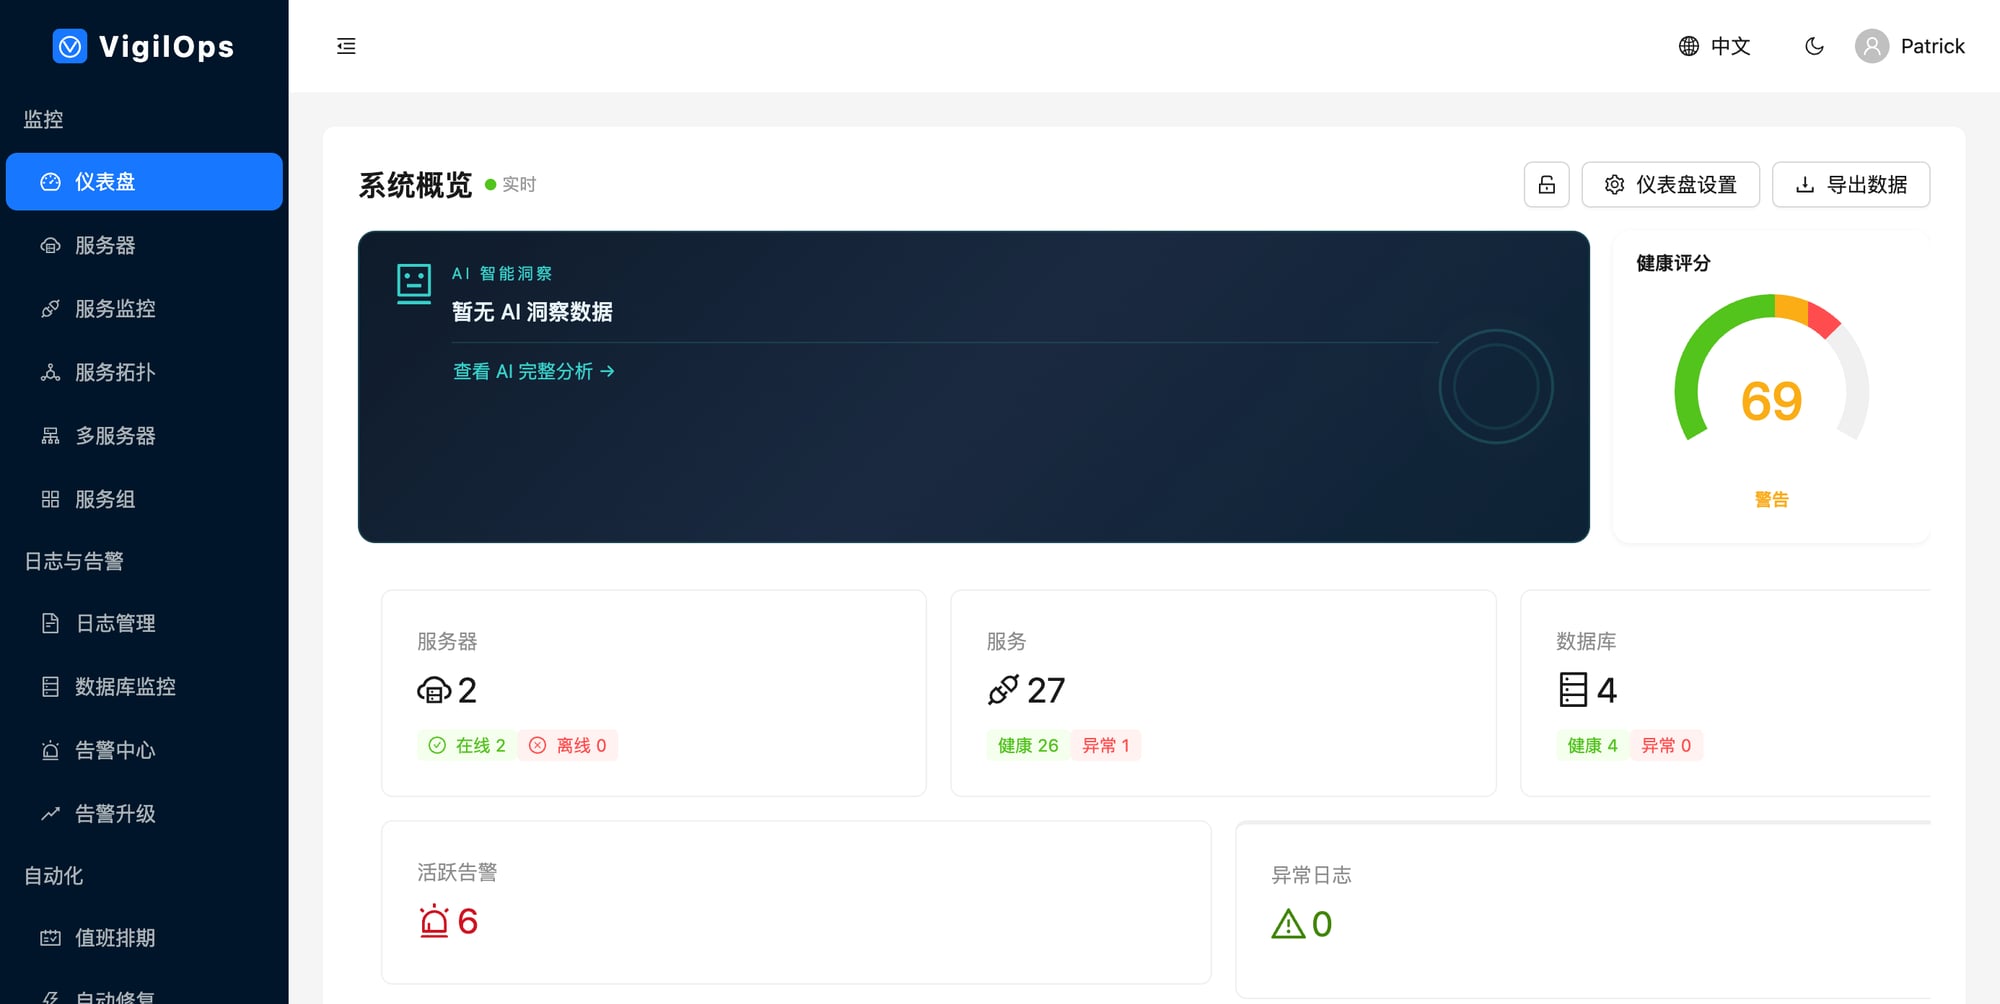
AI Alert Analysis — Root cause + recommended action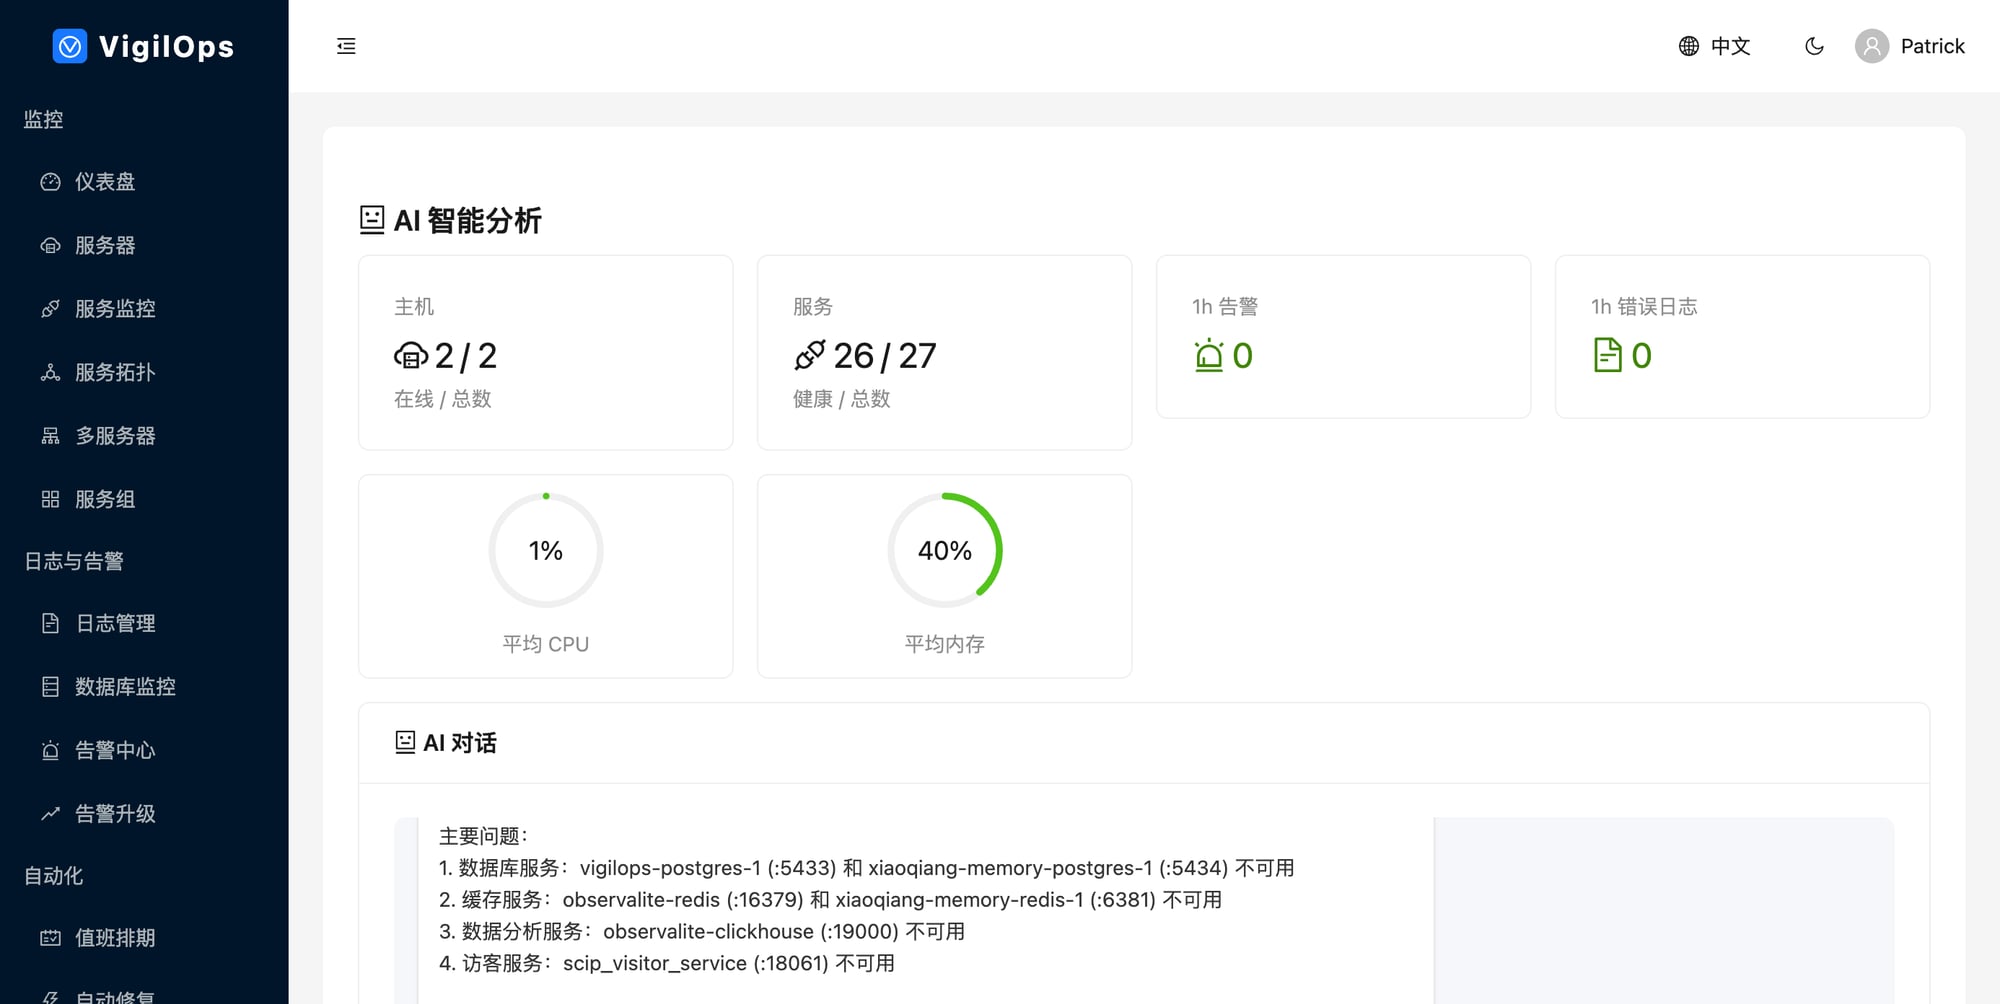
MCP Integration — Global Open Source First
Your AI assistant (Claude Code, Cursor) queries live production data via MCP:
# Enable in backend/.env
NIGHTMEND_MCP_ENABLED=true
NIGHTMEND_MCP_PORT=8003
NIGHTMEND_MCP_API_KEY=your-secret-token
Note: Authentication via
NIGHTMEND_MCP_API_KEYis required in production.
5 MCP Tools: get_servers_health | get_alerts | search_logs | analyze_incident | get_topology
Ask your AI: "Show all critical alerts on prod-server-01" / "Analyze last night's CPU spike" / "Search for OOM errors in the past 2 hours"
PromQL Query Support
Query metrics using familiar PromQL syntax via API:
# Instant query
GET /api/v1/promql/query?query=nightmend_host_cpu_percent

# Range query
GET /api/v1/promql/query_range?query=avg(nightmend_host_cpu_percent)&start=...&end=...&step=5m

# Supported: rate(), avg(), sum(), min(), max(), count(), avg_over_time(), label matchers
Compatible with Prometheus HTTP API format for Grafana integration.
Agent — Cross-Platform Monitoring
The NightMend Agent collects system metrics, discovers services, and monitors databases. It runs on Linux, Windows/Windows Server, and macOS.
Linux:
pip install nightmend-agent
nightmend-agent run -c /etc/nightmend/agent.yaml
Windows (PowerShell):
.\scripts\install-windows-agent.ps1 -ServerUrl "http://your-server:8001" -Token "your-token"
.\scripts\install-windows-service.ps1   # Register as Windows Service
| Feature | Linux | Windows | macOS |
|---|---|---|---|
| CPU / Memory / Disk / Network | ✓ | ✓ | ✓ |
| Docker Service Discovery | ✓ | ✓ | ✓ |
| Host Service Discovery | ✓ (ss) | ✓ (netstat) | - |
| Database Monitoring | ✓ | ✓ | ✓ |
| Log Collection | ✓ | ✓ | ✓ |
Installation
Prerequisites
- Docker 20+ & Docker Compose v2+
- 4 CPU / 8 GB RAM (build) / 2 GB RAM (runtime)
Environment Variables
| Variable | Required | Description |
|---|---|---|
POSTGRES_PASSWORD |
Yes | Database password |
JWT_SECRET_KEY |
Yes | openssl rand -hex 32 |
AI_API_KEY |
Yes | DeepSeek API key |
AI_AUTO_SCAN |
Rec. | Auto-analyze alerts (true) |
See docs/installation.md for full guide.
Tech Stack
| Layer | Technology |
|---|---|
| Frontend | React 19, TypeScript, Vite, Ant Design 6, ECharts 6 |
| Backend | Python 3.9+, FastAPI, SQLAlchemy, AsyncIO |
| Database | PostgreSQL 15+, Redis 7+ |
| AI | DeepSeek API (configurable LLM) |
| Agent | Python 3.9+, psutil — Linux / Windows / macOS |
| Deploy | Docker Compose, Helm Chart (K8s) |
Documentation
Getting Started | Installation | User Guide | API Reference | Architecture | Contributing | Changelog
Contributing
We need contributors who understand alert fatigue firsthand. See CONTRIBUTING.md.
cp .env.example .env
docker compose -f docker-compose.dev.yml up -d
pip install -r requirements-dev.txt
cd frontend && npm install
Community
Apache 2.0 — Use it, fork it, ship it commercially.
![]()
Reviews (0)
Sign in to leave a review.
Leave a reviewNo results found