token-watcher
Health Uyari
- License — License: MIT
- Description — Repository has a description
- Active repo — Last push 0 days ago
- Low visibility — Only 7 GitHub stars
Code Basarisiz
- network request — Outbound network request in cloud/smoke.mjs
- network request — Outbound network request in cloud/worker.js
- rm -rf — Recursive force deletion command in menubar/build.sh
Permissions Gecti
- Permissions — No dangerous permissions requested
Bu listing icin henuz AI raporu yok.
⏱ Token Watcher — local real-time token usage & quota dashboard for AI coding agents (Claude Code, ccmr, Codex, ZCode, dsh, WorkBuddy, Grok Build). 7 sources, zero-dep backend, live SSE panel, macOS menu bar. npx token-watcher serve
Token Watcher
Local, real-time token usage & quota dashboard for AI coding agents.
One resident process parses the session logs your AI coding tools already
leave on disk, normalizes them into a per-request event stream, and serves a
live dashboard: Codex-style stats, real-time quota cards, vendor balance
polling, cost estimation with reconciliation, and a macOS menu-bar capsule.
Local storage by default. The optional community leaderboard shares only
aggregate statistics after you explicitly opt in.



简体中文 · English
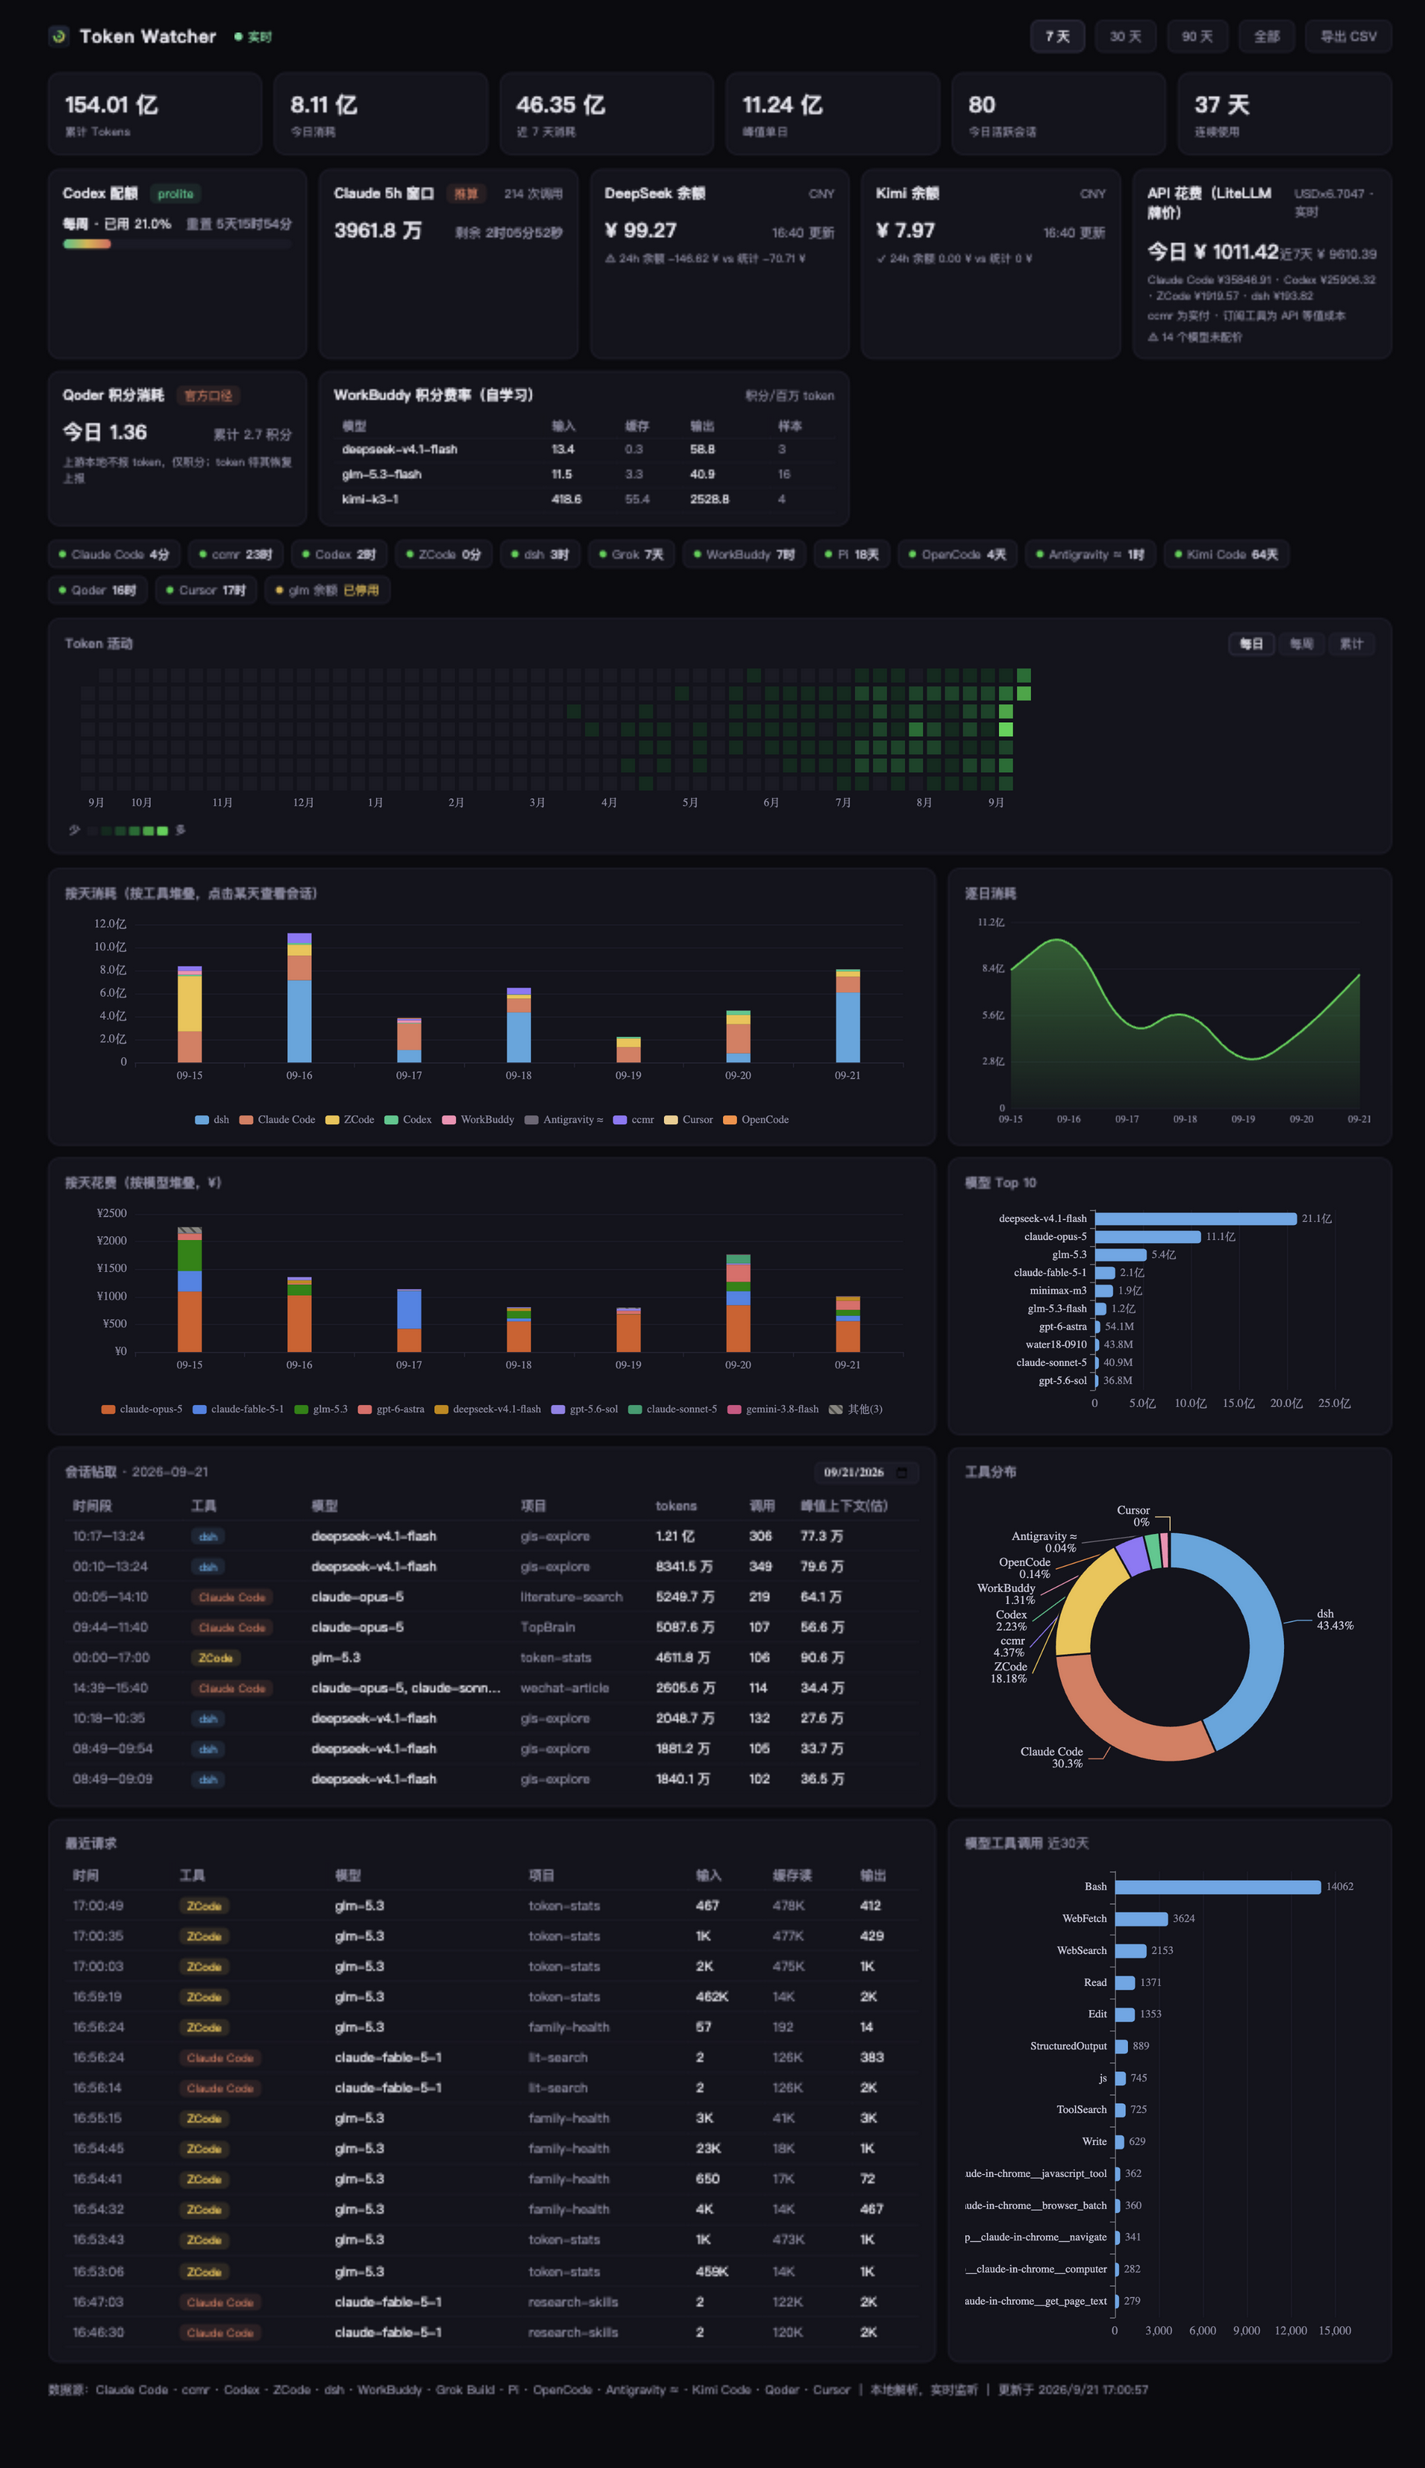
Screenshot is real running data (vendor balances and project names masked).
Why Token Watcher
Most token trackers recompute a report when you ask. Token Watcher watches
the logs as they're written: FSEvents → incremental parse → SSE push, the
dashboard updates in under a second while your agents work. Everything is
stored as per-request events, not pre-aggregated buckets — so you can
drill from a day, to a session, to a single request's token curve.
It also refuses to lie to you: estimated sources are labeled as such
(Antigravity ≈), models without pricing show up as unpriced instead of a
made-up cost, and vendor balances are reconciled against locally computed
spend so you can see when the estimate drifts.
| Token Watcher | TokenTracker | ccusage | Tokscale | |
|---|---|---|---|---|
| Interface | Local web dashboard + menu bar | Native apps + web | CLI reports | TUI / CLI |
| Refresh | Real-time (FSEvents + SSE, <1s) | Hook-triggered sync | Manual run | Manual run |
| Granularity | Per-request events | 30-min buckets | Daily | Daily |
| Sources | 13, incl. China stack (ccmr, dsh, Qoder, Kimi Code, WorkBuddy) | 39 | Multi-agent | Multi-agent |
| Cost | LiteLLM prices + balance reconciliation + credits ledger | LiteLLM estimate | Estimate | Estimate |
| Official quotas | Claude / Codex direct-read, Cursor billing CSV | 17 providers | Limited | Several |
| Telemetry | Optional, opt-in aggregate leaderboard | Opt-out | None | None |
| Install | One zero-dependency npm package (incl. universal menu-bar app) | npm + platform packages | npm | npm |
Supported tools (13 sources)
| Tool | Data location | What you get |
|---|---|---|
| Claude Code | ~/.claude/projects |
Per-request tokens, model mix |
| ccmr (claude-code-model-router) | ~/.claude-gateway/projects |
Same, with real model names behind the router |
| Codex | ~/.codex/sessions |
Per-request tokens, official quota % and resets (5h / weekly), models incl. auto-review, tool calls |
| ZCode | ~/.zcode/cli/db/db.sqlite |
Per-request details, tool calls, GLM Coding Plan credit windows (5h / weekly, official API) |
| dsh (DeepSeek Harness) | ~/.dsh/sessions |
Per-request details (multi-frame zstd snapshots) |
| WorkBuddy | ~/.WorkBuddy/projects |
Per-request details + self-learned credit rates |
| Grok Build | ~/.grok/sessions |
Per-turn usage (incl. vendor cost scale), tool calls |
| Pi | ~/.pi/agent/sessions |
Per-request details, tool calls |
| OpenCode | ~/.local/share/opencode/opencode.db |
Per-request details, tool calls |
| Antigravity ≈ | ~/.gemini/antigravity*/brain/**/transcript.jsonl |
Per planner turn — input from authoritative db context deltas, output estimated from content |
| Kimi Code | ~/.kimi-code/sessions/**/wire.jsonl |
Per-turn details (3 usage shapes auto-detected) |
| Qoder | ~/.qoder{,-cn}/projects/** |
Credits ledger (upstream reports credits, not tokens, locally) |
| Cursor | Account-level usage CSV | Per-request details — Cursor stores nothing per-request locally, so this polls the official export with local credentials |
Not supported: web chats (ChatGPT etc.) — token counts live server-side, nothing to parse.
Honest-caliber notes: Kimi Code, Qoder, Antigravity and Cursor were each
verified on real local data against an independent recomputation, row by row.
Qoder currently reports credits but zero tokens locally — credits go to a
dedicated ledger shown as a "credits spent" card, never fabricated into
tokens. Estimated sources are labeled (≈).
Quick start
npx --yes token-watcher@latest serve
# dashboard opens automatically → http://127.0.0.1:8787
Long-term:
npm install -g token-watcher
token-watcher serve
token-watcher install-agent             # launchd auto-start (macOS)
token-watcher bar                       # menu-bar capsule
token-watcher bar                       # macOS menu-bar capsule
Homebrew: brew install luwill/token-watcher/token-watcher
CLI reference
token-watcher today [--json|--light]            # today's usage (machine-readable / pure ASCII)
token-watcher sessions --day 2026-09-20 [--csv] [--git]   # per-session stats (+ git commit attribution)
token-watcher wrapped [--year 2026] [--json]    # year in review
token-watcher roi [--json]                     # subscription ROI (API-equivalent vs paid)
token-watcher leaderboard [on <name>|off|status|push|url <url>]
                                                # community leaderboard (opt-in, aggregate numbers only)
token-watcher doctor                            # environment + store + per-source health
token-watcher uninstall [--purge-data] [--yes]  # remove all local traces
token-watcher --version
Features
- Real-time: FSEvents on every source dir → incremental parse → SSE push (<1s)
- Incremental collection: byte cursors / sqlite watermarks / snapshot re-parse; dedup keys make rescans idempotent; collector versioning auto-backfills on logic upgrades
- Dashboard: metric cards, year-long GitHub-style heatmap (daily/weekly/cumulative), by-day/model/tool charts, live request feed
- Session drill-down: click any day → sessions (peak-context estimate) → per-request token curve
- Quotas: Codex official (direct-read), Claude official (local OAuth token → official usage endpoint; falls back to 5h window estimation)
- Subscription ROI: this month's API-equivalent cost vs what you actually pay (configure prices in
~/.tokenmeter/subscriptions.json;token-watcher roi) - Balances & costs: DeepSeek/Kimi balance polling; LiteLLM pricing with per-model CNY conversion; balance reconciliation; Qoder credits ledger
- Community leaderboard (opt-in, off by default): see how your daily/weekly/30-day totals stack up against other users — aggregate numbers only, never your raw events.
token-watcher leaderboard on <name> - Health self-check: parse errors turn red, "file being written but no new events" turns yellow — silent format drift gets caught
- Exports & backups: CSV, session/annual CLI reports, daily
VACUUM INTOsnapshots (7 kept)
Subscription ROI
Edit ~/.tokenmeter/subscriptions.json with what you actually pay (one entry
per tool, price_cny or price_usd):
{ "monthly": {
    "claude-code": { "name": "Claude Max", "price_usd": 200 },
    "kimi":        { "name": "Kimi plan",  "price_cny": 49 },
    "glm":         { "tool": "zcode", "models": "glm", "name": "GLM Coding Plan", "price_cny": null },
    "minimax":     { "tool": "zcode", "models": "minimax", "name": "MiniMax (via ZCode)", "price_cny": null } } }
Entry keys are identifiers; tool selects the data source (needed when one
tool carries multiple subscriptions, e.g. GLM and MiniMax both flowing through
ZCode), and models filters aggregation by model prefix. Entries with the
price unset still show their API-equivalent, labeled "price not set".
The dashboard and token-watcher roi then compare this month's API-equivalent
cost (same pricing chain as the cost card, including peak/off-peak) against
your real spend. Clearly labeled as a hypothetical caliber: subscriptions come
with rate limits and API prices may be discounted. Credits-based tools (Qoder)
show this month's credits spent instead of a made-up ratio.
Community leaderboard (opt-in)
Off by default. Join explicitly with a nickname:
token-watcher leaderboard on <nickname>   # join (1-16 chars, no links/@)
token-watcher leaderboard status          # participation + last report state
token-watcher leaderboard push            # report once right now
token-watcher leaderboard off             # stop reporting; daily cleanup after 30d inactivity
token-watcher leaderboard url <https://…> # point at a self-hosted instance
What gets reported — aggregate numbers only, once per hour:
| Reported | Never leaves your machine |
|---|---|
| Nickname, a random local UUID (regeneratable) | File paths, project names |
| UTC today's / rolling-7-day / rolling-30-day token totals, request count | Per-request rows, timestamps |
| Dominant model per period (day / 7 / 30 days); legacy weekly model/tool shares (top 5) | API keys, machine identifiers |
| Subscription ROI as a ratio (×N, no amounts) | Session content, anything else |
The panel can read the public leaderboard even before joining; only opted-in
clients upload usage aggregates. Viewing the panel makes a public GET request
without your random UUID when participation is disabled. doctor shows
the participation state either way. The reference backend is a
Cloudflare Worker + D1 (free tier) in cloud/ — anyone can
self-host one and point the CLI at it. Server-side defenses: name sanitizing,
all-field clamping, 16 KiB request limits, edge rate limiting, 60s per-ID throttling,
and daily cleanup of entries inactive for over 30 days (normally removed within 31 days).
The daily board uses UTC; the rolling-7-day and rolling-30-day boards require a report within 24 hours. Older clients without a 30-day total remain on the day/week boards until upgraded.
The dominant model follows the selected period: UTC today, rolling 7 days, or
rolling 30 days. It is the model with the largest total_tokens sum in that window;
its percentage is rounded against all tokens in the same window. Only the
winner is displayed; ties use model ID order. Events without a model remain in the
denominator but cannot be a dominant model. Model versions remain distinct.
Older reports containing only weekly models show a pending-update message on the
daily/30-day boards instead of reusing weekly data. Tool shares remain weekly.
ROI is a local-calendar-month hypothetical API-equivalent/monthly-fee ratio.
All figures are self-reported and unverified; this is not a competition or audited usage record.
The application database does not store IP addresses; Cloudflare processes network
metadata and uses source IPs for edge rate limiting.
Privacy
Fully local. The dashboard binds to 127.0.0.1 only (with Host validation).
API keys and tokens are used inside the server process only, never stored or
sent to the frontend. Usage data never leaves your machine — with one explicit
exception: the opt-in community leaderboard above, which sends only the
aggregate numbers listed there, only after you run leaderboard on.
Outbound requests (only these; none carry your usage data unless noted): FX
rate (12h), LiteLLM price table (24h), vendor balances (30min, with your key),
Claude official quota (10min, with Claude Code's local OAuth token), Cursor
usage CSV (30min, with a cookie built from local credentials), GLM Coding
Plan credit quota (10min, with ZCode's own local API key; MCP tool quota is
read from local logs only), leaderboard aggregate report (hourly, opt-in
only), and public leaderboard reads when viewing the dashboard.
Set TOKENMETER_OFFLINE=1 to skip all of them.
Requirements
Node ≥ 22.13 (node:sqlite). macOS fully supported (menu bar + launchd);
core pipeline CI-tested on macOS/Ubuntu/Windows. dsh source needs systemzstd. Non-official tool: parses private local formats that upstreams may
change — the health panel will flag it instead of failing silently.
Architecture
See docs/ARCHITECTURE.md (Chinese, with per-source
format notes and verification methodology). Core: one collector per source
under src/collectors/* (incremental + dedup + version), src/scanner.js
schedules, SQLite event store, HTTP API + SSE in src/server.js, zero-build
frontend in web/. Adding a source = one collector + registry entry + a
color. See CONTRIBUTING.md.
License
Yorumlar (0)
Yorum birakmak icin giris yap.
Yorum birakSonuc bulunamadi