Graph-It-Live
Health Pass
- License — License: MIT
- Description — Repository has a description
- Active repo — Last push 0 days ago
- Community trust — 26 GitHub stars
Code Warn
- process.env — Environment variable access in esbuild.js
- fs module — File system access in esbuild.js
- process.env — Environment variable access in scripts/run-benchmarks.mjs
- process.env — Environment variable access in scripts/test-mcp.js
Permissions Pass
- Permissions — No dangerous permissions requested
No AI report is available for this listing yet.
Graph-It-Live VS Code Extension
Graph-It-Live
The AI-first dependency intelligence platform for VS Code.
See your codebase the way your AI does — as a graph.


Graph-It-Live turns your codebase into a live, interactive dependency graph — one that both you and your AI assistant can query in real time.
Built for architects who need the big picture and developers who need to ship safely, it combines three analysis layers in one tool:
| Layer | What you see | Powered by |
|---|---|---|
| File Graph | File-to-file import relationships | Regex + AST parsing |
| Symbol View | Function/class call hierarchy inside a file | AST (ts-morph) |
| Live Call Graph | Cross-file symbol call relationships | Tree-sitter + SQLite |
All three layers are also exposed to AI via a 20-tool MCP server, so your assistant can answer architecture questions with zero hallucination.
Why Graph-It-Live?
| Pain point | Without Graph-It-Live | With Graph-It-Live |
|---|---|---|
| "What breaks if I touch this file?" | Grep + hope | One-click reverse dependency lookup |
| "Explain this module's architecture" | Read 30 files | AI generates a codemap in seconds |
| "Are there circular deps?" | Manual tracing | Auto-detected, red-highlighted cycles |
| "What calls this function across the project?" | Global search + noise | Live Call Graph with depth control |
| "Onboard a new developer" | Hours of walkthroughs | Interactive graph + AI-generated overviews |
Table of Contents
🤖 Supercharge Your AI Assistant
Stop pasting file paths and explaining your project structure. Graph-It-Live exposes 21 powerful dependency analysis tools directly to your AI assistant via the Model Context Protocol (MCP), and 20 native LM Tools directly in Copilot Agent mode (no MCP setup required).
Works with: GitHub Copilot, Claude (Desktop & Code), Cursor, Windsurf, Antigravity, and any MCP-compatible client.
What your AI can do with Graph-It-Live
| You ask | AI uses | Result |
|---|---|---|
| "Map out the architecture of the auth module" | crawl_dependency_graph |
Full dependency tree as structured data |
| "What breaks if I change User.ts?" | find_referencing_files |
All dependent files with O(1) lookup |
| "Give me an overview of Spider.ts" | generate_codemap |
Exports, internals, deps, dependents, call flow — in one call |
| "What calls formatDate() across the project?" | get_symbol_callers |
All callers with instant lookup |
| "Show function-level flow in this file" | analyze_file_logic |
Intra-file call hierarchy |
| "Analyze the impact of changing calculateTotal's signature" | get_impact_analysis |
Breaking change detection + all affected callers |
| "Find unused exports in the codebase" | find_unused_symbols |
Dead code detection |
| "Are there circular dependencies?" | crawl_dependency_graph |
Cycle detection built in |
GitHub Copilot querying Graph-It-Live to analyze a project's dependency structure
🗺️ Codemap Generation (New)
The graphitlive_generate_codemap tool gives your AI a complete structural overview of any file in a single call — no more chaining 5 different tools.
What it returns:
┌─────────────────────────────────────────────────┐
│  Spider.ts  (247 lines, TypeScript)             │
├─────────────────────────────────────────────────┤
│  EXPORTS: Spider, SpiderOptions                 │
│  INTERNALS: crawlFile, resolveImport, visitNode │
│  DEPENDENCIES: Parser.ts, PathResolver.ts, ...  │
│  DEPENDENTS: SpiderBuilder.ts, extension.ts     │
│  CALL FLOW: crawl → crawlFile → resolveImport  │
│  CYCLES: none                                   │
└─────────────────────────────────────────────────┘
Use cases:
- Onboarding: "Give me an overview of every file in src/analyzer/" — AI maps the full module
- Pre-refactor audit: "Generate codemaps for all files that import UserService" — understand coupling before changing
- Documentation: "Create architecture docs from codemaps" — structured data → Markdown in seconds
- Code review: "What does this new file export and who depends on it?" — instant context
Token-efficient: Output uses a compact format optimised for LLM consumption. Combine with
format: "toon"for up to 60% token savings.
📊 File Logic Analysis (New)
The graphitlive_analyze_file_logic tool reveals the call hierarchy inside a single file — which functions call which, in what order.
Example prompt: "Show me how data flows through src/mcp/mcpServer.ts"
AI response (powered by the tool):
Entry points: initializeServer(), main()
  └── initializeServer()
      ├── registerAllTools()      [call #1]
      ├── setupFileWatcher()      [call #2]
      └── startListening()        [call #3]
          └── handleToolCall()
              ├── validateWorkspace()
              └── invokeWorker()
Use cases:
- Understand complex files without reading every line
- Find entry points and trace execution paths
- Detect internal cycles (recursive calls between functions)
- Refactoring confidence — see what internal logic is affected
👁️ Features for Humans
File Dependency Graph
The core of Graph-It-Live: a real-time interactive graph showing file-to-file import relationships across your project.
- Multi-language: TypeScript, JavaScript, Python, Rust, Vue, Svelte, GraphQL
- Cycle detection: Circular dependencies highlighted with red dashed lines and badges
- Smart navigation: Click any node to open the file; expand/collapse dependencies dynamically
- Reverse lookup: Right-click → "Find Referencing Files" for instant reverse dependency discovery
- Background indexing: Workspace indexed in a background thread for O(1) queries
Interactive file dependency graph with expand/collapse and cycle detection
Symbol-Level Drill-Down
Go beyond file dependencies — drill into any file to visualize function-to-function and class-to-class call relationships powered by AST analysis (ts-morph for TypeScript/JavaScript, tree-sitter for Python/Rust).
How it works:
- From the File Graph: Double-click any file node (or right-click → "Drill Down")
- Instant symbol graph: See an interactive tree showing:
- Functions in vibrant blue
- Classes in deep purple
- Variables/Constants in amber
- → calls — outgoing calls from each symbol
- ← called by — incoming callers (including from other files)
- Recursive calls with cycle badges
- Click-to-navigate: Click any symbol to jump to its definition
- Breadcrumb nav:
Project > folder > file.ts— one click to return to file view
Multi-language support:
- TypeScript / JavaScript (ts-morph AST)
- Python (tree-sitter WASM)
- Rust (tree-sitter WASM)
Benefits:
- Understand code flow without reading every line
- See who calls your exports — incoming dependencies from other files
- Detect recursive calls — cycle detection with visual indicators
- Refactoring confidence — visualize all internal dependencies
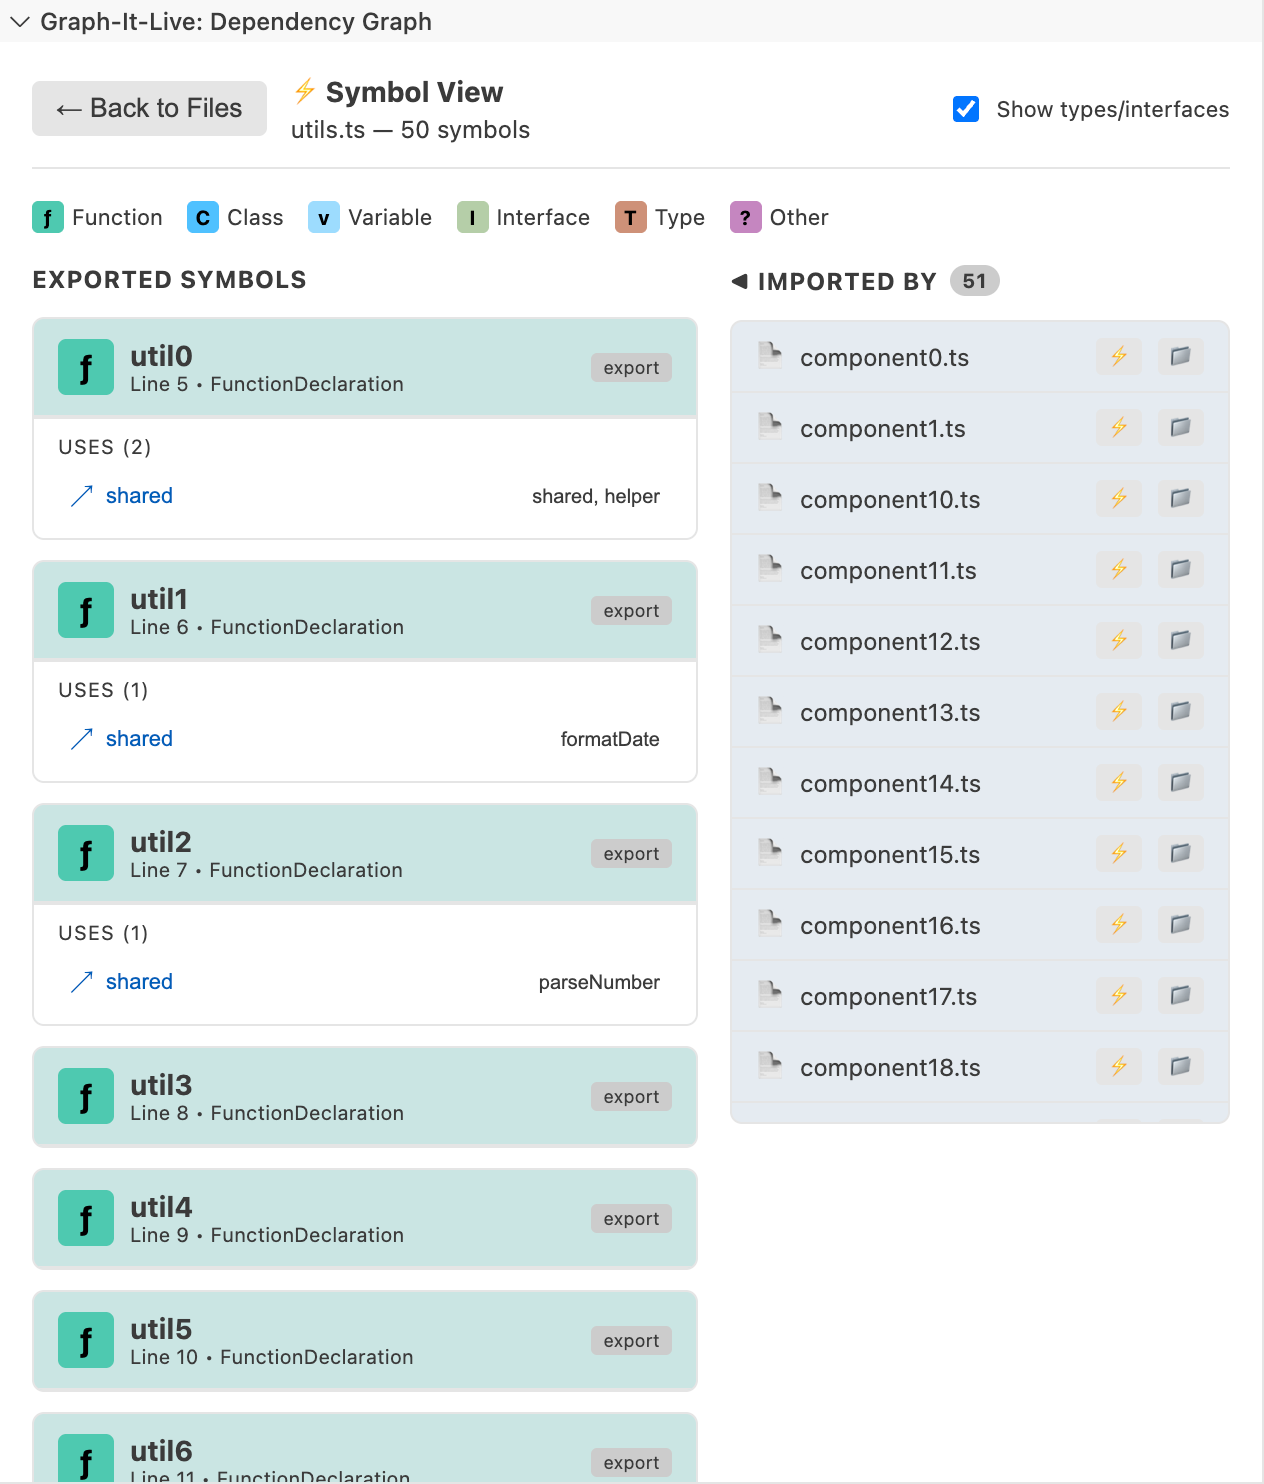
Symbol drill-down: purple classes, blue functions, amber variables with call relationships
🔷 Live Call Graph (New)
The Live Call Graph visualises cross-file symbol call relationships across your entire project in a Cytoscape.js panel backed by an in-memory SQLite database.
Unlike the Symbol View (which shows relationships within a single file via AST), the Call Graph shows how symbols call each other across files using Tree-sitter AST extraction.
Key capabilities:
| Feature | Description |
|---|---|
| Cross-file analysis | See function calls that span multiple files |
| Neighbourhood queries | BFS expansion from any symbol, configurable depth (1–5) |
| Cycle detection | Mutual-recursion and self-recursion highlighted in red |
| Compound node layout | Symbols grouped by folder for visual clarity |
| Call order numbering | CALLS edges numbered to show invocation order |
| Theme-aware | Adapts to dark, light, and high-contrast VS Code themes |
| Live refresh | On file save, the graph updates automatically (500ms debounce) |
| Filter legend | Toggle visibility by symbol type (function, class, variable) and by folder |
How to use:
- Open a source file and place the cursor on a symbol (function, class, method…). Then open the command palette →
Graph-It-Live: Show Call Graphor click the "Call Graph" button in the sidebar toolbar - The extension indexes your workspace (Tree-sitter AST extraction)
- Click any symbol to re-center the neighbourhood
- Drag any node (symbol or entire file/folder group) to rearrange the layout freely
- Use the depth slider to expand or narrow the view
- Filter by symbol type or folder using the legend overlay
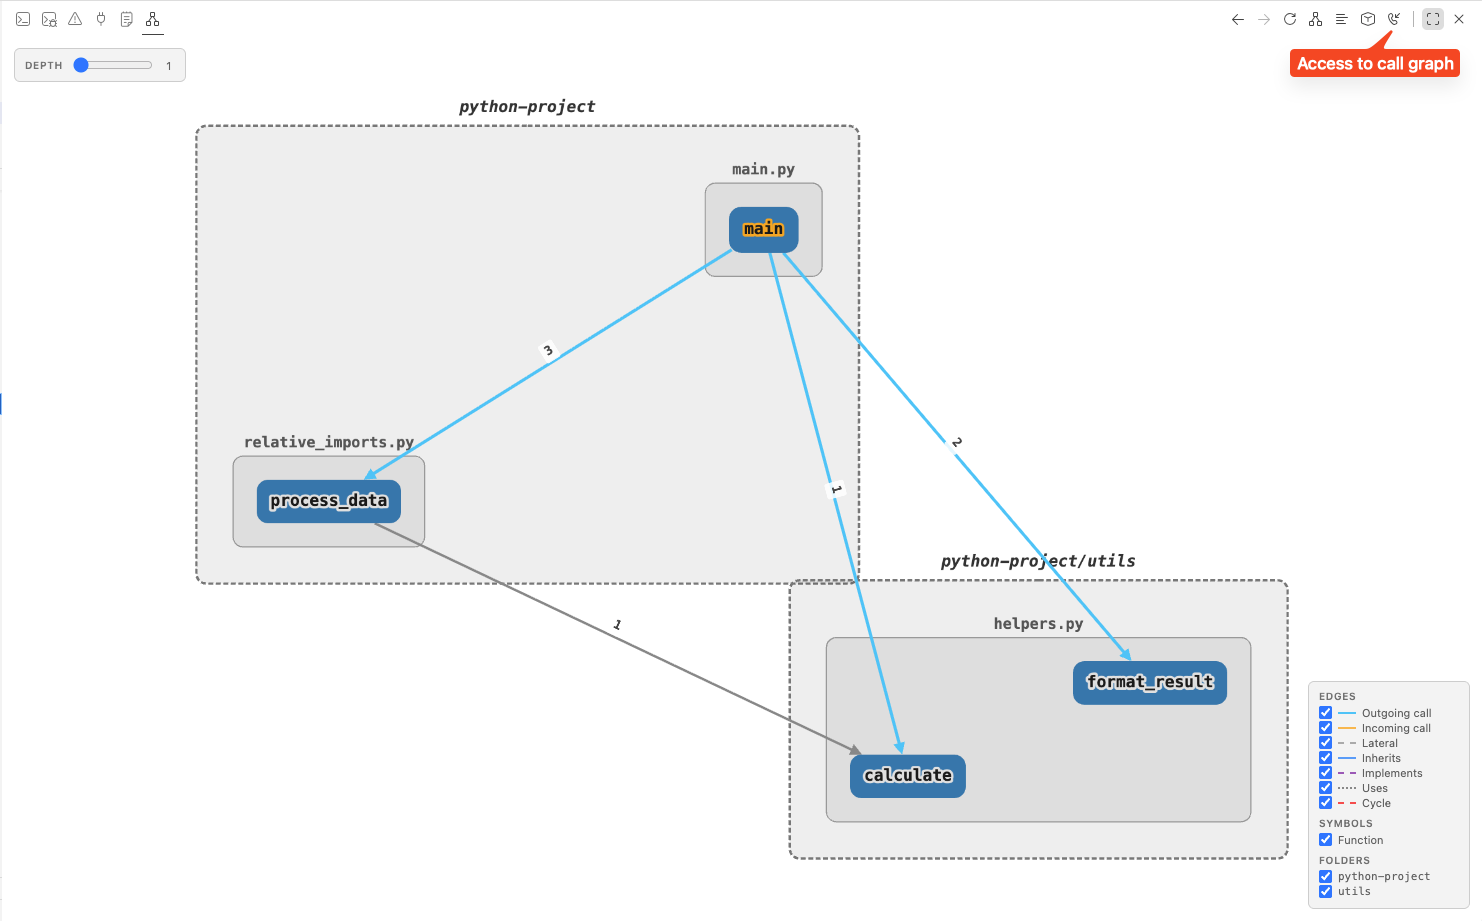
Live Call Graph — cross-file symbol relationships with cycle detection and folder grouping
Unused Dependency Filter
Smart filter to show only dependencies that are actually used in your code. Toggle between showing all imports or filtering unused ones with a single click.
- Hide mode: Unused dependencies completely removed from the graph
- Dim mode: Unused dependencies shown with reduced opacity and dashed lines
Hide mode: Unused dependencies completely removed
Dim mode: Unused dependencies shown with reduced opacity
Prerequisites
- Node.js: v20 or higher
- VS Code: v1.96.0 or higher
No build tools required — the extension uses WebAssembly (WASM) parsers. No Python, C++ compiler, or native compilation needed.
Installation
From Marketplace
Search for "Graph-It-Live" in the Extensions view (Ctrl+Shift+X / Cmd+Shift+X), or install from the VS Code Marketplace.
From Open VSX Registry
Also available on the Open VSX Registry for VSCodium and other compatible editors.
Usage
- Open a Project — TypeScript, JavaScript, Python, Rust, Vue, Svelte, or GraphQL
- Open the Graph — Click the Graph-It-Live icon in the Activity Bar, or run
Graph-It-Live: Show Dependency Graph - Interact:
- Click a node → open the file
- Double-click a node → drill down to symbol view
- Right-click a node → expand, collapse, find referencing files
- Command palette →
Show Call Graphfor cross-file symbol analysis
Configuration
Performance Profiles
Choose a performance profile based on your machine:
| Profile | RAM | Concurrency | Max Edges | Cache |
|---|---|---|---|---|
default (recommended) |
4-8 GB | 4 | 2000 | 500/200 |
low-memory |
< 4 GB | 2 | 1000 | 200/100 |
high-performance |
16 GB+ | 12 | 5000 | 1500/800 |
custom |
Any | Manual | Manual | Manual |
Set via graph-it-live.performanceProfile in VS Code settings.
With custom profile, you can fine-tune:
unusedAnalysisConcurrency(1-16)unusedAnalysisMaxEdges(0 = unlimited)maxCacheSize(50-2000)maxSymbolCacheSize(50-1000)indexingConcurrency(1-16)
All Settings
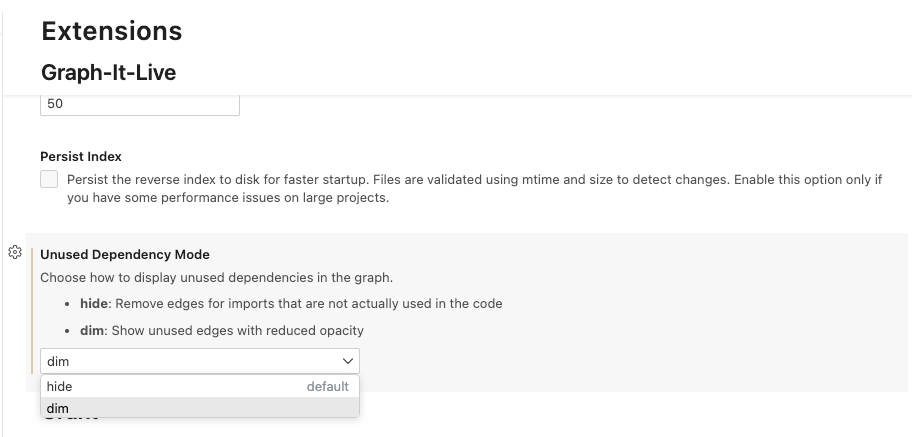
Configure how unused dependencies are displayed: hide (remove completely) or dim (show with reduced opacity)
| Setting | Default | Description |
|---|---|---|
graph-it-live.performanceProfile |
default |
Performance preset: default, low-memory, high-performance, or custom for manual control. |
graph-it-live.enableMcpServer |
false |
Enable the MCP server for AI/LLM integration. |
graph-it-live.enableMcpDebugLogging |
false |
Privacy-sensitive debug logging for MCP (creates ~/mcp-debug.log). Enable only for troubleshooting. |
graph-it-live.maxDepth |
50 |
Maximum dependency depth to analyze. |
graph-it-live.excludeNodeModules |
true |
Exclude node_modules imports from the graph. |
graph-it-live.enableBackgroundIndexing |
true |
Enable background indexing for O(1) reverse dependency lookups. |
graph-it-live.persistIndex |
false |
Persist reverse index to disk for faster startup. |
graph-it-live.indexingConcurrency |
4 |
Parallel file processing during indexing (1-16). |
graph-it-live.indexingStartDelay |
1000 |
Delay (ms) before starting background indexing after activation. |
graph-it-live.logLevel |
info |
Logging verbosity: debug, info, warn, error, or none. |
graph-it-live.unusedDependencyMode |
hide |
How to display unused dependencies: hide or dim. |
graph-it-live.unusedAnalysisConcurrency |
4 |
Parallel file analysis for unused detection (1-16). |
graph-it-live.unusedAnalysisMaxEdges |
2000 |
Skip auto unused analysis above this edge count (0 = no limit). |
graph-it-live.persistUnusedAnalysisCache |
false |
Cache unused analysis results to disk. |
graph-it-live.maxUnusedAnalysisCacheSize |
200 |
Max cached unused analysis results (LRU eviction). |
graph-it-live.maxCacheSize |
500 |
Max cached file dependency analyses. |
graph-it-live.maxSymbolCacheSize |
200 |
Max cached symbol analysis results. |
graph-it-live.preIndexCallGraph |
true |
Pre-index the call graph database at startup for near-instant first query. |
graph-it-live.symbolViewLayout |
hierarchical |
Layout for symbol drill-down: hierarchical, force-directed, or radial. |
MCP Server (AI/LLM Integration)
Graph-It-Live includes an optional MCP server that exposes its full analysis engine to AI assistants and LLMs.
Setup
- Set
graph-it-live.enableMcpServertotruein VS Code settings - The server starts automatically when the extension activates
- Your AI assistant detects the tools via MCP auto-discovery
Available Tools
The MCP server exposes 21 tools for AI/LLM consumption. All tools except set_workspace are also available as native LM Tools (#graphResolve, #graphBreaking, #graphCallGraph, etc.) directly in Copilot Agent mode — no MCP server required for those.
| Tool | Description |
|---|---|
graphitlive_set_workspace |
Set the project directory to analyze |
graphitlive_analyze_dependencies |
Analyze a single file's direct imports and exports |
graphitlive_crawl_dependency_graph |
Crawl the full dependency tree from an entry file |
graphitlive_find_referencing_files |
Find all files that import a given file (reverse lookup) |
graphitlive_expand_node |
Expand a node to discover dependencies beyond known paths |
graphitlive_parse_imports |
Parse raw import statements without path resolution |
graphitlive_verify_dependency_usage |
Verify whether a specific dependency is actually used in a file |
graphitlive_resolve_module_path |
Resolve a module specifier to an absolute file path |
graphitlive_get_symbol_graph |
Get symbol-level dependencies (functions, classes) within a file |
graphitlive_find_unused_symbols |
Find potentially unused exported symbols (dead code detection) |
graphitlive_get_symbol_dependents |
Find all symbols that depend on a specific symbol |
graphitlive_trace_function_execution |
Trace the complete execution path through function calls |
graphitlive_get_symbol_callers |
Find all callers of a symbol with O(1) instant lookup |
graphitlive_analyze_breaking_changes |
Detect breaking changes when modifying function signatures |
graphitlive_get_impact_analysis |
Full impact analysis combining callers and breaking changes |
graphitlive_get_index_status |
Get the current state of the dependency index |
graphitlive_invalidate_files |
Invalidate specific files from the cache after modifications |
graphitlive_rebuild_index |
Rebuild the entire dependency index from scratch |
graphitlive_analyze_file_logic |
Analyze symbol-level call hierarchy and code flow within a file |
graphitlive_generate_codemap |
Generate a comprehensive structured overview of any source file |
graphitlive_query_call_graph |
Query cross-file callers/callees via BFS on the call graph SQLite database |
TOON Format (Token-Optimized Output)
All tools support an optional format parameter to reduce token consumption:
{
  "tool": "graphitlive_crawl_dependency_graph",
  "params": {
    "entryFile": "/path/to/main.ts",
    "format": "toon"
  }
}
| Format | Description | Token Savings |
|---|---|---|
json (default) |
Standard JSON output | — |
toon |
Compact Token-Oriented Object Notation | 30-60% |
markdown |
JSON wrapped in markdown code blocks | — |
See TOON Format Documentation for full specifications.
Native LM Tools (Copilot Agent Mode)
All 20 analysis tools are also available natively in GitHub Copilot — no MCP server required. Reference them with # in Agent mode:
| Reference | Tool | Description |
|---|---|---|
#graphFindRefs |
find_referencing_files |
All files that import a given file |
#graphDeps |
analyze_dependencies |
Direct imports and exports of a file |
#graphCrawl |
crawl_dependency_graph |
Full dependency tree from an entry file |
#graphSymbols |
get_symbol_graph |
Symbol-level dependencies within a file |
#graphUnused |
find_unused_symbols |
Dead code detection |
#graphCallers |
get_symbol_callers |
All callers of a symbol |
#graphImpact |
get_impact_analysis |
Full impact analysis |
#graphIndexStatus |
get_index_status |
Current state of the dependency index |
#graphImports |
parse_imports |
Raw import statements |
#graphCodemap |
generate_codemap |
Comprehensive file structural overview |
#graphExpand |
expand_node |
Incremental dependency exploration |
#graphVerifyUsage |
verify_dependency_usage |
Is an import actually used? |
#graphInvalidate |
invalidate_files |
Flush cache for specific files |
#graphRebuildIndex |
rebuild_index |
Full index rebuild |
#graphDependents |
get_symbol_dependents |
All symbols depending on a given symbol |
#graphTrace |
trace_function_execution |
Full recursive call chain |
#graphFileLogic |
analyze_file_logic |
Intra-file call hierarchy |
#graphResolve |
resolve_module_path |
Resolve a module specifier to its absolute path |
#graphBreaking |
analyze_breaking_changes |
Detect breaking changes between two file versions |
#graphCallGraph |
query_call_graph |
BFS callers/callees via the SQLite call graph index |
Note:
#graphCallGraphrequires the Call Graph panel (graph-it-live.showCallGraph) to be opened at least once to build the index.
Manual MCP Server Configuration
If automatic MCP registration doesn't work in your editor, you can configure the server manually.
Click to expand configuration instructions for VS Code, Cursor, Claude Desktop, Windsurf, etc.VS Code / VS Code Insiders
Create or edit .vscode/mcp.json in your workspace:
{
  "servers": {
    "graph-it-live": {
      "type": "stdio",
      "command": "node",
      "args": ["${extensionPath:magic5644.graph-it-live}/dist/mcpServer.mjs"],
      "env": {
        "WORKSPACE_ROOT": "${workspaceFolder}",
        "EXCLUDE_NODE_MODULES": "true",
        "MAX_DEPTH": "50"
      }
    }
  }
}
Cursor
Create or edit .cursor/mcp.json in your workspace or ~/.cursor/mcp.json for global configuration:
{
  "mcpServers": {
    "graph-it-live": {
      "command": "bash",
      "args": [
        "-c",
        "node ~/.cursor/extensions/magic5644.graph-it-live-*/dist/mcpServer.mjs"
      ],
      "env": {
        "WORKSPACE_ROOT": "${workspaceFolder}",
        "EXCLUDE_NODE_MODULES": "true",
        "MAX_DEPTH": "50"
      }
    }
  }
}
Claude Desktop
Add to ~/Library/Application Support/Claude/claude_desktop_config.json (macOS):
{
  "mcpServers": {
    "graph-it-live": {
      "command": "bash",
      "args": [
        "-c",
        "node ~/.vscode/extensions/magic5644.graph-it-live-*/dist/mcpServer.mjs"
      ],
      "env": {
        "WORKSPACE_ROOT": "/path/to/your/project",
        "EXCLUDE_NODE_MODULES": "true",
        "MAX_DEPTH": "50"
      }
    }
  }
}
Development / Local Testing
{
  "mcpServers": {
    "graph-it-live": {
      "command": "node",
      "args": ["/path/to/Graph-It-Live/dist/mcpServer.mjs"],
      "env": {
        "WORKSPACE_ROOT": "/absolute/path/to/your/project",
        "TSCONFIG_PATH": "/absolute/path/to/your/project/tsconfig.json",
        "EXCLUDE_NODE_MODULES": "true",
        "MAX_DEPTH": "50"
      }
    }
  }
}
Windsurf
Create or edit ~/.codeium/windsurf/mcp_config.json:
{
  "mcpServers": {
    "graph-it-live": {
      "command": "bash",
      "args": [
        "-c",
        "node ~/.windsurf/extensions/magic5644.graph-it-live-*/dist/mcpServer.mjs"
      ],
      "env": {
        "WORKSPACE_ROOT": "${workspaceFolder}",
        "EXCLUDE_NODE_MODULES": "true",
        "MAX_DEPTH": "50"
      }
    }
  }
}
Antigravity
Create or edit .antigravity/mcp.json in your workspace or configure globally:
{
  "mcpServers": {
    "graph-it-live": {
      "command": "bash",
      "args": [
        "-c",
        "node ~/.vscode/extensions/magic5644.graph-it-live-*/dist/mcpServer.mjs"
      ],
      "env": {
        "WORKSPACE_ROOT": "${workspaceFolder}",
        "EXCLUDE_NODE_MODULES": "true",
        "MAX_DEPTH": "50"
      }
    }
  }
}
Development
For comprehensive development instructions, see:
- DEVELOPMENT.md — Setup, build, testing, WASM architecture
- CONTRIBUTING.md — Contribution guidelines and workflow
Quick Start
git clone https://github.com/magic5644/Graph-It-Live.git
cd Graph-It-Live
npm install
npm run build
# Press F5 in VS Code to launch the Extension Development Host
Project Structure
Graph-It-Live/
├── src/
│   ├── analyzer/              # Dependency analysis (AST, Tree-sitter, SQLite)
│   │   └── callgraph/         # Live Call Graph engine
│   ├── extension/             # VS Code extension host
│   │   └── services/          # Service layer (graph, symbol, call graph, indexing)
│   ├── mcp/                   # MCP server (20 AI tools)
│   ├── shared/                # Types, protocols, utilities
│   └── webview/               # React UI (ReactFlow + Cytoscape.js)
│       ├── callgraph/         # Call graph panel entry point
│       └── components/
│           ├── reactflow/     # File graph + symbol view
│           └── cytoscape/     # Live call graph rendering
├── tests/                     # 1494+ tests (Vitest + VS Code E2E)
├── resources/queries/         # Tree-sitter .scm queries (TS, Python, Rust)
└── docs/                      # Technical documentation
Build & Test Commands
| Command | Description |
|---|---|
npm run build |
Bundle via esbuild + copy WASM files |
npm run watch |
Rebuild on change |
npm test |
Run unit tests (Vitest, mocked parsers) |
npm run test:vscode |
E2E tests from source with real WASM |
npm run test:vscode:vsix |
E2E tests from .vsix (pre-release) |
npm run lint |
Lint TypeScript (ESLint) |
npm run check:types |
Strict type checking |
npm run package |
Build .vsix package |
npm run package:verify |
Verify no .map files in package |
WASM Architecture
Graph-It-Live uses WebAssembly tree-sitter parsers for cross-platform compatibility and security:
- No native compilation needed — no Python, C++ compiler, or build tools
- Pure JavaScript + WASM (~2-3 MB total)
- Works identically on Windows, Linux, and macOS
- Parsers:
tree-sitter.wasm,tree-sitter-python.wasm,tree-sitter-rust.wasm
Architecture
VS Code Extension Host (Electron)
├── WasmParserFactory (Singleton)
│   ├── tree-sitter.wasm (Core runtime)
│   ├── tree-sitter-python.wasm (Python grammar)
│   └── tree-sitter-rust.wasm (Rust grammar)
├── PythonParser, RustParser (use WASM)
└── GraphExtractor (tree-sitter queries for call graph)
Testing
- Unit tests: Mocked parsers (WASM doesn't run in Node.js)
- E2E tests: Real WASM parsers in VS Code's Electron environment
- 90+ E2E tests validate all functionality with real parsers
Troubleshooting
| Error | Cause | Solution |
|---|---|---|
| "Extension path required" | Internal error | Report as bug |
| "LinkError: WebAssembly.instantiate()" | Node.js limitation | Expected in unit tests; works in VS Code |
| "WASM file not found" | Missing from dist/wasm/ | Run npm run build or reinstall |
License
MIT License — see LICENSE file for details.
Acknowledgements
Language icons provided by SuperTinyIcons — CC0-1.0 license.
Author
magic56 (magic5644)
Reviews (0)
Sign in to leave a review.
Leave a reviewNo results found