acp-devtools
Health Uyari
- License — License: MIT
- Description — Repository has a description
- Active repo — Last push 0 days ago
- Low visibility — Only 5 GitHub stars
Code Basarisiz
- exec() — Shell command execution in .github/workflows/ci.yml
- process.env — Environment variable access in fixtures/drive-full-turn.mjs
- process.env — Environment variable access in fixtures/generate-fat-session.mjs
Permissions Gecti
- Permissions — No dangerous permissions requested
Bu listing icin henuz AI raporu yok.
See exactly what your editor and your coding agent say to each other — a transparent ACP proxy with a live web inspector, CLI, and read-only MCP server.



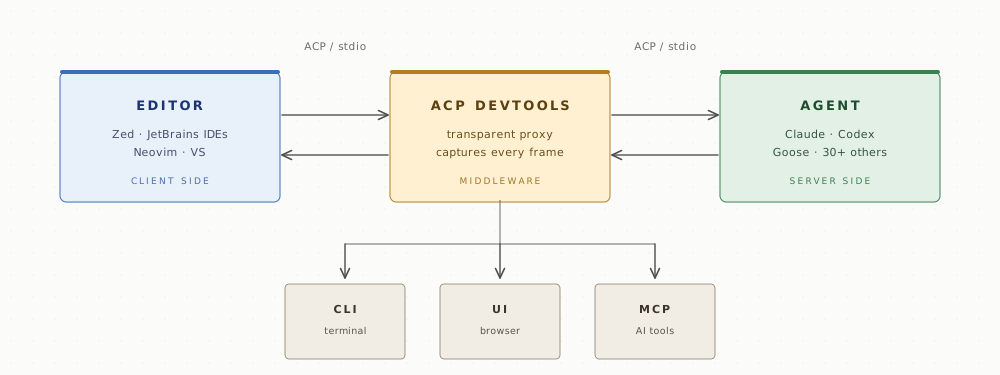
See exactly what your editor and your coding agent say to each other.
ACP Devtools captures every JSON-RPC frame between them, stores each session in SQLite, and streams it to a live web inspector — replay, diff, spec-validation, plus a CLI and a read-only MCP server.
Try it in your browser → opens the playground pre-loaded with a sample session. See the timeline, inspect frames, open the perf panel. Drop your own session.json to inspect your traffic. More about the playground ↓

What is ACP?
The Agent Client Protocol
is an open, newline-delimited JSON-RPC wire format that lets an editor (Zed,
WebStorm, IntelliJ, Neovim, Visual Studio via ReSharper) drive a coding agent
(Claude Code, Codex, Goose, OpenCode, and
40+ others) over stdio,
without either side knowing the other's implementation. ACP Devtools sits in the middle of that stdio pipe — neither side knows it's there.
Never seen the wire before? Anatomy of an ACP session
walks one real capture frame by frame — handshake, prompt turn, a tool call
behind a permission dialog, a cancelled turn — and it's the same session the
playground loads, so you can click along.
Who it's for
- Agent authors — see exactly what an editor sends, and validate your wire
output against the spec. - Editor / plugin developers — see what the other side sends (WebStorm and
Zed disagree on capabilities,_meta, and id format) and test against
recorded traffic without burning tokens. - Anyone debugging a chat — find why
session/prompttook 60s, or replay
yesterday's broken session and step to the failing tool call. - CI — gate releases on spec conformance and latency regressions, headless
(exit-code-driven recipe).
Features
Transparent proxy — captures every frame in both directionsSits between editor and agent over stdio (newline-delimited JSON-RPC 2.0).
Neither side knows it's there.
Each row shows direction, kind, method, rpc id, size, and latency to its paired
request. The detail panel renders the full payload as a spec-aware tree —
hover any field for its schema description, ⚠ ext badges mark _meta and
fields not declared in the spec.
agent_message_chunk runs collapse to one STR row
A shimmer bar marks the cluster while chunks are still arriving — tells
"agent thinking" apart from "agent stuck". Click to expand the individual
chunks.
Invalid frames get a red ⚠ SPEC N badge in the timeline, per-error ajv
details in the detail panel, and a footer aggregate across the session. CLI:acp-devtools validate <id> exits 1 on violations — wire into CI. Frames that are valid today but omit a field the spec says will become mandatory get a softer amber ⚠ ADV N advisory instead.
Sortable table with latency sparklines, auto-detected insights (hotspot,
long-tail, outlier, busiest, errors), and a waterfall canvas with
gap-compression for multi-hour sessions. CLI mirror: stats <id> --by-method
— same percentile algorithm, same numbers to the millisecond.
LCS-aligned frame view with click-to-expand field-level changes, plus a
metadata diff layer (versions, capabilities) and a per-method p99-delta layer.
CLI: diff <a> <b> (add --json for machine output).
Derived from the captured frames — client/agent versions, capability matrix,
runtime mode/model, available slash commands, JetBrains _meta.proxyConfig.
Drawer in the UI; CLI: session-info <id>; MCP: get_session_summary.
Click a result to jump to that row in the timeline. CLI: search <pattern>
with grep-style exit codes (1 if no match).
Every frame is on screen from the start; a left-rail playhead marks the
current position and the timeline follows it as it runs (0.5×–8× speed via
the scrubber). CLI: replay <id> rebroadcasts over WebSocket on a fixed
port for repeatable demos.
Two engineers can debug the same capture without spinning up an editor.
Imported sessions appear in the picker tagged IMPORTED. export redacts
auth headers and proxy tokens (including JetBrains proxy_key) by default
— see Security & privacy.
mock-editor --script <export.json> drives a real agent with recorded editor
traffic (no IDE, no tokens burned); mock-agent does the inverse. Pair withvalidate and stats --json for headless spec/latency gating.
Tools: list_sessions, get_session_summary, find_spec_violations,diff_sessions, search_messages, and 8 more. Wire via acp-devtools mcp
and add to your AI agent's MCP config.
Every capture registers in ~/.acp-devtools/active/<pid>.json with an
ephemeral port. The session picker auto-discovers them — no port conflicts
even with several chats open.
Quickstart
Install via npm
npm install -g acp-devtools
-g is the recommended install — it puts acp-devtools on your PATH, which
is how editors (Zed, JetBrains, Neovim) find it when they spawn the proxy as a
subprocess. Without it, every editor config has to use an absolute path.
If you only want to try the inspector once without installing, npx works too:
npx acp-devtools ui # downloads on first run, slower start; cache path is not PATH-discoverable
Install via Homebrew
brew tap maksugr/tap
brew trust maksugr/tap     # required once — Homebrew 5+ blocks third-party taps by default
brew install acp-devtools
Run the inspector
acp-devtools ui # → http://127.0.0.1:3737/ (auto-opens)
Connect your editor with acp-devtools setup, which writes the config with the
absolute binary path filled in:
acp-devtools setup --editor zed --write                  # Claude Code (default) in Zed
acp-devtools setup junie --editor jetbrains --write      # any registry shortcut
acp-devtools setup --editor zed --write -- npx -y @your-scope/your-acp   # any custom agent
For Claude Code in Zed that's a one-line agent_servers entry — acp-devtools
detects it was spawned by an editor (stdin is a pipe) and runsproxy --agent claude-code internally:
{
    "agent_servers": {
        "Claude Code (via ACP Devtools)": {
            "type": "custom",
            "command": "/opt/homebrew/bin/acp-devtools"
        }
    }
}
Send a prompt → the proxy spawns the agent, and within a second the inspector
shows the handshake:
┌─ SESSION #1 · LIVE ────────────────────────────────────┐
│ #1  18:34:06  → OUT  REQ  initialize             id:0  │
│ #2  18:34:06  ← IN   RSP  —                    +402ms  │
│ #3  18:34:06  → OUT  REQ  session/new            id:1  │
│ #4  18:34:08  ← IN   RSP  —                    +1.84s  │
│ #5  18:34:15  → OUT  REQ  session/prompt         id:2  │
│ #6  18:34:16  ← IN   STR  agent_message_chunk     ×42  │
└────────────────────────────────────────────────────────┘
Drop --write to print the block instead of writing it. If you hand-edit the
config and the editor reports "agent command not found", its GUI can't resolve
the binary — use the absolute path from which acp-devtools (what setup
writes).
Per-editor setups — each covers Claude Code, Codex, Goose, OpenCode, and how to
wrap a custom agent — plus a Claude Code multi-profile / auth recipe:
- Zed setup with every agent
- JetBrains setup (WebStorm / IntelliJ / PyCharm / …)
- Claude Code multi-profile (personal vs work OAuth)
The inspector
A vertical timeline of every frame plus a JSON detail panel. Frames stream in
live; clicking a row expands its payload, with latency annotations, stream
clustering, spec badges, a performance waterfall, replay controls, and a
session diff view. Full tour — labels, detail tabs, perf dashboard, diff panel, shortcuts:
docs/ui.md.
The CLI
Every UI control has a headless equivalent, colorized and grep/jq-friendly.
acp-devtools list                                  # saved sessions, newest first
acp-devtools stats 23 --by-method                  # latency percentiles
acp-devtools inspect 23 --kind req --grep prompt   # filtered timeline, in the terminal
acp-devtools diff 23 41                             # what changed between two sessions
acp-devtools <command> --help                       # grouped, colorized help
Full reference: docs/cli.md. Task-driven walkthroughs
(headless debugging, A/B two agents, mock-based CI): docs/recipes.md.
MCP
acp-devtools mcp exposes saved captures to an AI agent (Claude Code, Claude
Desktop, …) as thirteen read-only tools so you can ask it to investigate your own
traces — or wire up a new agent:
"find spec violations in the last 10 sessions" ·
"compare p99 ofsession/promptbetween WebStorm and Zed" ·
"diff sessions 41 and 42 — what changed?" ·
"add junie for zed"
Setup in one command (Claude Code as an example):
claude mcp add acp-devtools -- acp-devtools mcp
Stdio only; no network surface. Auth tokens and proxy keys are unconditionally
redacted in every tool response — see Security & privacy.
Full tool reference and setup variants for other MCP clients:
docs/mcp.md.
Supported editors & agents
The tables below cover the ACP ecosystem directory, with two verification levels:
verified means we captured a full prompt turn through acp-devtools;
handshake means the agent answered initialize / session/new through
the proxy and a full turn only needs an account for that agent. Every
verified and handshake row links its proof twice: playground opens the
actual capture in the playground in one click, json is the
same redacted export in fixtures/handshakes/ foracp-devtools import or your own tooling.
Using any of these is the same regardless of status. untested means we
haven't captured it yet, not that it won't work. Any ACP agent runs throughacp-devtools setup --editor <zed|jetbrains> -- <its launch command> (orproxy <launch command>); the launch command is the agent's own ACP entry point
(goose acp, junie --acp=true, npx -y @scope/acp, …). The handful that are
registry shortcuts — acp-devtools agents lists them — skip the command:acp-devtools setup <name> --editor zed.
Got one working that's untested? Help flip the row: runfixtures/drive-full-turn.mjs against it
(node fixtures/drive-full-turn.mjs <launch command> — exit 0 means a full
prompt turn worked; exit 3 means the agent answered the handshake but needs
an account for a full turn) and open an
issue with an acp-devtools export attached (auth tokens are redacted on export) — we'll mark the agent
verified.
Editors
| Editor | ACP support | Status |
|---|---|---|
| Zed | native | verified — Zed 1.3.5–1.5.4 · playground · json · setup |
| JetBrains IDEs | native (AI Assistant) | verified — WebStorm 2026.1.2 · playground · json · setup |
| Visual Studio Code | vscode-acp extension |
untested |
| Neovim | CodeCompanion, avante.nvim | untested |
| Emacs | agent-shell package |
untested |
| Obsidian | Agent Client plugin | untested |
| marimo | built into the notebook | untested |
| AionUi | desktop GUI | untested |
| DeepChat | desktop chat app | untested |
| Tidewave | web app | untested |
| aizen | desktop app | untested |
| Sidequery | browser-based, announced | untested |
| Web Browser (AI SDK) | @mcpc/acp-ai-provider |
untested |
Agents
| Agent | Status |
|---|---|
| AgentPool | untested |
| Agoragentic | untested |
| Amp | handshake — amp-acp 0.8.1 · playground · json |
| Augment Code | handshake — auggie 0.29.0 · playground · json |
| Autohand Code | untested |
| Blackbox AI | untested |
| Claude Code | verified — claude-agent-acp 0.37–0.44 · playground · json |
| Cline | untested — CLI 3.0.24 exposes no ACP mode |
| Code Assistant | untested |
| Codebuddy Code | untested |
| Codex CLI | handshake — codex-acp 0.16.0 · playground · json |
| Cortex Code | untested |
| Corust Agent | untested |
| crow-cli | fails — 0.3.0 npm binary links Intel-Homebrew libgc, crashes on Apple Silicon |
| Cursor | verified — cursor-agent 2026.05.16 · playground · json |
| DeepAgents | untested |
| DimCode | untested |
| Dirac | untested |
| Docker cagent | untested |
| Factory Droid | untested |
| fast-agent | untested |
| Gemini CLI | handshake — gemini-cli 0.46.0 · playground · json |
| GitHub Copilot | handshake — copilot 1.0.61 · playground · json |
| GLM Agent | untested |
| Goose | verified — goose 1.37.0 · playground · json |
| Grok Build | untested |
| JetBrains Junie | verified — Junie CLI 26.6.15 · playground · json |
| Kilo | untested |
| Kimi CLI | handshake — Kimi Code CLI 1.47.0 · playground · json |
| Kiro CLI | untested |
| Minion Code | untested |
| Mistral Vibe | handshake — vibe 2.15.0 · playground · json |
| Nova | untested |
| OpenCode | handshake — OpenCode 1.17.4 · playground · json |
| OpenHands | untested |
| Pi | untested |
| Poolside | untested |
| Qoder CLI | untested |
| Qwen Code | handshake — qwen-code 0.17.1 · playground · json |
| siGit Code | untested |
| Stakpak | untested |
| VT Code | fails — vtcode acp 0.52.8 exits silently (no response to initialize) |
Launch shortcuts
The built-in registry maps five common agents to ready commands. npm-based
agents auto-install on first use via npx -y …; binary-based agents need a
one-time install. acp-devtools agents prints this list from the CLI.
| Shortcut | What it runs | Install |
|---|---|---|
claude-code (default) |
npx -y @agentclientprotocol/claude-agent-acp |
npx — automatic |
codex |
npx -y @zed-industries/codex-acp |
npx — automatic |
goose |
goose acp |
install Goose from https://goose-docs.ai first |
opencode |
opencode acp |
curl -fsSL https://opencode.ai/install | bash |
junie |
junie --acp=true |
install Junie CLI from https://junie.jetbrains.com/ first |
Every other agent runs through the explicit form:acp-devtools proxy <your-command> [args…].
Architecture
   Editor (Zed / JetBrains / Neovim / VS via ReSharper)
            │  ACP via stdio (newline-delimited JSON-RPC 2.0)
            ▼
   ┌─────────────────────────────────────────┐
   │  acp-devtools proxy                      │
   │   spawns the agent                       │
   │   captures every frame in both directions│
   │   writes ~/.acp-devtools/captures.db     │
   │   broadcasts on a local WebSocket        │
   │   registers ~/.acp-devtools/active/      │
   └──────────────┬──────────────────────────┘
                  │ stdio
                  ▼
        ACP agent (claude-agent-acp, codex-acp, …)

   Browser ◄── HTTP ──── acp-devtools ui (3737)
                          serves the React bundle + discovers live captures
Neither side of the pipe knows the proxy exists. Multiple captures (one chat per
editor window) coexist on independent ephemeral ports and all appear in the
inspector's session picker.
Security & privacy
ACP traffic carries real secrets. Anything sent on the wire is captured
verbatim into captures.db, including the JetBrains AI gateway token
WebStorm puts on every initialize. acp-devtools is local-first by
design — nothing leaves your machine unless you choose to share an export.
This section spells out what's at risk and what the tool does about it.
What ACP captures contain
| Source | Lives in | Sensitive? |
|---|---|---|
initialize._meta.proxyConfig.proxies[].proxy.headers |
every WebStorm session | YES — JetBrains LLM gateway auth (proxy_key) |
session/new / session/load → mcpServers[].headers and mcpServers[].env |
every session whose editor forwards MCP servers (e.g. Zed context servers) | YES — MCP server tokens, API keys, DB URLs |
initialize response → authMethods[].env (terminal auth) |
agents offering terminal login | YES |
HTTP-style Authorization / X-Api-Key / Cookie headers in any field |
uncommon but possible in custom agents / _meta extensions |
YES |
fs/read_text_file results |
every session that opens files | depends — proprietary source vs. public code |
| Prompts you typed and model responses | every session | depends — internal context vs. generic question |
| Method names, latencies, frame counts, schema shapes | every session | no — useful for bug reports |
The capture file stays on your machine; nothing in the tool uploads it.
The risk surface is when you share an export — and that's what default
redaction targets.
acp-devtools export — redacts by default
acp-devtools export 21 > capture.json    # safe-by-default for sharing
acp-devtools export 21 --raw             # opt-in: keep everything (self-debug only)
What gets replaced with <REDACTED>:
- every string value under any
proxyConfig.proxies[*].proxy.headers.*
subtree (catches future JetBrains fields, not justproxy_key); - every
valuein aheadersorenvlist of{ name, value }pairs — the
spec's shape for MCP server headers and env insession/new/session/load— and every value of anenvmap (terminal auth). Names
stay, so you can still see which variables were passed; - standard HTTP auth headers (
Authorization,X-Api-Key,Cookie, …)
anywhere in the JSON, as object keys or as{ name, value }pairs.
Full rules live in packages/core/src/storage/redact.ts.
Redaction rewrites both payload (parsed) and raw (wire string), so
the secret can't leak via either field. A summary lands on stderr:redacted N field(s) across M message(s) — re-run with --raw to keep them.
The same default applies everywhere output is likely to leave your machine:export, the UI's download button, every MCP tool response, diff, andsession-info (the last two take the same --raw opt-out). Two surfaces
stay raw on purpose: inspect prints the actual wire bytes for local
triage, and the local HTTP API the UI reads
(GET /api/sessions/:id/messages) returns frames as captured — treat both
like the database file itself, not like an export.
What it does not redact (your call)
File contents loaded via fs/read_text_file, the prompts / responses, and
MCP server args and urls stay as-is (a token passed as a command-line flag
or a query parameter is not detected). There's no reliable heuristic for "is this code proprietary" —
that's a judgement call. Before sharing, audit with:
acp-devtools inspect 21 --kind ntf  # all notifications (responses, streaming, tool calls)
acp-devtools inspect 21 --grep proxy_key  # see which frames carry tokens (inspect shows raw bytes)
If something in those fields shouldn't ship, either drop the offending
messages with jq before sharing, or capture a smaller reproducer with
fresh sessions.
Sharing for a bug report
A typical Zed / agent-author bug report:
acp-devtools export 21 > acp-bug.json     # auto-redacted
acp-devtools inspect 21 --grep <secret>   # double-check nothing slipped through
# Attach acp-bug.json to the GitHub issue.
The playground lets the reviewer drop acp-bug.json into
a browser and see the same timeline you saw — no install on their side.
Reporting a security issue
Email security concerns to [email protected] with subject prefix[acp-devtools security]. Please don't open a public issue for actual
disclosures.
Playground
The inspector also runs as a static page at
playground.acp-devtools.dev —
drop a session.json export (or a public gist URL) into a browser and
you get the same timeline you'd get locally. No backend; nothing
uploaded to any server we run (we don't run any). Built from this repo
with VITE_PLAYGROUND=1 and published to GitHub Pages on every push tomain.
This gist sample
pre-loads a real WebStorm ↔ claude-agent-acp session (97 frames: handshake,
a tool call behind a permission dialog, a cancelled turn) — the same capture
Anatomy of an ACP session walks through frame by
frame. Here's how that flow works: the playground fetches the JSON export
from the gist URL and renders it client-side — the gist is the storage,
GitHub serves it over CORS, the playground just renders.
Documentation
- Anatomy of an ACP session — how to read a capture: handshake, prompt turn, what broken looks like
- CLI reference — every command, flag, and sample output
- The inspector (UI) — timeline, detail panel, perf, diff
- MCP server — tools and setup
- Recipes — headless debugging, diffing, mock-based testing
- Changelog — what shipped in each release
- Contributing — build from source, layout, conventions
Co-developed with Claude Code (Opus). Pair-programmed,
but every line was read, shaped, and handcrafted by an experienced human, with love 🖤
License
MIT — see LICENSE.
Yorumlar (0)
Yorum birakmak icin giris yap.
Yorum birakSonuc bulunamadi