context-analyzer
Health Warn
- No license — Repository has no license file
- Description — Repository has a description
- Active repo — Last push 0 days ago
- Low visibility — Only 5 GitHub stars
Code Pass
- Code scan — Scanned 12 files during light audit, no dangerous patterns found
Permissions Pass
- Permissions — No dangerous permissions requested
No AI report is available for this listing yet.
See where your Claude Code tokens go — cost per call scales 4.3x with context size. Hooks + SQLite + dashboard + MCP server for context window forensics.
Context Analyzer
Context window usage analyzer for Claude Code. Tracks how context is consumed across tools, compaction, skills, and user interactions — then visualizes it so you can optimize your sessions.
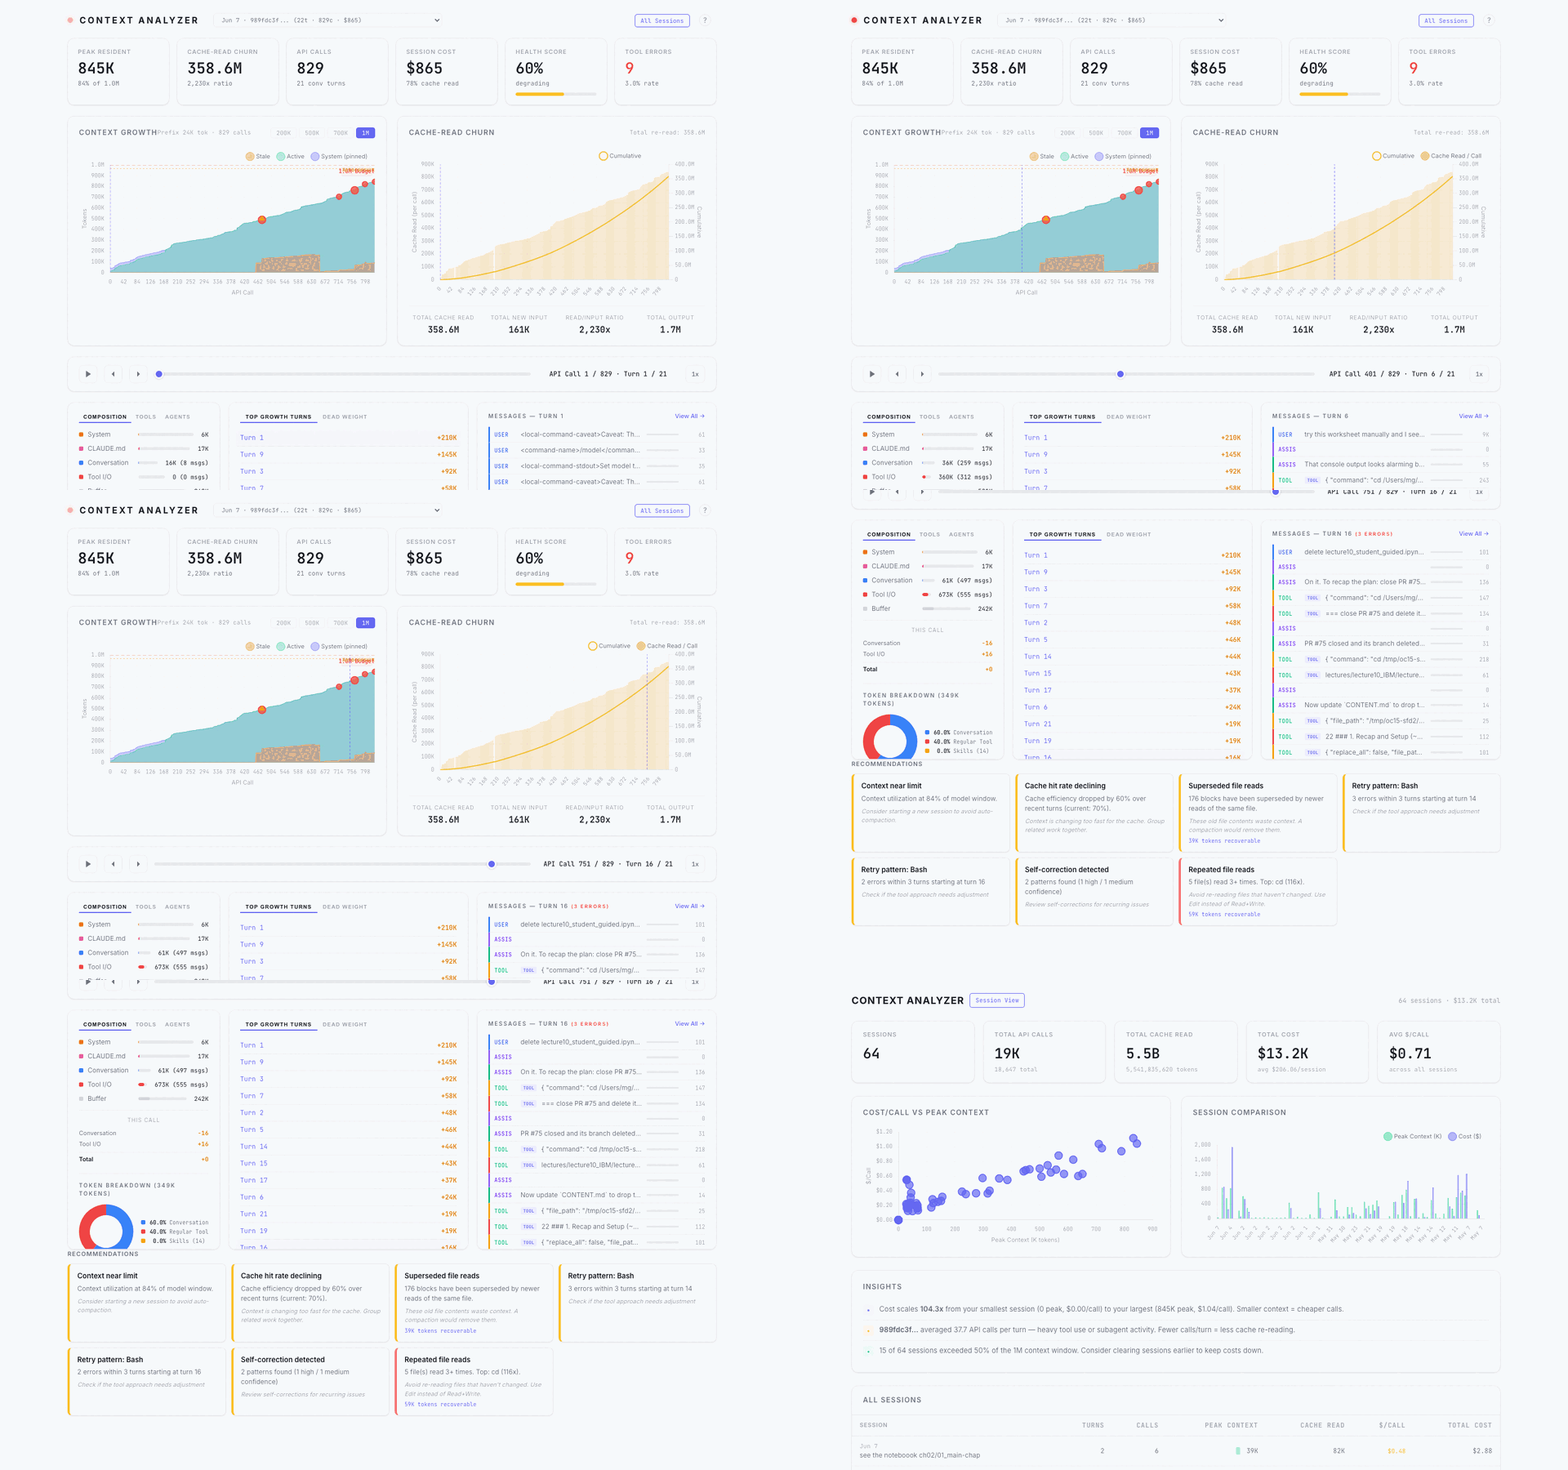
What it does
- Hooks into Claude Code via
~/.claude/settings.jsonto capture tool calls, compaction events, session lifecycle, and subagent activity - Parses transcripts for exact API token usage (input, output, cache_read, cache_creation)
- SQLite persistence stores session data (9 tables, 2,900+ rows per session) for fast queries and cross-session analysis
- Dashboard at
/for single-session visualization: context growth, cache churn, composition, message inspector - Cross-session analytics at
/sessionsfor comparing patterns across sessions: cost/call vs context size, insights, trends
Prerequisites
- Python 3.11+
- uv — fast Python package manager
- make
- git
# Install uv (if not already installed)
curl -LsSf https://astral.sh/uv/install.sh | sh
Quick Start
git clone https://github.com/manavgup/context-analyzer.git
cd context-analyzer
make install-dev       # create venv and install with uv
make hook-install      # install Claude Code hooks (optional — dashboard works without hooks)
make dev               # start dashboard on localhost:8080
Then open:
http://localhost:8080/— single-session dashboard (picks most recent session)http://localhost:8080/sessions— cross-session analytics
Upgrading
After upgrading context-tracker, re-run the installer to refresh the Claude
Code hooks in ~/.claude/settings.json:
make hook-install # or: context-tracker install
Older versions installed a hook command that could fail to importcontext_tracker (and broke on interpreter paths containing spaces).
Reinstalling rewrites context-tracker's hook entries with the corrected,
pinned-and-quoted interpreter. It is idempotent, backs up your settings first,
and leaves any other hooks you have configured untouched. See
CHANGELOG.md for details.
Screenshots
Single-Session Dashboard
The main dashboard shows how your context window is consumed over the course of a session. Use the session dropdown to switch between sessions, budget buttons to set your target threshold, and the scrubber to step through API calls.
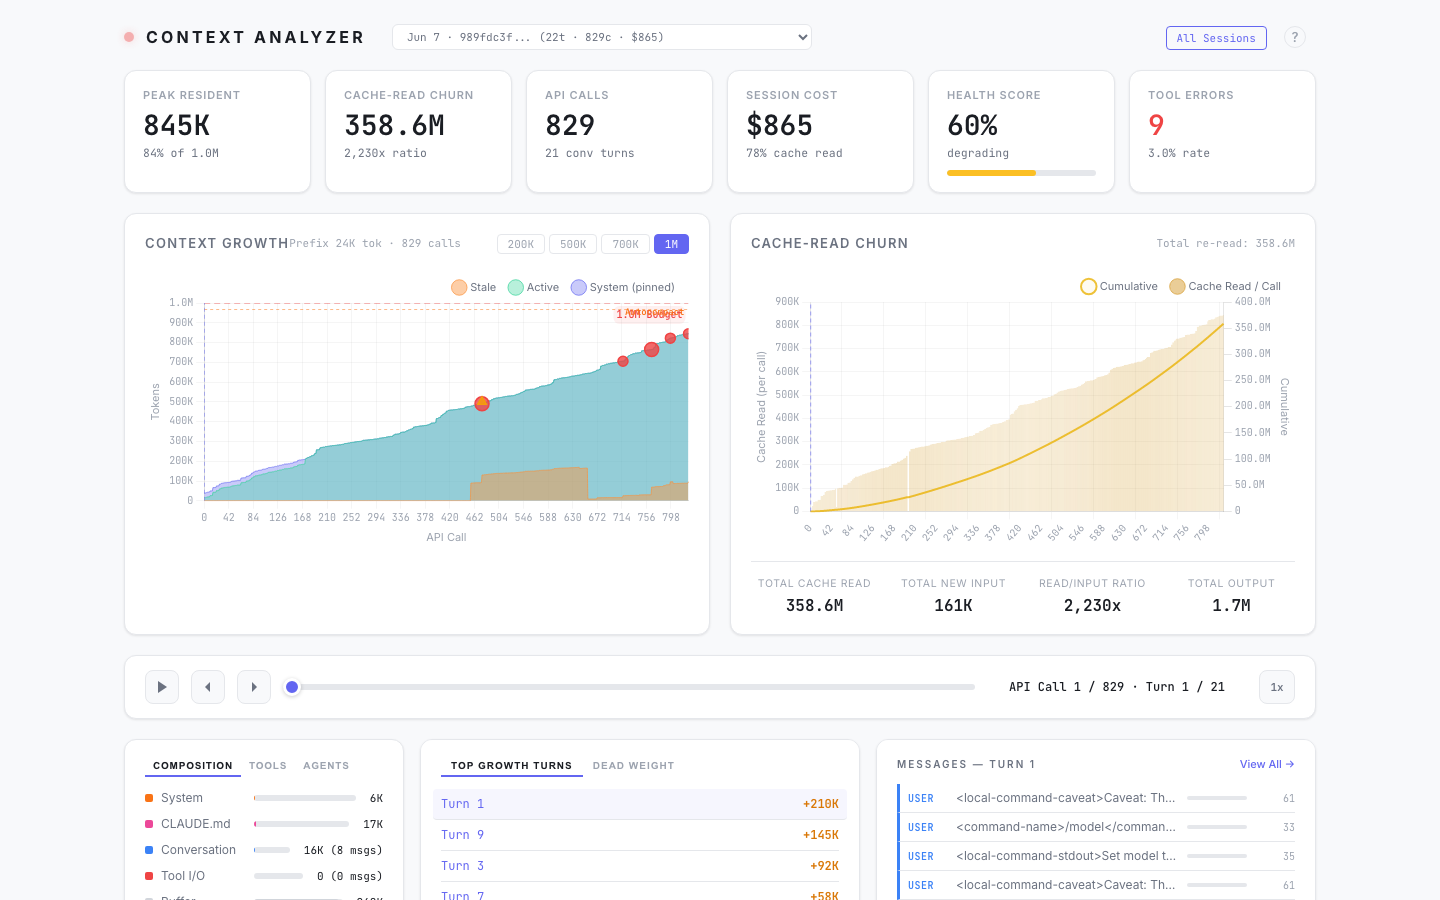
Budget Line + Danger Band
Toggle budget thresholds (200K / 500K / 700K / 1M) to see where your context usage exceeds your target. The dashed red line is your budget, the orange dotted line is where Claude Code auto-compacts, and the red shading is the danger zone.
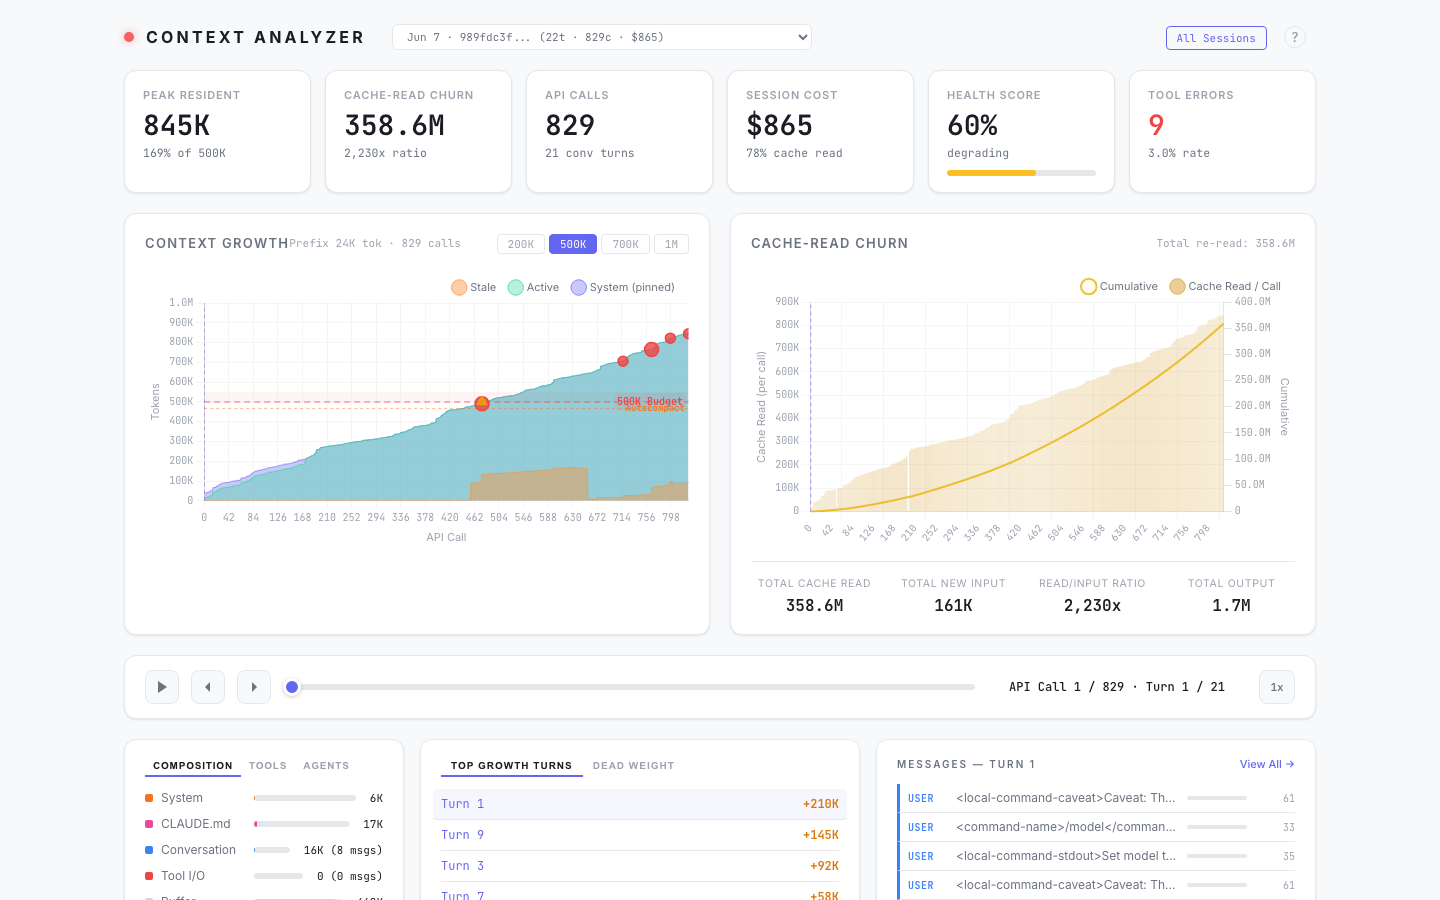
Token Breakdown + Composition
The composition panel shows where tokens go at each API call, using API-reported numbers as ground truth. The donut chart breaks down Tool I/O vs Conversation vs System prefix — updating live as you scrub through the session.
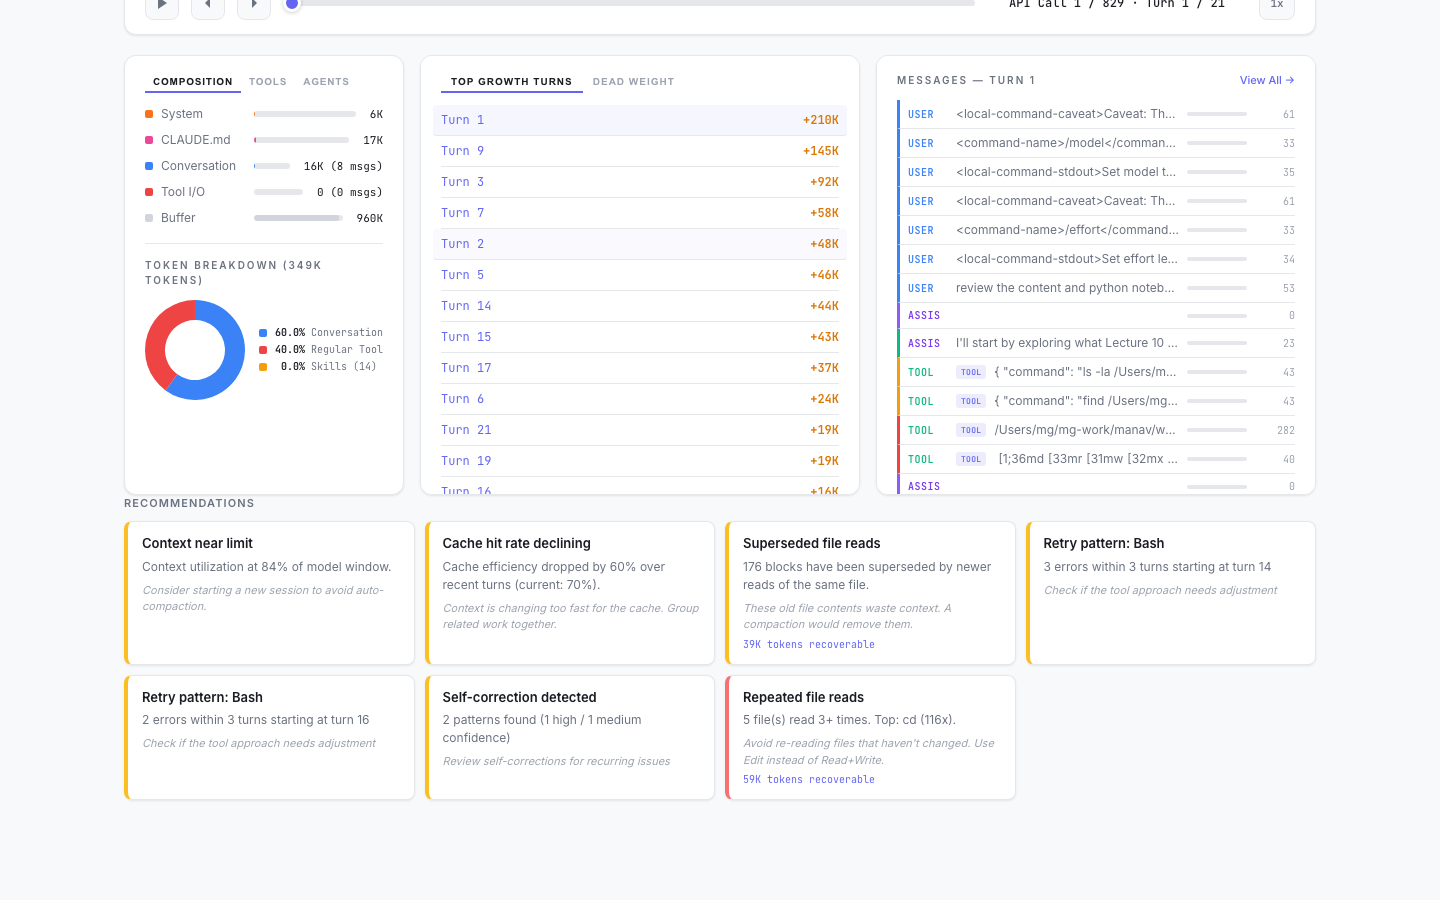
Message Inspector
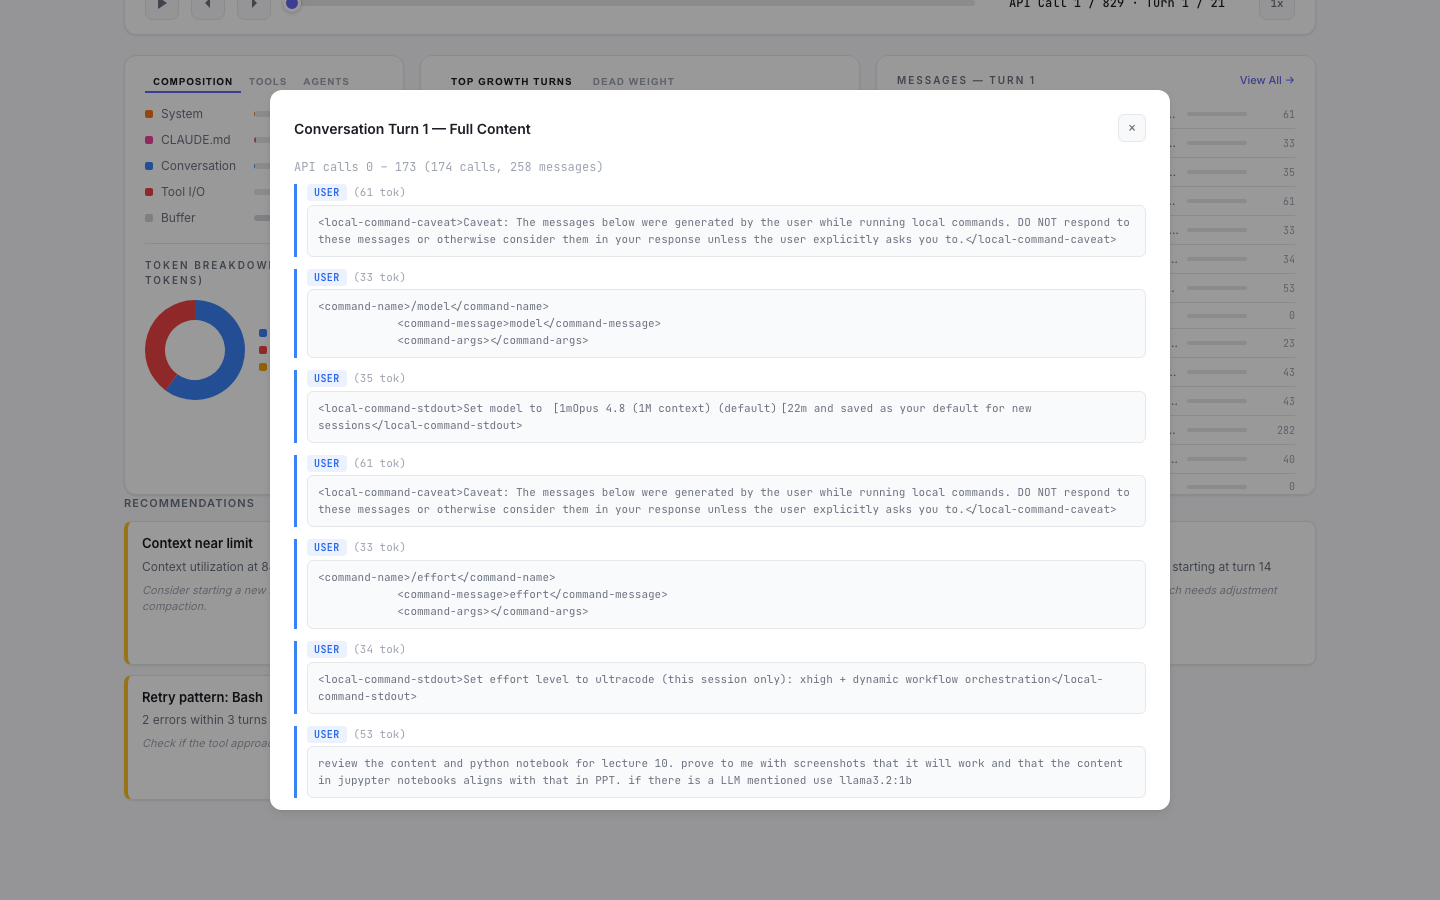
Click "View All" on any conversation turn to see the full content — user prompts, tool calls with inputs, tool results, and assistant responses. Long content blocks collapse by default with "Show N more lines".
Cross-Session Analytics
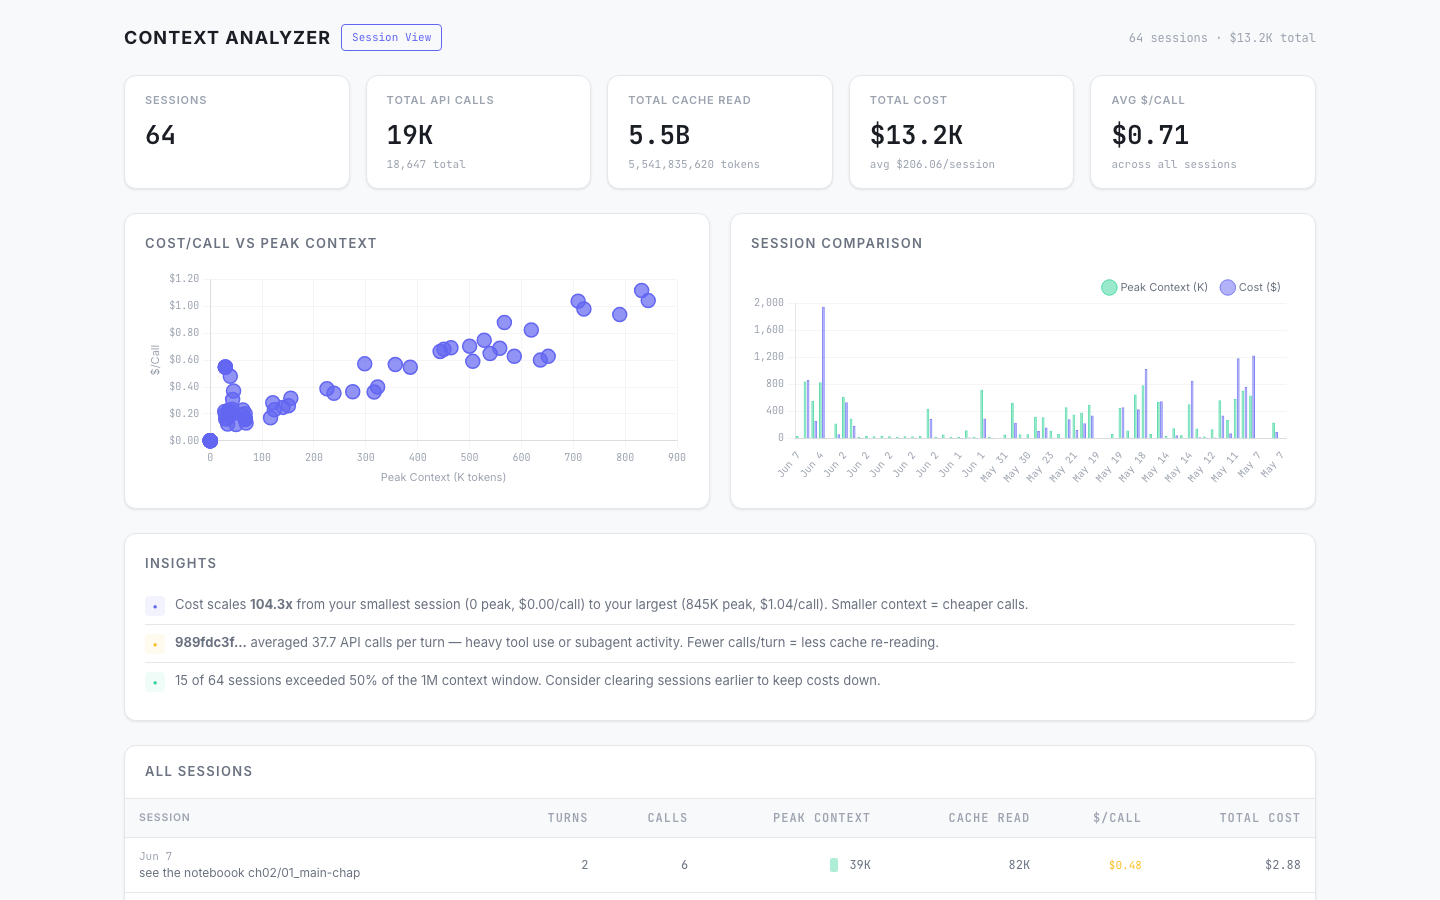
The /sessions page shows all your sessions with sortable stats, a cost/call vs peak context scatter plot, session comparison chart, and auto-generated insights about your usage patterns.
Dashboard Features
Single-session view (/)
- Context Growth chart with budget line, danger band, and autocompact threshold
- Budget toggle buttons (200K / 500K / 700K / 1M)
- Cache-Read Churn chart showing per-call re-read cost
- Session dropdown to switch between sessions without restarting
- Message inspector with collapsible content blocks
- Token breakdown donut chart (Tool I/O vs Conversation vs System) — updates per-turn
- Composition breakdown with API-reported token counts (not estimates)
- Unified color palette across all views (donut, composition bars, message badges)
- Top growth turns, scrubber with playback
Cross-session analytics (/sessions)
- Summary cards: total sessions, API calls, cache read, cost, avg $/call
- Cost/Call vs Peak Context scatter plot (shows cost scaling with context size)
- Session comparison bar chart
- Auto-generated insights (cost patterns, expensive sessions, efficiency metrics)
- Sortable session table with $/call color coding
- Click any session to drill into its single-session view
Development
make help          # see all available targets
make dev           # start dashboard dev server with reload
make lint          # run linter
make format        # format code
make typecheck     # run mypy
make coverage      # run tests with coverage
make verify        # run full verification suite (lint + format + typecheck + test)
Architecture
Claude Code Hooks (shell commands)
  ├── PostToolUse, PostToolUseFailure
  ├── PreCompact, PostCompact
  ├── SessionStart, SessionEnd
  ├── UserPromptSubmit
  ├── SubagentStart, SubagentStop
  └── InstructionsLoaded
       │
       ▼
  ~/.claude/context-trace/<session_id>.jsonl  (hook events)
  ~/.claude/projects/<project>/<session_id>.jsonl  (transcripts)
       │
       ▼
  SQLite (auto-ingest on first access)
  ├── sessions       — summary stats, cost, model
  ├── api_calls      — per-call token breakdown
  ├── blocks         — content blocks with enter/exit turns
  ├── turns          — conversation turn mapping
  ├── hook_events    — tool calls, failures, lifecycle
  ├── subagents      — agent summaries
  ├── subagent_api_calls — per-call churn for each subagent
  └── tool_result_offloads — offloaded tool outputs
       │
       ▼
  FastAPI Dashboard + MCP Server
  ├── /              — single-session dashboard
  ├── /sessions      — cross-session analytics
  ├── /api/sessions  — session list with stats
  ├── /api/sessions/trends — cross-session aggregation
  └── /api/session/{id}/data — full session data (blocks + churn)
Key findings from real sessions
- Cost per API call scales 4.3x from small to large context (63K peak = $0.23/call vs 721K peak = $0.98/call)
- Tool I/O consumes 60%+ of used context
- 30% of context becomes stale dead weight within 5 turns
- Cache hit rate is 96-98% when the system prompt prefix stays stable
- Sessions exceeding 50% of the 1M context window drive disproportionate cost
License
MIT
Reviews (0)
Sign in to leave a review.
Leave a reviewNo results found