claude-usage-statusline
Health Warn
- License — License: MIT
- Description — Repository has a description
- Active repo — Last push 0 days ago
- Low visibility — Only 6 GitHub stars
Code Pass
- Code scan — Scanned 12 files during light audit, no dangerous patterns found
Permissions Pass
- Permissions — No dangerous permissions requested
No AI report is available for this listing yet.
Claude API usage monitor with history, sparklines, ETA projections, and Claude Code statusline integration
claude-usage-statusline
Know your Claude usage before you hit the wall.


Install • Claude Code • Commands • How it works • Configuration • Development
Claude Code tells you about your plan limits when you hit them. This puts the
5-hour and 7-day usage in your Claude Code statusline, together with how fast
you burn it, when you will reach 100% at that pace, and when the window resets.
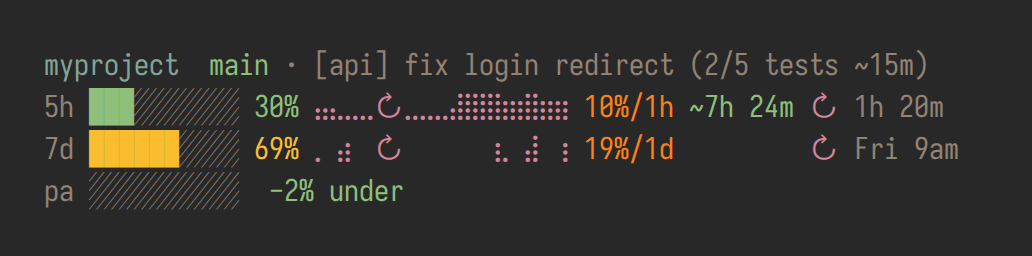
Reading the rows, left to right:
| Column | Example | Meaning |
|---|---|---|
| bar, percentage | ███░░░░░░░ 30% |
Usage of the window. Green below 50%, yellow below 80%, red above. |
| sparkline | ⣤⣄⣀⣀↻⣀⣀⣀⣼⣿⣿⣷ |
Burn rate over the window (5 hours for 5h, 7 days for 7d). Each character is two time slots; height is how much usage grew in that slot. ↻ marks a reset. |
| rate | 10%/1h |
Usage burned in the last hour (5h) or day (7d). Red when the projection hits 100% before the reset. |
| ETA | ~7h 24m |
When you reach 100% at the current pace: a duration for 5h, a day and hour for 7d. Green when it is well after the reset, yellow when close, red before it. Hidden when you will not reach 100% before the reset. |
| reset | ↻ 1h 20m |
When the window resets. |
pa row |
-2% under |
Pacing: 7-day usage against an even spread over your work week. |
The first line shows the directory, the git branch and, if you use it, a
task label for the Claude session.
Single line (the default):

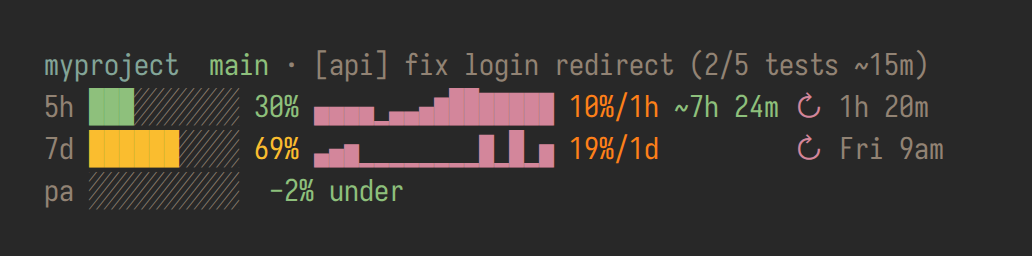
Block sparklines (CU_SPARKLINE_TYPE=block):
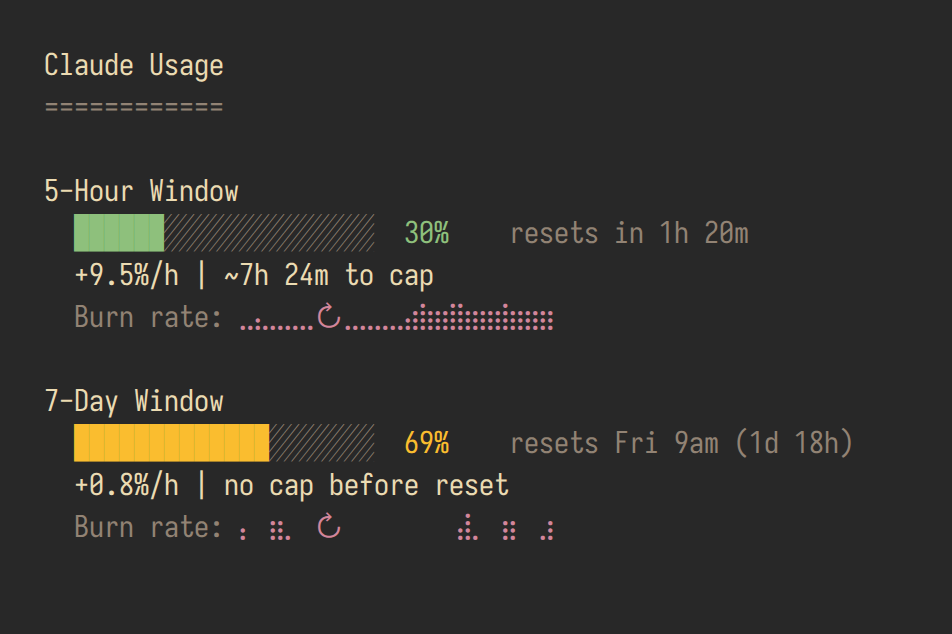
Dashboard (claude-usage):
History (claude-usage history-view):
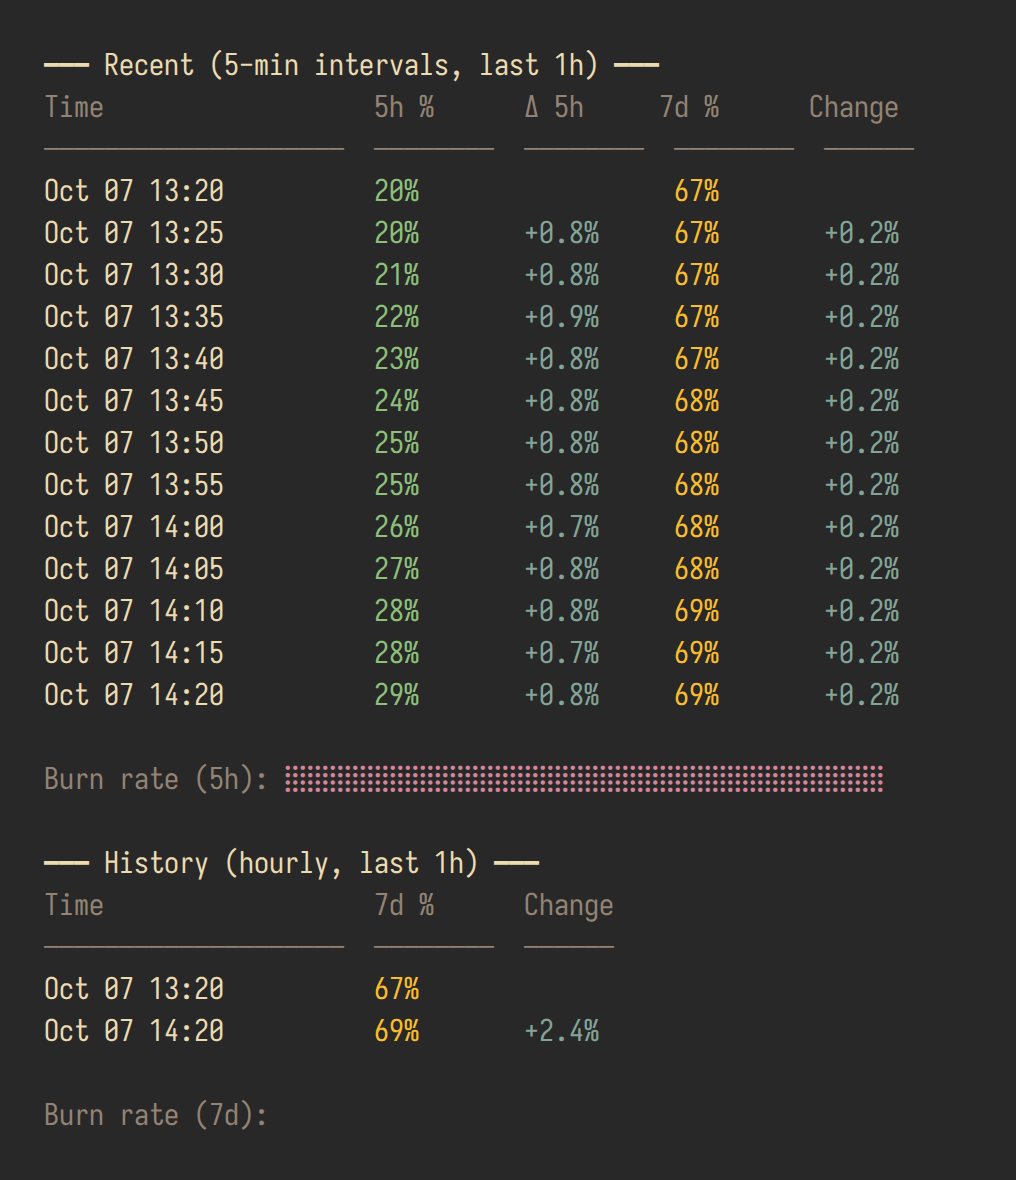
All screenshots come from a fixed demo dataset (scripts/screenshots.sh).
Install
Needs bash 4+, jq, curl and awk (and git for the clone install). flock (util-linux) is optional.
Nix:
nix profile install github:meros/claude-usage-statusline
Git clone (installs to ~/.local/share/claude-usage-statusline and links~/.local/bin/claude-usage):
curl -fsSL https://raw.githubusercontent.com/meros/claude-usage-statusline/main/install.sh | bash
Run without installing:
nix run github:meros/claude-usage-statusline
Use it from a flake (the package, or overlays.default which addspkgs.claude-usage-statusline):
{
  inputs.claude-usage-statusline.url = "github:meros/claude-usage-statusline";
}
Set up Claude Code
claude-usage install-hook --multiline
This sets statusLine.command in ~/.claude/settings.json (or$CLAUDE_CONFIG_DIR/settings.json) and keeps the rest of the file. Display
flags you pass (--multiline, --windows, --modules, --sparkline-type,--bar-width) go into the command. Leave out --multiline for the single-line
layout. Restart Claude Code.
To configure it further, put CU_* variables in front of the command:
{
  "statusLine": {
    "type": "command",
    "command": "CU_WINDOWS=seven_day CU_PACE_ENABLED=0 claude-usage statusline --multiline"
  }
}
Commands
| Command | What it does |
|---|---|
claude-usage / show |
Dashboard: both windows, rate, projection and sparkline |
statusline |
Statusline output; reads Claude Code's session JSON on stdin |
eta |
Burn rate and time to 100% per window |
fetch |
Fetch from the API now, record history, prune old records |
history |
Raw JSONL history (--tier short or --tier long) |
history-view (hv) |
History tables with changes and sparklines (--hours N) |
sparkline |
A sparkline string only (--tier, --hours, --width, --braille) |
debug-template (dt) |
Trace the 7-day projection hour by hour |
install-hook |
Configure Claude Code (see above) |
help |
Commands and flags |
Flags for all commands: --no-color, --no-fetch (use the cache, no API
call), --data-dir PATH, --cache-dir PATH.
How it works
Where the numbers come from
- Claude Code's stdin. Since v2.1.80, Claude Code passes
rate_limits
(5h and 7d used percentage and reset time) to the statusline command. When
it is there, no network call happens. - The OAuth usage API (
api.anthropic.com/api/oauth/usage), with the
token Claude Code stores in~/.claude/.credentials.jsonor the macOS
Keychain. Used only when stdin has norate_limits(older Claude Code, the
first render of a session, or theshow/eta/fetchcommands). The
response is cached for 5 minutes, and parallel statuslines share one call
(flock). The API rate-limits aggressively
(anthropics/claude-code#31637);
on a rate-limit error it backs off 5, 10, 20, then 30 minutes and keeps
showing the last data with a(stale 1h 9m, retry 10m)note.
With ANTHROPIC_BASE_URL set to a non-Anthropic endpoint (LiteLLM,
OpenRouter, ...) plan limits do not apply, and the statusline shows only the
directory and branch.
History
Every render records a snapshot in two JSONL files:
| Tier | Interval | Kept | Contents | Used for |
|---|---|---|---|---|
| short | 5 minutes | 36 hours | 5h and 7d | burn rate, 5h sparkline |
| long | 1 hour | 1 year | 7d | 7d sparkline, seasonal projection |
History builds up as you use Claude Code; the rate and projections improve
after the first hours and days.
Projections
- Burn rate is the usage added over the last
CU_ETA_5H_AVG(1) orCU_ETA_7D_AVG(24) hours, divided by that many wall-clock hours. Drops
(resets) never count as negative use, and idle time lowers the rate. - 5h ETA extrapolates that rate to 100%.
- 7d ETA uses a seasonal template once there are 3 days of hourly history:
for each hour of the week (Monday 10:00, Saturday 03:00, ...) it learns your
average burn from the last 4 weeks, then walks forward hour by hour from now
to the reset. Because weekly use follows work hours, this does not project a
Tuesday-afternoon pace onto the weekend. SetCU_ETA_TEMPLATE=0to use the
flat rate.claude-usage debug-templateprints the learned profile and the
walk.
Pacing the work week
The pa row (or | pace: in single-line) compares 7-day usage with a target
that spreads the weekly cap evenly over your work hours:
target = 100% × (work hours of this week already passed / work hours per week)
With the default Monday-Friday 07-16, the target rises 2.2 points per work
hour and stays flat at night and on the weekend. +12% over means you are 12
points ahead of that curve; the bar fills at CU_PACE_BAR_SCALE (30) points
over. Set your own week with CU_PACE_WORK_DAYS and CU_PACE_WORK_HOURS, or
turn the row off with CU_PACE_ENABLED=0.
Task label
The header can show a short label and progress for each Claude session, such
as · [api] fix login redirect (2/5 tests ~15m). Something in your Claude Code
setup (a hook, a shell function) writes them; this tool only reads:
| File | First line |
|---|---|
$CU_TASK_STATE_DIR/pid-<PID> |
the label |
$CU_TASK_STATE_DIR/progress-<PID> |
the progress |
<PID> is the process ID of the claude process; the statusline finds it by
walking up its parent processes (Linux only). If CU_TASK_HELPER is
executable, the output of $CU_TASK_HELPER summary replaces the progress
file. Nothing shows when the files do not exist.
Configuration
Every setting is an environment variable. Flags override them where a flag
exists.
Layout
| Variable | Default | Description |
|---|---|---|
CU_WINDOWS |
five_hour,seven_day |
Windows to show, in order (--windows) |
CU_MODULES |
see below | Modules per window, in order (--modules) |
CU_HEADER_MODULES |
dir,branch,task |
Header parts; empty hides the header |
CU_SPARKLINE_TYPE |
braille |
braille (2 slots per character) or block (▁▂▃▄▅▆▇█) |
CU_SPARKLINE_WIDTH |
16 |
Sparkline characters in the statusline |
CU_BAR_WIDTH |
10 |
Progress bar cells (--bar-width) |
CU_PCT_WARN |
50 |
Usage % where green turns yellow |
CU_PCT_CRIT |
80 |
Usage % where yellow turns red |
Modules: bar (multiline only), pct, sparkline, rate, eta, reset.
Defaults: pct,sparkline,rate,eta,reset (single-line) andbar,pct,sparkline,rate,eta,reset (multiline).
Projection and pacing
| Variable | Default | Description |
|---|---|---|
CU_ETA_5H_AVG |
1 |
Hours behind the 5h burn rate |
CU_ETA_7D_AVG |
24 |
Hours behind the 7d burn rate |
CU_ETA_TEMPLATE |
1 |
0 uses the flat rate for the 7d ETA too |
CU_ETA_TEMPLATE_DAYS |
28 |
Days of history the 7d template learns from |
CU_ETA_TEMPLATE_MIN_DAYS |
3 |
Days of history needed before the template is used |
CU_PACE_ENABLED |
1 |
0 hides the pacing row |
CU_PACE_WORK_DAYS |
mon-fri |
Work days: mon-thu, mon,wed,fri, 1-5 (1 = Monday), ranges wrap (sun-thu) |
CU_PACE_WORK_HOURS |
07-16 |
Local work hours, start-end, end excluded |
CU_PACE_BAR_SCALE |
30 |
Points over target that fill the pacing bar |
CU_PACE_CONTRACT_PATH |
~/.cache/claude-pacing/statusline.json |
Pacing from an external tool ({"util", "target", "updated_at"}), read only when no usage data exists |
Colors
Values are ANSI SGR codes, for example "38;2;255;0;0" (24-bit red) or "31".NO_COLOR or --no-color turns colors off.
| Variable | Default | Used for |
|---|---|---|
CU_COLOR_SPARKLINE |
purple | Sparklines |
CU_COLOR_RATE |
orange | Burn rate |
CU_COLOR_ETA |
by margin | ETA; empty colors it red/yellow/green by its margin to the reset |
CU_COLOR_RESET |
dim | Reset time |
CU_COLOR_RESET_ICON |
purple | ↻ |
CU_COLOR_LABEL |
dim | 5h / 7d / pa labels, task label |
CU_COLOR_DIR |
aqua | Directory |
CU_COLOR_BRANCH |
green | Git branch |
CU_COLOR_WARN |
red | Rate when the cap comes before the reset |
Data, network and the rest
| Variable | Default | Description |
|---|---|---|
CU_DATA_DIR |
$XDG_DATA_HOME/claude-usage |
History files (--data-dir) |
CU_CACHE_DIR |
$XDG_CACHE_HOME/claude-usage |
API cache, backoff, lock (--cache-dir) |
CU_CACHE_MAX_AGE |
300 |
Seconds before the API cache is refreshed |
CU_NO_LIMITS / CU_HIDE_LIMITS |
1 hides plan limits (as with a custom endpoint) |
|
CU_TASK_ENABLED |
1 |
0 hides the task label |
CU_TASK_STATE_DIR |
~/.local/state/claude-tasks |
Task label files |
CU_TASK_HELPER |
~/.claude/hooks/claude-task.sh |
Optional progress helper |
CU_UPDATE_CHECK |
1 |
0 turns off the "Update available" notice (git installs only; shown for 15 s at the start of a session) |
CU_UPDATE_TTL |
3600 |
Seconds between update checks |
CU_DEBUG |
1 logs to stderr, or to CU_LOG_FILE |
Data files
| File | Contents |
|---|---|
$CU_DATA_DIR/history-short.jsonl |
5-minute records, 36 hours |
$CU_DATA_DIR/history-long.jsonl |
Hourly 7d records, 1 year |
$CU_CACHE_DIR/api-response.json |
Last usage data; its mtime is the last refresh |
$CU_CACHE_DIR/rate-limit-backoff |
Current backoff in seconds, while backing off |
A record looks like{"ts":1791375600,"five_hour":{"util":30,"resets_at":"2026-10-07T13:40:00Z"},"seven_day":{...}}.
Old single-file history.jsonl from earlier versions is migrated on first run
(backup: history.jsonl.bak).
Troubleshooting
- Nothing after the branch. No usage data yet. Run
claude-usage fetchand
read its error.No Claude credentials foundmeans you are not logged in to
Claude Code with a subscription account. (stale …, retry …). The API rate-limited the fetch. Recent Claude Code
versions pass usage on stdin and do not need the API; update Claude Code.- Squares instead of sparklines. Your terminal font has no
braille characters. UseCU_SPARKLINE_TYPE=block. - Debug a render:
echo '{"workspace":{"current_dir":"'$PWD'"}}' | CU_DEBUG=1 claude-usage statusline
Development
Pure bash, no build step. bin/claude-usage sources lib/load.sh, which loads
the modules in order:
| File | Responsibility |
|---|---|
lib/util.sh |
Paths, clock (CU_NOW), colors, formatting |
lib/config.sh |
CU_* defaults, window definitions, limit suppression |
lib/fetch.sh |
Token lookup, API fetch, backoff, cache, stdin rate_limits |
lib/history.sh |
Two-tier history: record, read, prune, migrate |
lib/eta.sh |
Burn rate, flat ETA, seasonal 7d template and its debug trace |
lib/render.sh |
Sparklines, bars, value formatting |
lib/pace.sh |
Work-week pacing |
lib/task.sh |
Session task label |
lib/update.sh |
Update notice |
lib/cli.sh |
Flags, subcommands, help |
views/*.sh |
Statusline, dashboard and history-view output |
bash tests/run-tests.sh            # every suite
bash tests/run-tests.sh fetch cli  # some suites
nix flake check                    # tests + shellcheck in the Nix sandbox
tests/test-snapshots.sh runs every view on a fixed demo dataset
(tests/lib/demo.sh) and compares the output, colors included, withtests/snapshots/. After a deliberate output change, review and accept it:
UPDATE_SNAPSHOTS=1 bash tests/test-snapshots.sh && git diff tests/snapshots
bash scripts/screenshots.sh renders docs/*.png from the same dataset (needs
Nix for the font and Chrome or Chromium).
Issues and PRs welcome.
License
Reviews (0)
Sign in to leave a review.
Leave a reviewNo results found