claude-code-session-tracker
Health Warn
- License — License: MIT
- Description — Repository has a description
- Active repo — Last push 0 days ago
- Low visibility — Only 6 GitHub stars
Code Fail
- fs module — File system access in .github/workflows/release.yml
- rm -rf — Recursive force deletion command in macos/build.sh
- fs module — File system access in package.json
- process.env — Environment variable access in scripts/build.js
- network request — Outbound network request in scripts/formula.mjs
Permissions Pass
- Permissions — No dangerous permissions requested
No AI report is available for this listing yet.
A local dashboard for every Claude Code session on your machine: live status, titles and token usage grouped by project.
Claude Code Session Tracker


See every Claude Code session on your machine in a local dashboard — grouped by
project, with live status, titles, and token usage.
npx claude-code-session-tracker
Or install it for good, if you would rather have it on your PATH:
brew install meyusufdemirci/tap/claude-code-session-tracker
Then open the printed http://127.0.0.1:3099.
Run Claude Code in four terminals and you lose track of which one is waiting on
you, which is still working, and what you asked the one you abandoned yesterday.
Claude Code already writes all of that to ~/.claude. This reads it — nothing
else — and puts it on one page.
What you get
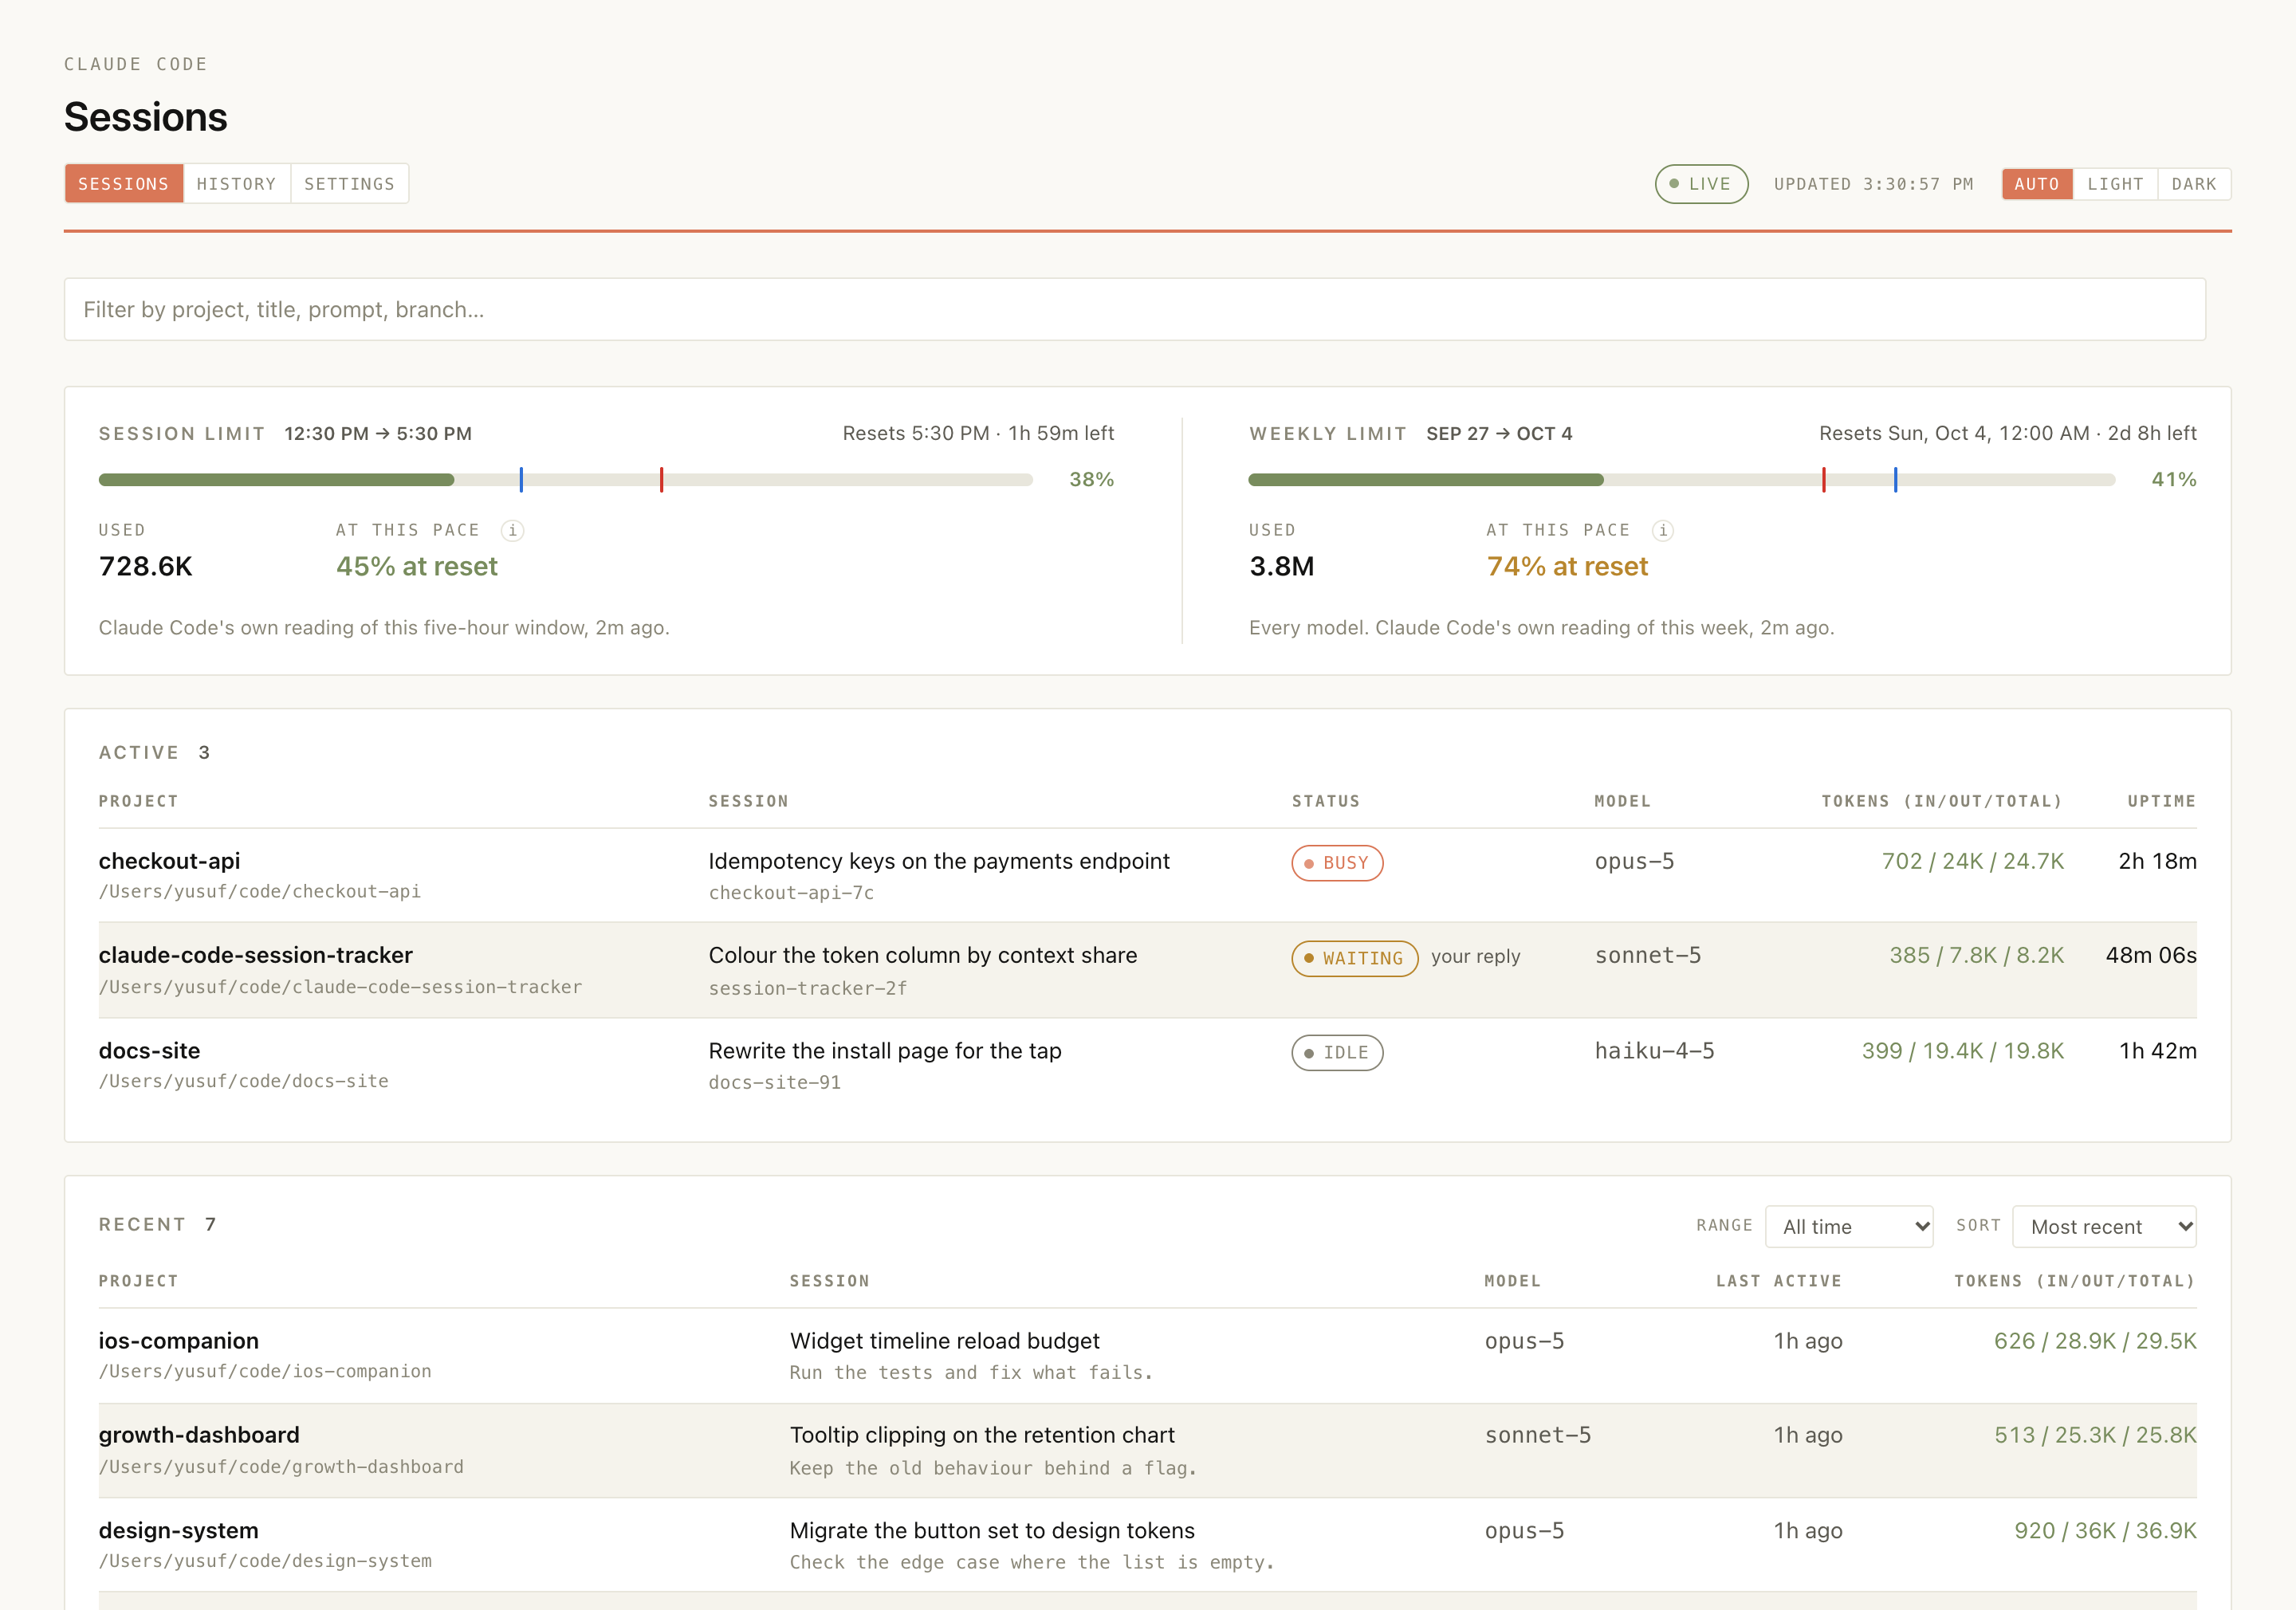
- Your limits, at the top: two cards, one for the five-hour window Claude
Code calls a session limit and one for the seven-day window it calls a weekly
limit — how full each one is, when it resets, and when it runs out if you keep
working at the pace of the last hour (or, for the week, the last day). The
percentage is the one/usageshows, asked of Anthropic's server with Claude
Code's own sign-in, so the two never quote you different numbers for the same
window. Each bar carries two ticks — how much of the window's time has gone, and
where the fill lands by the reset — and is coloured by pace: a fill running ahead
of the clock tick is red, because at that rate the limit runs out first. - A notification when either window is on course to run out before it resets —
so the window that gets away from you is not the one you were too busy to check.
A switch each on the settings page, both off
until you turn one on, each with its own interval for how often it may interrupt
you: an hour for the five-hour window, four hours for the week. Offered once on a
first run, and once more a fortnight later if you waved it away. - Active sessions, checked twice against the OS so a stale file or a
recycled PID never shows up as running. - Recent sessions across every project, with Claude's own title, the first
and last prompt, the model, and the branch — narrowed to today, yesterday, the
last 3, 7 or 30 days, or a date range of your own, and ordered by recency or by
token spend. - A history page at
/history: where the tokens went over the last 7, 30 or 90
days — spend per day, week or month, every half hour of the range laid over one
week, a calendar year day by day, and every project and model ranked by what they
billed. Pick a project and the whole page narrows to it. Export writes the
range as a PDF or an.xlsxspreadsheet, and Share turns the year into an
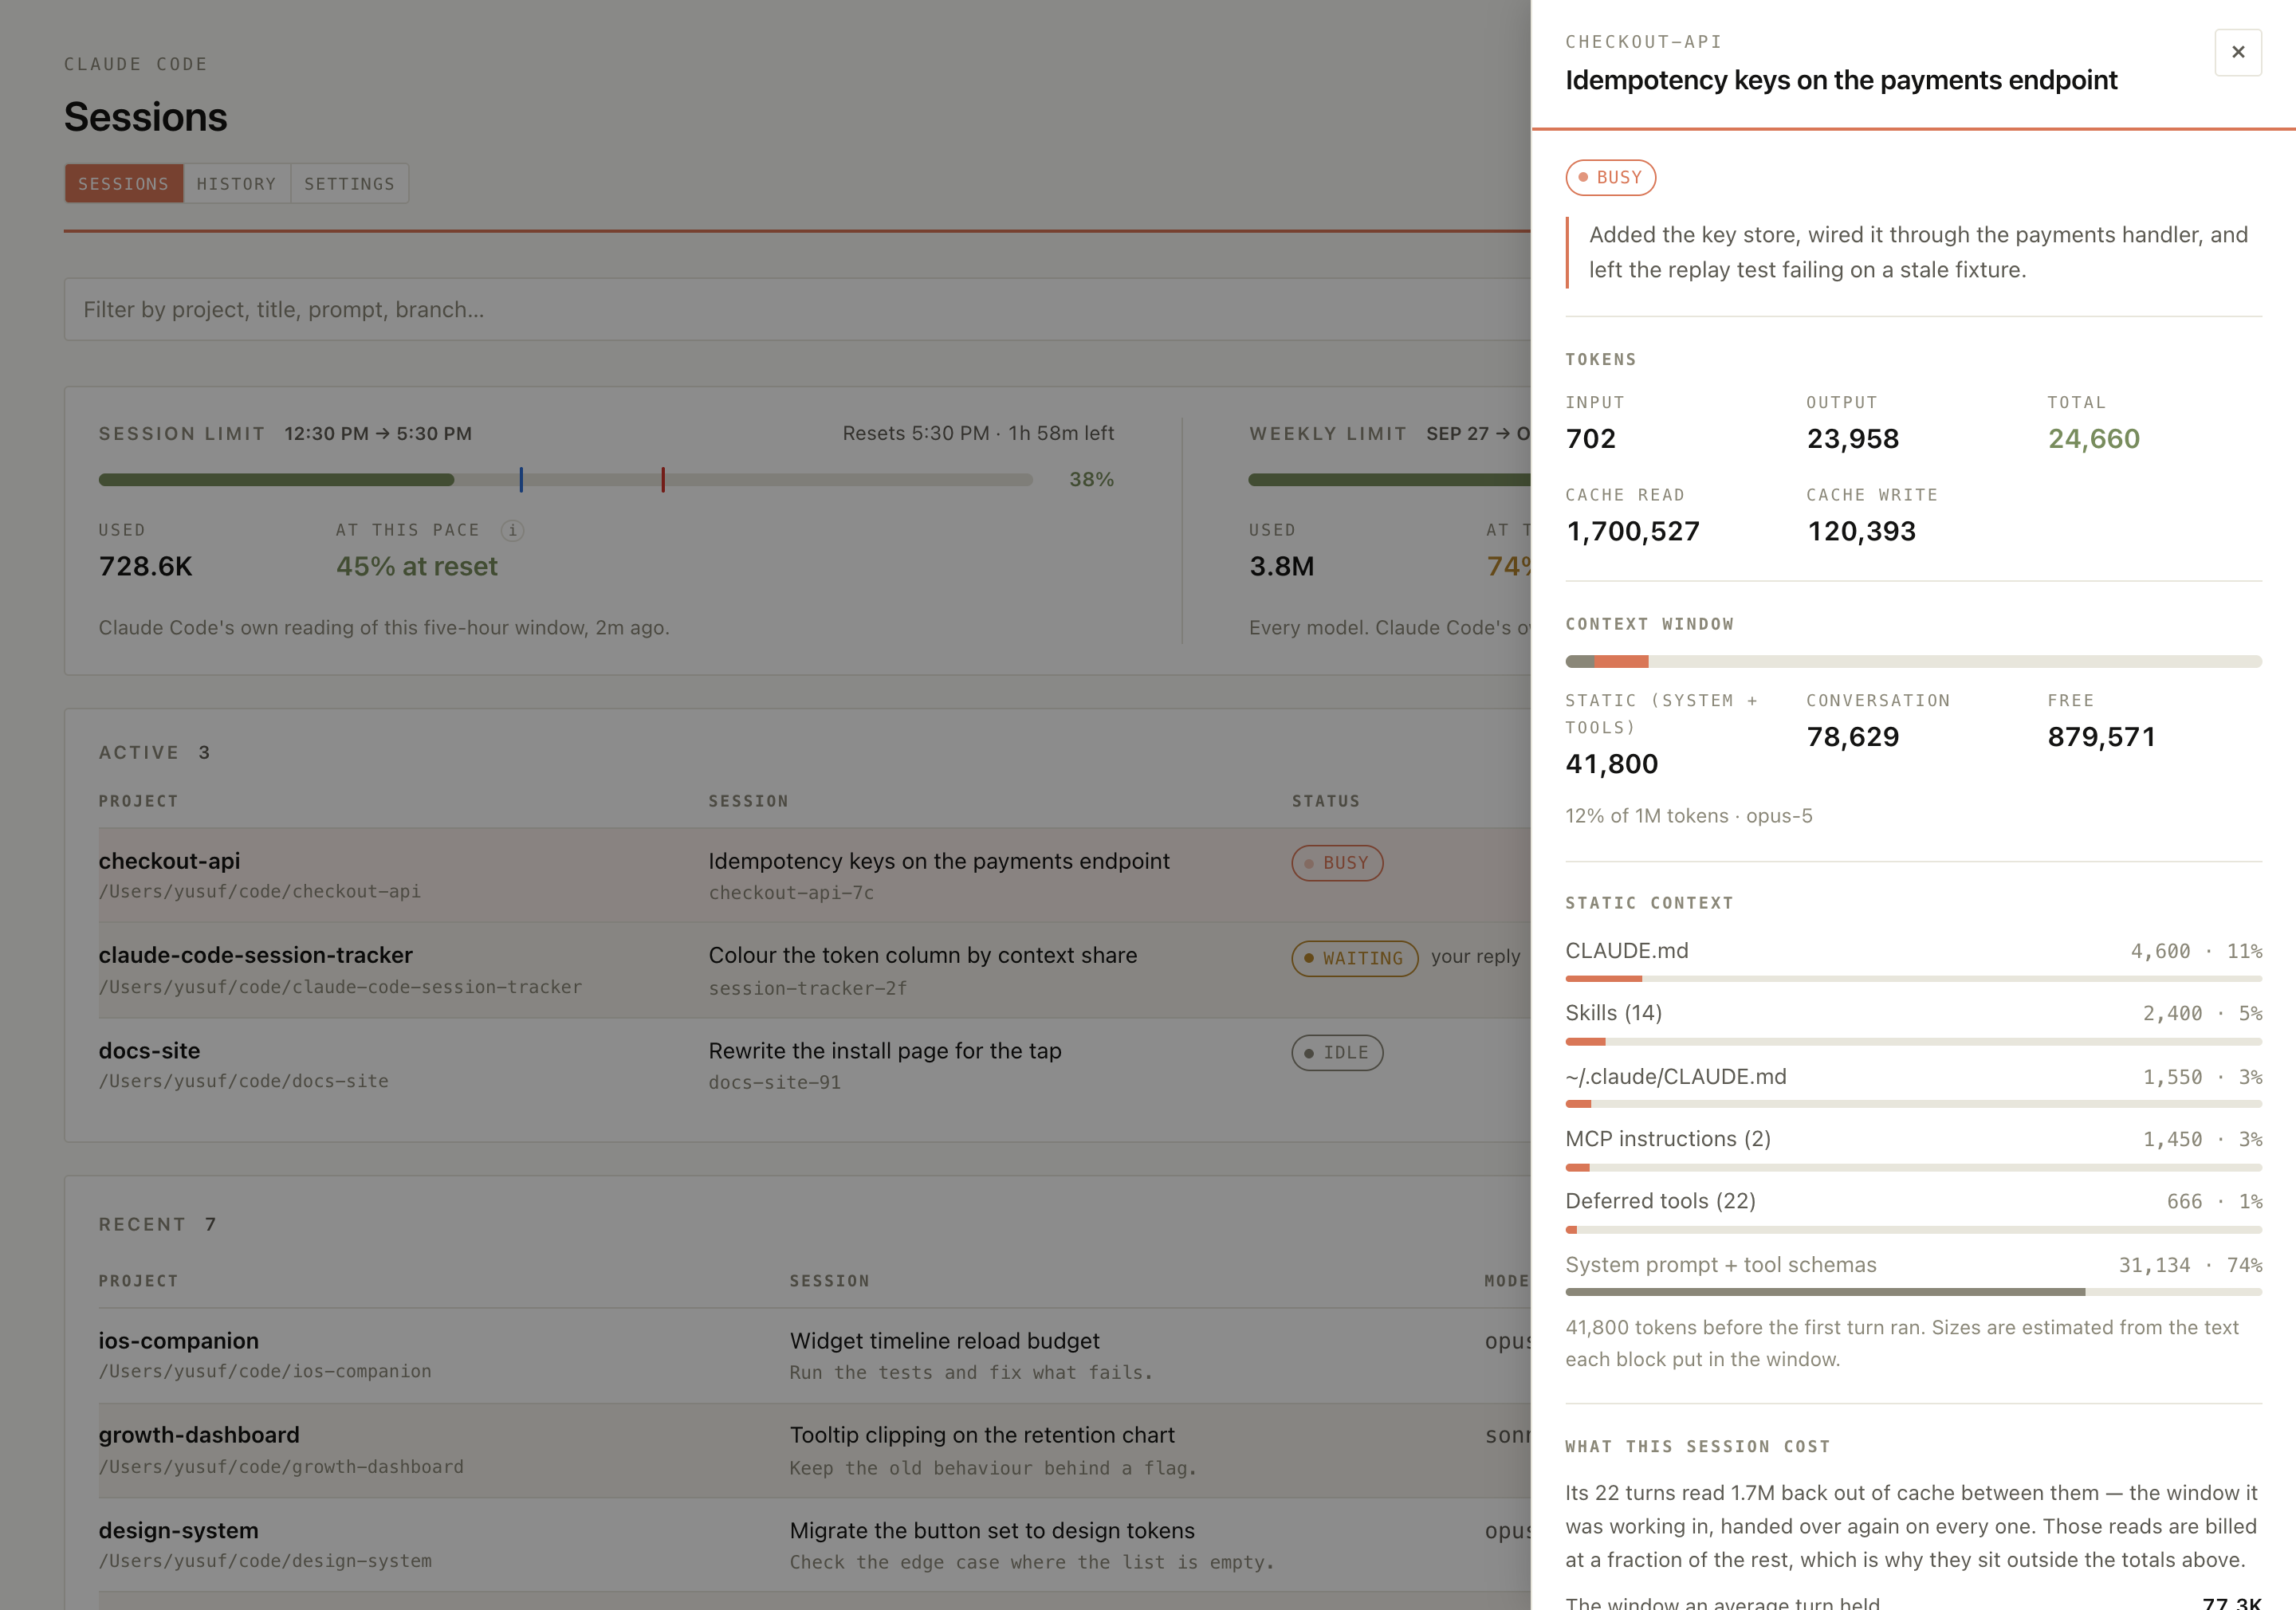
image for X or LinkedIn — see Where the tokens went. - A detail panel per session: message and tool-call counts, token totals,
elapsed and working time, subagent count, a copyableclaude --resume <id>,
and a button that shows the transcript in your file manager. - What the static context went on — which
CLAUDE.md, the skill listing, the
agent listing, the MCP instructions — so the standing cost of every turn is
itemised rather than a single number you cannot act on. - Start at login on macOS and Windows with
autostart on— see
Start it at login. - A menu bar switch and a widget on macOS, installed with
menubar install—
see Menu bar and widget. --jsonfor scripting, and an HTTP API if you would rather build your own.- No dependencies, no install scripts, no writes to your Claude directory. The
tracker's one network call is Claude Code's own usage endpoint atapi.anthropic.com, asked every five minutes with the token Claude Code is signed
in with, so the limit cards show the same percentages as/usage.--offline
turns it off. Nothing else is downloaded unless you ask for the menu bar app.
Click a row and the panel opens beside it:
Requirements
Node 20 or newer, and Claude Code having run at least once on this machine.
macOS, Linux, and Windows are all covered by CI. Nothing else is needed —
if ~/.claude does not exist yet, the page says so and fills in the moment
your first session starts.
Run it with any package manager
npx      claude-code-session-tracker   # npm
pnpm dlx claude-code-session-tracker   # pnpm
yarn dlx claude-code-session-tracker   # yarn
bunx     claude-code-session-tracker   # bun
The package has no runtime dependencies and no install scripts, so every
runner behaves the same.
Or install it
brew install meyusufdemirci/tap/claude-code-session-tracker
claude-code-session-tracker
The formula installs the same npm tarball the commands above download, so the
two are the same program — it just lives on your PATH and updates withbrew upgrade instead of being fetched each time. Homebrew's own node comes
with it, which is why this is the one route that does not need Node already
installed.
Elsewhere, npm i -g claude-code-session-tracker (or the pnpm add -g /bun add -g equivalent) does the same job.
Start it at login
claude-code-session-tracker autostart on
On macOS and Windows this adds the tracker to your login items, so every time
you log in it starts and opens the page. It starts it right away too. No admin
rights are needed, and autostart off takes it out again; autostart status
says which way it is set.
What on adds |
Where you see it | Log | |
|---|---|---|---|
| macOS | A LaunchAgent at ~/Library/LaunchAgents/com.meyusufdemirci.claude-code-session-tracker.plist, which starts a script named Claude Code Session Tracker so that is the name Login Items shows |
System Settings → General → Login Items | ~/Library/Logs/claude-code-session-tracker.log |
| Windows | A Claude Code Session Tracker value under HKCU\Software\Microsoft\Windows\CurrentVersion\Run |
Settings → Apps → Startup | %LOCALAPPDATA%\claude-code-session-tracker\tracker.log |
It needs a copy that stays on disk — Homebrew or npm install -g — since npx
and the other one-off runners unpack into a cache they are free to clear. Run
from one of those, on says so and changes nothing.
Menu bar and widget (macOS)
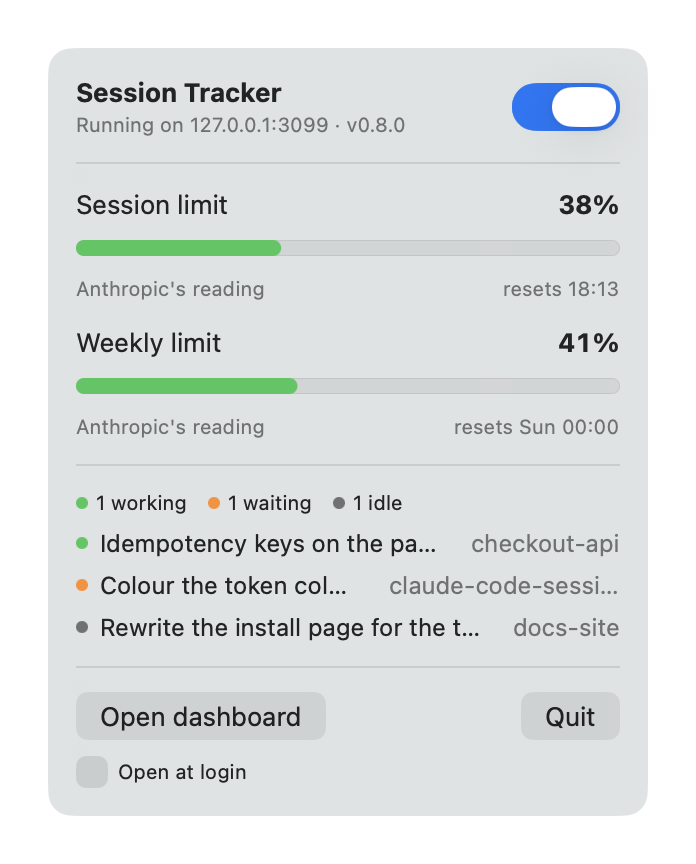
A small native app puts the tracker in the menu bar. Its switch turns the tracker
on and off, and the panel under it shows both limits, when they reset, and the
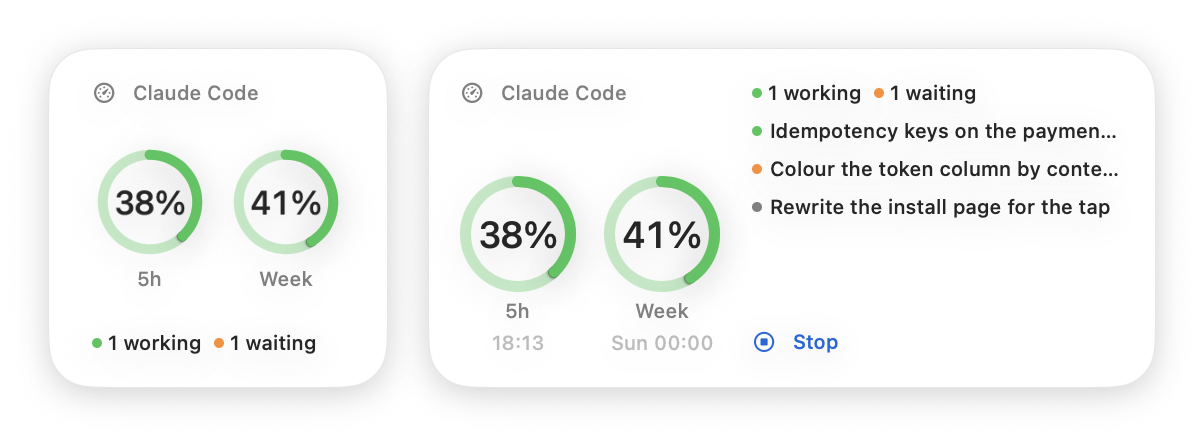
sessions that are running. A widget for the desktop and Notification Center shows
the same two limits as rings.
npx claude-code-session-tracker menubar install
menubar install downloads the app, puts it in /Applications — or in~/Applications where that is not yours to write to — and opens it. It needs
macOS 14 or later. Run it again after updating the tracker to bring the app to the
same version; menubar status says when the two differ, and menubar uninstall
removes it.
- What it downloads is the app built by the same release as the copy of the
tracker you ran, from that version's
GitHub release
and no other. The package carries that zip's SHA-256, and anything that does not
match is refused before it is unpacked. - It is not signed with an Apple Developer ID, only to run locally. macOS asks
about an unsigned app when a browser has marked it as downloaded, and this is
fetched by the command you ran, so it opens without a prompt. macOS may ask about
the login item or the widget again after an update, since each build is signed
afresh. To run only what you compiled, build it yourself — see
Development. - The tracker still has to be installed, since the app runs it rather than
containing it. A copy fetched bynpxis gone when its cache is cleared, so
after annpxinstall the panel offers Install and start, described below. - On starts
claude-code-session-tracker --no-open, found through your login
shell'sPATH, and its output goes to the same log asautostart. Whereautostart onhas been run, it starts that copy instead, so the tracker that
comes back is the one that was running. When the
tracker is not installed, the panel says so and offers Install and start,
which runsbrew install meyusufdemirci/tap/claude-code-session-tracker— ornpm install -g claude-code-session-trackerwhere there is no Homebrew — and
turns it on once that is done. - Off stops whichever copy is answering — one the app started, one
autostart
started, or one left running in a terminal. - The switch is remembered: quit the app with the tracker on, and it turns it back
on the next time it opens. Left off, it stays off: the copyautostartbrings
up at login is stopped again when the app opens. Open at login in the panel
adds the app to Login Items. - The widget reads the tracker on loopback every five minutes. It cannot start a
process from its sandbox, so clicking it while the tracker is off asks the app to
start it; clicking it while it runs opens the page.
Options
| Command | Description |
|---|---|
autostart on |
Start at login and open the page, and start it now (macOS and Windows) |
autostart off |
Stop starting at login, and stop the copy it started |
autostart status |
Say whether it starts at login |
menubar install |
Download the macOS menu bar app and widget for this version, install and open them; run again to update |
menubar uninstall |
Quit the app and remove it |
menubar status |
Say whether the app is installed, and whether it is the tracker's version |
| Flag | Description |
|---|---|
-p, --port <number> |
Port to listen on, stepping forward up to 20 times if taken (default 3099) |
--host <address> |
Address to bind (default 127.0.0.1 — see the warning below) |
--no-open |
Do not open a browser |
--json |
Print the session list as JSON and exit |
-n, --limit <number> |
How many sessions to list (default 50; running ones are always shown) |
--claude-dir <path> |
Override the Claude data directory |
--offline |
Never ask Anthropic's server for the usage limits; the cards fall back to Claude Code's cached readout or an estimate |
-h, --help |
Show usage |
-v, --version |
Show the version |
Scripting
--json prints the same payload the page uses, then exits:
npx claude-code-session-tracker --json | jq '.sessions[] | .project.name'
{
  "sessions": [
    {
      "id": "279ed6ae-49fd-4234-a74e-145f5535341c",
      "source": "claude-code",
      "status": "busy",              // busy · waiting · idle · ended
      "project": { "name": "…", "path": "…", "slug": "…", "gitBranch": "main" },
      "title": "Disable dependabot", // Claude's own title, when it wrote one
      "firstPrompt": "…",
      "lastPrompt": "…",
      "model": "claude-sonnet-5",
      "version": "2.1.235",          // the Claude Code that wrote the session
      "startedAt": 1787142489923,
      "lastActiveAt": 1787142700231,
      "transcriptPath": "…/279ed6ae….jsonl",
      "sizeBytes": 136133,
      "live": { "pid": 4129, "kind": "interactive", "entrypoint": "cli" }
    }
  ],
  "sources": [ /* one entry per adapter, with whether it found its data */ ],
  "total": 794,
  "generatedAt": 1787142701002
}
Only running sessions carry live. Everything else is optional — a field that
was not in the transcript is absent rather than null.
HTTP API
The server is the same one the page talks to, so anything the page can do you
can do with curl:
| Route | Returns |
|---|---|
GET /api/sessions?limit=N |
The list above. limit matches --limit, and running sessions are always included |
GET /api/sessions?since=&until= |
The same list, narrowed to transcripts last written in that window. Epoch milliseconds; since is inclusive, until exclusive; either may be left off. Running sessions ignore it |
GET /api/sessions?sort= |
recent (the default), tokens-desc, or tokens-asc. Ranks the finished sessions across the whole window, not just the page. An unknown value falls back to recent |
GET /api/sessions/:id |
One session with counts, tokens, models, activeMs, awaySummary, and notes |
GET /api/limits |
Both limits, as session (five hours) and weekly (seven days). Each carries windowMs, clock, historyDays, the current window, the recent stretch the forecast is drawn from, the server's percentage as reported when there is one for the window in progress (its source says whether this tool fetched it — server — or read Claude Code's cached one — claude-code), the heaviest closed window as reference, and lastLimited if Claude ever cut one short. 404 when no source can measure them |
GET /api/usage/history?since=&until=&project=&perProject= |
Where the tokens went: a sparse half-hour series, every project in the range with its name and directory, and every model, each ranked by billed tokens. Epoch milliseconds again; since defaults to 30 days back, until to now, and a span wider than a year and a week (371 days) is narrowed — range in the reply is always the one actually read. project takes a slug from the same reply and narrows the series and the models to it, never the project list. perProject=1 adds each covered project's own half-hour series as buckets on its entry — what the export uses to split a day by project; left off, the payload carries only the merged series. 404 when no source can measure it |
GET /api/health |
ok, the version, the Node it runs on, the resolved Claude directory, and per-source status |
POST /api/sessions/:id/reveal |
Shows that transcript in your file manager. Requires a loopback Origin |
Every route refuses a request whose Host is not loopback. reveal is the only
one that acts rather than reports, so it is a POST, it checks Origin as well,
and the path it opens comes from our own lookup — never from the request.
The limits
Claude Code bills against two clocks: a five-hour window it calls a session
limit, and a seven-day one it calls a weekly limit. Neither quota is written to
disk — both are enforced server-side and the only trace either leaves in a
transcript is the turn it refused. So the share of each limit is asked of the
server, the same way /usage asks it, and everything else on the cards — the
windows, the tokens, the pace — is measured from the transcripts:
The five-hour window is chained from the turn timestamps. It opens on your
first billed turn after the last one emptied and runs five hours from there,
floored to the half hour, which is where Claude puts it: on the one refusal
this was calibrated against, a first turn at 08:37 reset at 13:30. When Claude
has refused a turn, its ownresetsAtis used instead of ours.The week cannot be chained the same way — nobody goes seven quiet days, so
there is no gap to read a week's edge off. Claude writes its weekly clock down
in exactly one place: a weekly refusal. With one of those in your history the
weeks are pinned to it and stepped forward in sevens; without one the card
counts the seven days behind you and says so rather than implying a reset
nobody can read.Used is input, output and newly-cached tokens across every project — and
every subagent, whose turns bill to the window that spawned them. Cache reads
are shown apart: they cost a fraction as much and outweigh the rest roughly
fifty to one, so folding them in would produce a number that tracks how long
your conversations are rather than how much work you asked for.At this pace is the forecast: if you keep working the way you are working
now, when this window runs out — or, if it will not, where it stands when it
resets. The rate is the recent stretch's — the last hour of the five-hour window,
the last day of the week — not the window's average, since a burst of agents two
hours into a quiet window barely moves the average and is exactly what the
forecast is for. It waits until that stretch covers a twentieth of the window (a
quarter of an hour, or eight hours of the week), since one heavy turn two minutes
in projects sixty times itself, and it stays away from a rolling week entirely:
that one ends at the instant it is measured, leaving nothing to forecast into.Two ticks on the bar. The thin one is the clock — how much of the window's
time has gone — and the other is the forecast, where the fill reaches by the
reset, pinned at the end when the window runs out first. Hover or focus either for
the figures behind it.The colour is read against the clock tick, not against the limit alone: half
the limit spent a tenth of the way into the window is trouble, and nine tenths
spent with an hour of five to go is not. A fill past the tick is red, closing on
it amber, well behind it green. A rolling week has no clock tick, so its bar falls
back to the limit's own scale.The share — the bar, and the percentage printed at the end of it — is
Anthropic's reading of that limit, from the endpoint Claude Code's own/usage
reads, so it is the same number/usageshows you. It is asked with the token
Claude Code is already signed in with — from the macOS Keychain, or~/.claude/.credentials.jsonelsewhere — read and never written: an expired token
is skipped rather than refreshed, because refreshing it here would sign Claude Code
out. It is asked at most every five minutes, a failed request keeps the last good
answer, and the note under the bar says whose reading it is and how long ago it
was taken.With
--offline, or when the server cannot be asked, the bar uses the readout
Claude Code caches in~/.claude.jsoninstead — the same figure, but only as fresh
as Claude Code's own last request for it.Where there is neither — a machine whose account file has none, a window whose
reading has already reset, or a reading left more than a fifth of its window
behind the work, which is an hour for the five-hour card and a day and a half for
the weekly one — the bar falls back to a yardstick: the heaviest window that has
already closed, the last 7 days for the five-hour card and the last 28 for the
weekly one, never the one in progress, since a window is always 100% of itself.
The note says which of the two you are looking at. Past the end the bar reads
full, having nowhere further to go, while the percentage keeps counting.
If nothing has run in a window there is none, and the card says so rather than
showing an empty bar.
Getting told
A desktop notification when a window's forecast reaches the top of the bar before
the window resets — the real limit where there is a reading of it, and the heaviest
window that has already closed where there is not. It says when, and how long before
the reset that is: At the last hour's pace you'll hit the limit at 15:40, 1h 20m
before it resets. The card says the same thing in
colour; this is the same fact addressed to whoever is not looking at the card, which
is the usual case for a tab parked behind an editor.
The first time the dashboard has a limit to show you and has never asked, a sheet
comes up along the bottom offering these. Not now means not now: it goes away
and comes back once, a fortnight later, if you still have not turned either switch
on. A second Not now is the last of it. Opening the settings page from it closes
the offer for good, whatever you decide once you are there — and so does turning a
switch on or off yourself, since that is you having decided.
Settings has a switch for each limit — the five-hour window and the week —
because the two answer different questions and plenty of people want one and not
the other. Both start off. Turning either one on is what asks the browser for
permission; nothing asks on load. If you have already refused notifications for
this page the switches come back off and the page says so — that one is a
setting in your browser's address bar, not here. Your answer is kept underneath
either way, so unblocking the page is enough to get them back.
Beside each switch is how often that limit may interrupt you. An hour for the
five-hour window and four hours for the week to begin with — each about a fifth
of its own span, which is roughly where a second warning is news rather than a
repeat. Session offers 30 minutes to 5 hours, the week 1 hour to a day; the
quietest choice on either is one warning per window.
What they will and will not send:
- One, then quiet. A window over its yardstick stays over it for hours, and it
says so once. Nothing else is sent until the interval is up, including if the
rate settles back under and crosses again — that is the same interruption
arriving twice. - Again once the interval is up, if the window is still headed past. The news
by then is that it did not settle. - Nothing for a rolling week. A week with no reported reset ends at the
instant it is measured, so there is no remainder to forecast into — the same
silence the card'sAt this pacecell keeps. - Only while a dashboard tab is open. Nothing runs in the background: this
is the page noticing, not a service. The tab can be buried, but it has to be
there.
The switches, the intervals and whether that first-run sheet has been answered are
remembered in the browser, per browser, like the theme.
Where the tokens went
The limit cards say how full the window in progress is. The history page says what
filled it. It reads the same sweep — the transcripts are read once and counted for
both — so opening it beside a running dashboard costs a stat per file.
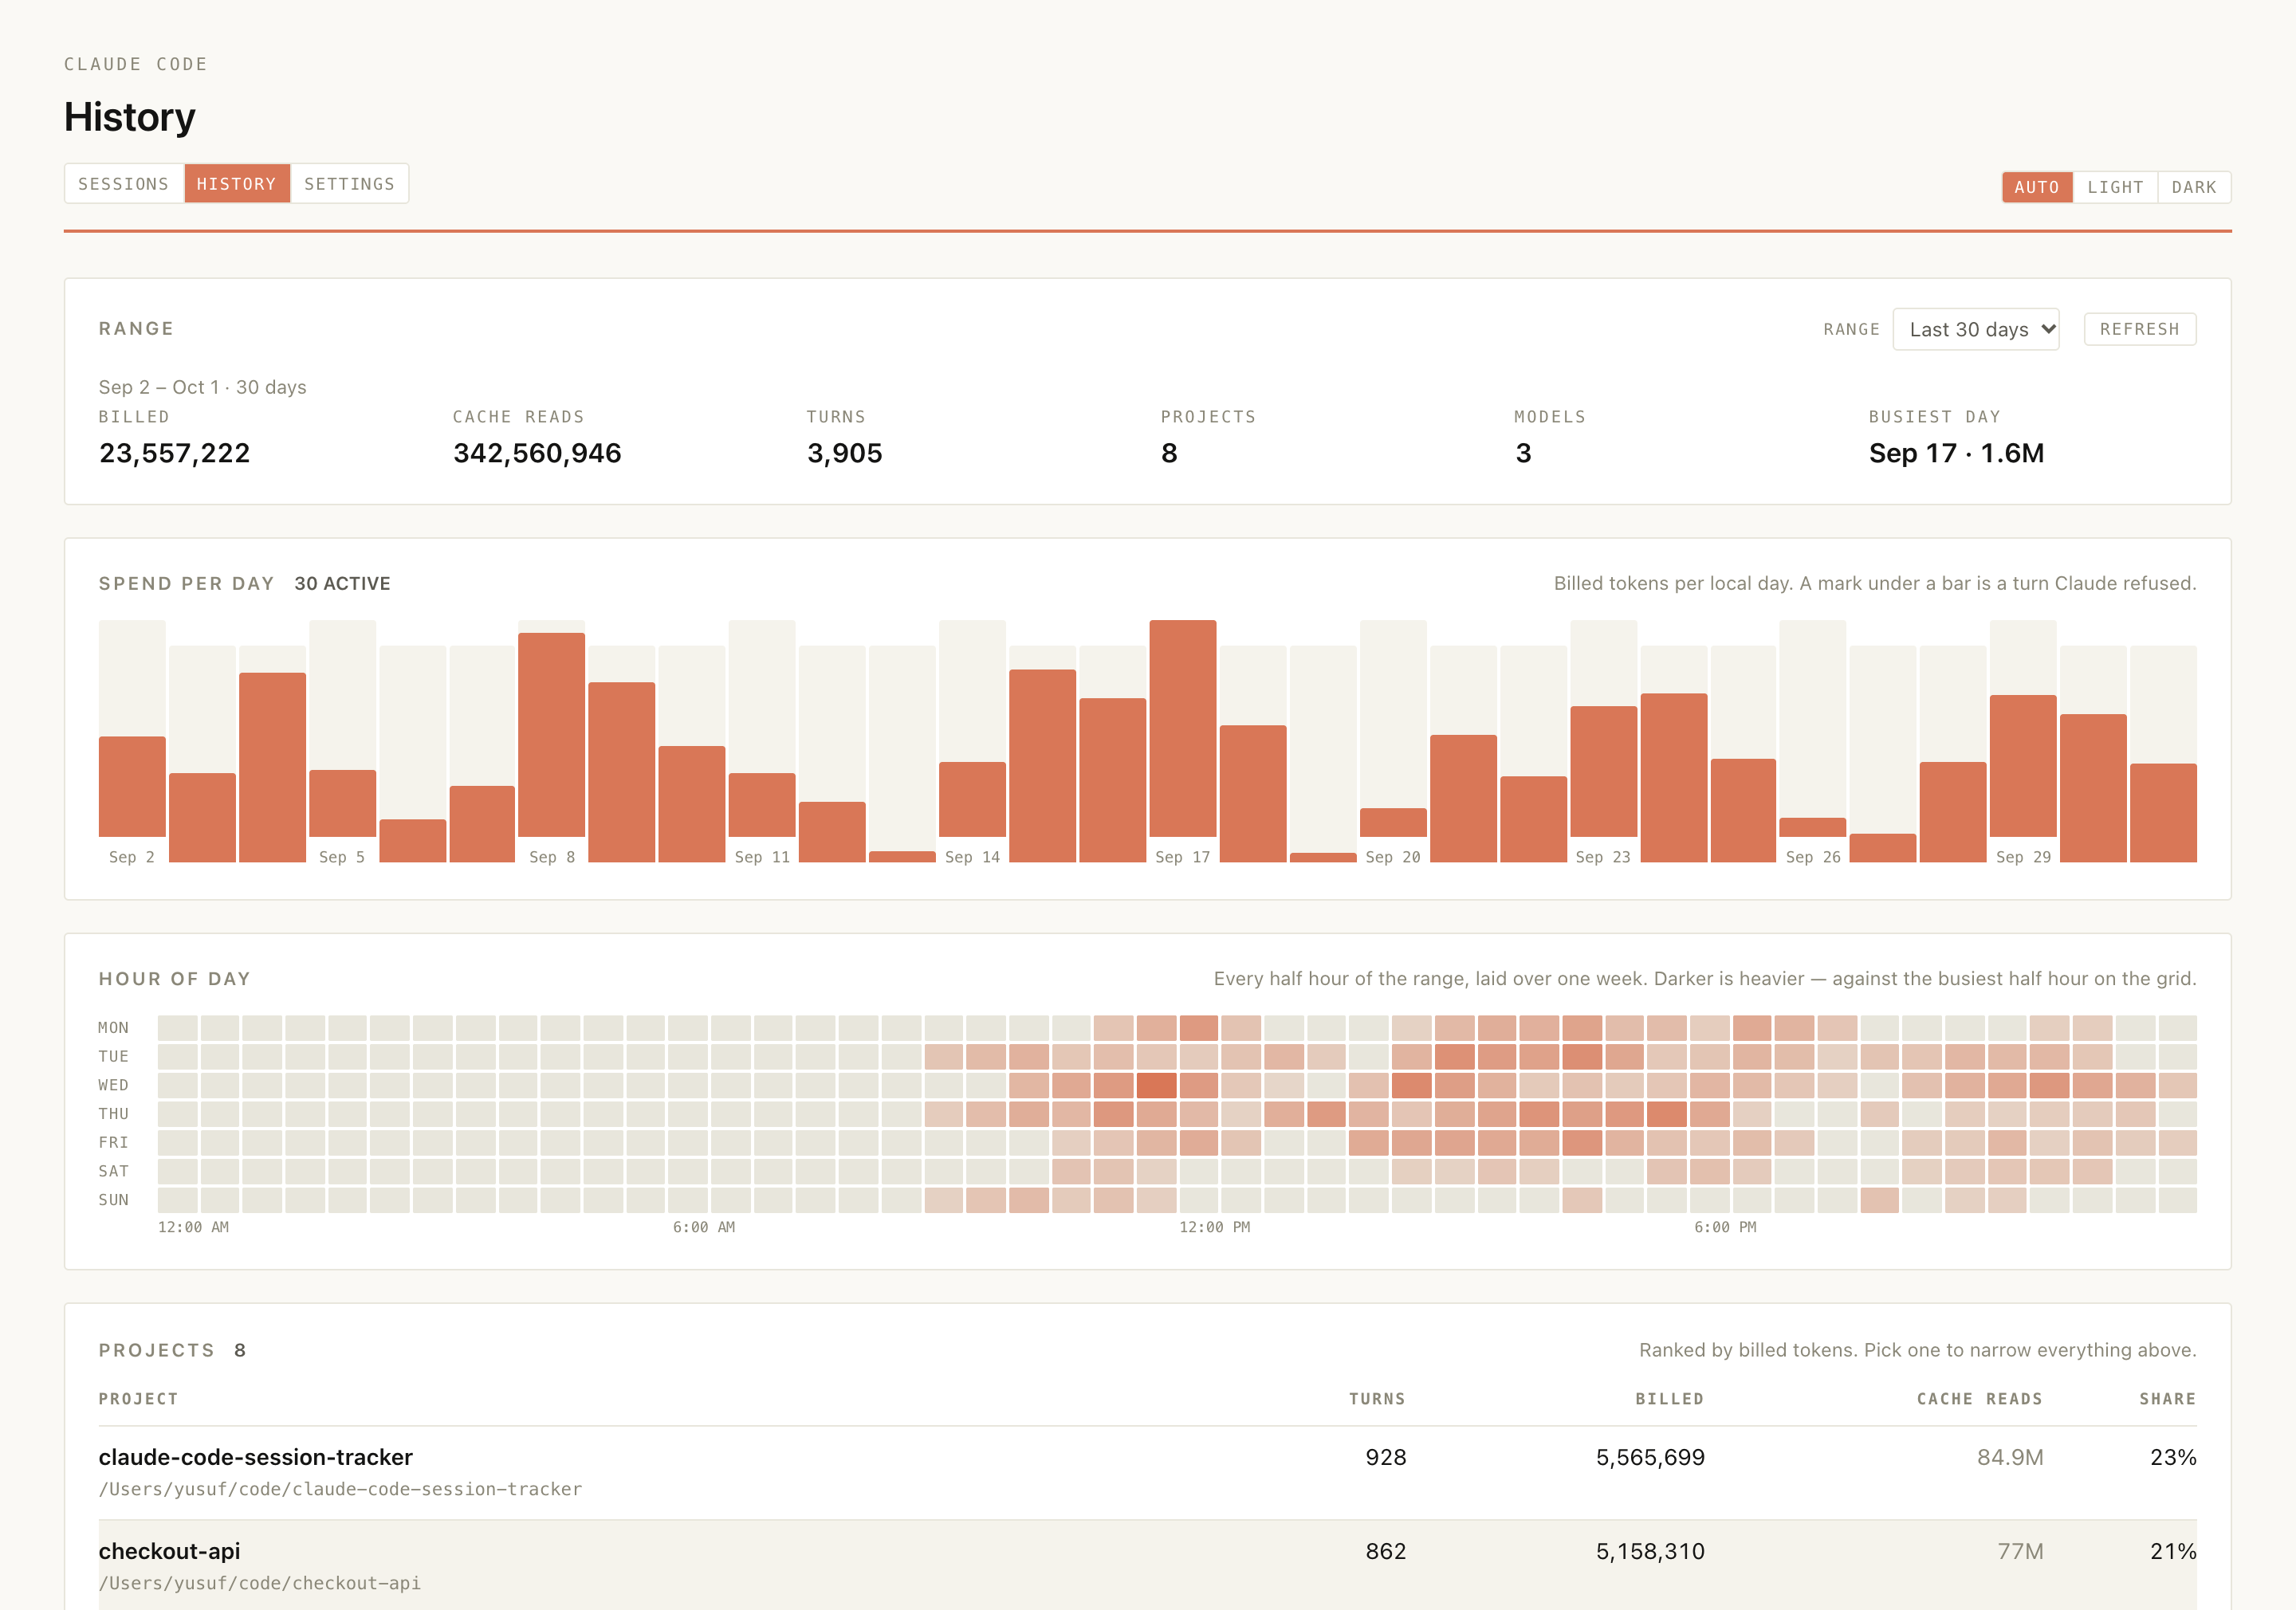
Five reads, in the order the question gets asked:
- Spend per day, a bar for every local day in the range — including the quiet
ones, because a chart that closed the gaps would draw a busy fortnight and a
scattered month identically. A mark under a bar is a day Claude refused a turn.
Day / Week / Month beside it folds the bars into Monday-to-Sunday weeks or
calendar months, cut to the range at either end, for a range too long to read
a day at a time. - Hour of day, every half hour of the range folded onto one week. This is the
reading the daily bars cannot give: whether the five-hour window keeps being
opened at nine in the morning or at eleven at night. - Year, a calendar year as a grid of days, Monday to Sunday, shaded by billed
tokens in four steps cut at the quartiles of the days that billed anything — so
the shading tracks your own year rather than a fixed scale. It reads a calendar
year whatever the range above says, follows the project picked, and steps back
a year at a time with ‹ ›, as far as 2025. Days still to come are drawn
empty, so the current year reads as a whole year. - Projects, ranked by billed tokens, with cache reads shown apart. Where two
checkouts share a directory name the parent goes in front of it, and the full
path is printed under each. Pick one and the summary, the drawings and the model
list narrow to it; pick it again to let go. - Models, the same ranking, one row each — where an Opus habit shows up.
Range, in the masthead because it governs every section but the year, is 7, 30 or
90 days, or a pair of dates of your own. It goes into the query string alongside the
project, the bar grouping and a past year — ?range=7d&group=week&year=2025&project=…
— so a reload comes back to the same view, a bookmark keeps it, and Back walks the
ranges, the years and the selections. Only what differs from the default is written,
so a plain /history stays plain. Ranges are whole local days, which is why the day
count and the number of bars always agree. A custom range left open at the start
reaches back ninety days; a year and a week is the ceiling, and asking for more reads
that much and says that it narrowed.
Nothing on this page polls — a month of history does not move fast enough to be worth
re-reading every two seconds — so Refresh is how you ask for another read.
Export
Export beside Refresh writes a report — built in the page, with no library and
nothing sent anywhere. A dialog asks first, and says back what the file will hold
before it is written:
- Dates — as on the page, the last 7, 30 or 90 days, or a pair of your own.
- Rows — daily, weekly or monthly; it starts as the bars on the page do.
- Projects — all of them, or one, from the projects that billed in those dates.
- Format — a PDF, or an
.xlsxthat Excel, Numbers and Google Sheets open as
their own.
Both formats say the same numbers, because the report is added up once and each
writer only lays it out: the totals (billed, input, output, cache writes, cache reads,
turns, projects and active days), every project ranked by billed tokens with its
share when there is more than one, then each project's rows — one for every day, week
or month that billed something. The PDF is A4, one table per project with a total row
and a page count in the footer. The spreadsheet has two sheets, Summary and the
rows, with real numbers and dates, a frozen header and filters, so it sorts and pivots
like anything else. Preview opens the PDF in a new tab and leaves the dialog open.
Files are named for what is in them:claude-code-usage_<project or all-projects>[_weekly|_monthly]_<from>_<to>.pdf.
Share your year
Share on the year grid draws it as a picture — in the theme on screen, with the
year, the active days and the tokens billed — and offers Share on X and Share on
LinkedIn. Neither network lets a link attach an image, so a click copies the
picture to the clipboard, saves it to your downloads as claude-code-<year>.png, and
opens a new post with a caption filled in (My 2026 with Claude Code: 214 active days
and 1.2B tokens billed.); paste the image in with ⌘V or Ctrl+V. Nothing is posted
for you, and nothing leaves the page until you press the network's own Post.
Two things it is honest about rather than quiet about: a project whose directory has
since been moved or deleted cannot be resolved from the folder name Claude Code
stores, so it shows the plainest reading of that name and may be wrong about the
path; and the split by model covers every turn that named one, which on every
transcript seen so far is all of them.
On the page
Click any row for the full read. Everything has a key:
| Key | Does |
|---|---|
| / | Jump to the filter |
| ↑ ↓ | Move between sessions, across both tables |
| Home End | First and last session |
| ↵ | Open the selected session |
| Esc | Close the panel, or clear the filter |
The list refreshes every 2 seconds — the masthead shows the time of the last
read, to the second — and says so when the server goes away. The detail panel
slides in beside the list and back out when you close it. The
page takes the same limit from the query string, so ?limit=200 and--limit 200 show the same depth of history.
Range and Sort above the Recent table narrow it to a stretch of history and
order it by recency or by token spend. Both go into the query string alongside the
limit — ?range=7d&sort=tokens-desc, or ?range=custom&from=2026-08-01&to=2026-08-14
— so a reload comes back to the same view, and a bookmark keeps it. Ranges are whole
local days, so "today" means since midnight rather than the last 24 hours. Reset
appears beside them once either is off its default and puts both back; it leaves the
text filter and how far you have paged alone. Neither control touches the Active
table: a running session is shown whatever window is on screen.
The theme follows your OS by default; Auto / Light / Dark in the top right
overrides it, and the choice is remembered. Settings is the third tab beside
Sessions and History — see Getting told.
What it reads
Everything comes from what Claude Code already writes to disk:
| Path | Used for |
|---|---|
~/.claude/sessions/<pid>.json |
Running sessions and their live status |
<session cwd>/.git/HEAD |
The branch a running session is on |
~/.claude/projects/**/*.jsonl |
Session history — titles, prompts, models, branch |
~/.claude/projects/*/*/subagents/agent-*.jsonl |
Subagent turns, for the limit windows they bill to |
~/.claude.json |
The usage readout Claude Code caches — how full each limit is, and when it resets |
Keychain item Claude Code-credentials (macOS), or ~/.claude/.credentials.json |
The token Claude Code is signed in with, to ask the server for the same readout. Read, never refreshed or written. Not read with --offline |
Set CLAUDE_CONFIG_DIR (or pass --claude-dir) if your Claude data lives
somewhere other than ~/.claude. Some Claude Code versions accept a
comma-separated list there; the first entry wins.
Privacy
The tool never writes to the Claude directory, binds to loopback only,
and rejects requests that are not addressed to a loopback host. Its one outbound
call is the usage endpoint Claude Code's own /usage reads, atapi.anthropic.com, sent only Claude Code's own token and at most every five
minutes; --offline turns it off and the tool then makes no network calls at all.
There is no telemetry and no update check. The one other download is the one you
ask for by name: menubar install fetches the macOS app from this project's GitHub
releases, once, and checks it against the checksum the package was published with. The history page's export is written in
the browser and saved to your disk, and Share only opens X's or LinkedIn's own
compose page when you click it — the image goes by your clipboard, never by us.
Transcripts hold your prompts, your paths, and sometimes your secrets. That is why
the default bind is 127.0.0.1 and why every request has to be addressed to a
loopback host — a page on any website can otherwise point a browser at yourlocalhost. Passing --host to something else drops that guard, so the CLI says
so, loudly, before it starts.
For a machine you are SSH'd into, forward the port instead of opening the bind:
ssh -L 3099:127.0.0.1:3099 you@the-machine
Troubleshooting
Nothing is listed. Check curl -s 127.0.0.1:3099/api/health — it prints the
directory that was searched. If that is not where your transcripts are, setCLAUDE_CONFIG_DIR or pass --claude-dir.
A session I just started is missing. The list refreshes every 2 seconds and
a session appears once Claude Code has written its first record.
A session shows as idle while it is clearly working. Status comes from what
Claude Code itself records in ~/.claude/sessions/. If that file is stale, the
row is honest about the file rather than guessing.
The port is taken. It steps forward automatically, up to 20 times; the
address it actually bound is the one printed. --port picks a different start.
An old session has no title. Titles are Claude's own, and older transcripts
predate them. The derived name and the first prompt stand in.
Programmatic use
import { createConfig, SessionRegistry } from 'claude-code-session-tracker/core';

const registry = new SessionRegistry(createConfig());
const { sessions } = await registry.list({ limit: 20 });
const detail = await registry.detail(sessions[0].id);
createConfig() takes { claudeDir, host, port } overrides. registry.detail()
resolves to null for an unknown id rather than throwing.
Development
Requires Node 22.18+ to run from source, because dev and test load .ts
files directly and let Node strip the types. The published package is compiled
JavaScript and runs on Node 20+.
pnpm install
pnpm dev                       # run from source, watch mode
pnpm test                      # unit tests
pnpm test:watch                # re-run on change
pnpm test:coverage             # unit tests + a coverage report
pnpm build                     # tsc + copy web assets
pnpm typecheck                 # src and test
npm pack                       # -> claude-code-session-tracker-<version>.tgz
pnpm smoke ./claude-code-session-tracker-<version>.tgz pnpm
test/ mirrors src/ and runs on node --test with no runner, no config, and
no dependency — the same rule the package itself follows. Fixtures are real
files in a temp directory rather than a mocked fs, because what is worth
testing here are properties of real files: a multi-byte character cut by a chunk
boundary, a slug only the directory tree can disambiguate, a cache that turns on
mtime. test/helpers/records.ts holds the transcript shapes in one place, so
the day the .jsonl format changes, the failure is a named test rather than a
silent wrong number.
pnpm smoke installs the packed tarball into a temporary directory with the
package manager you name, then runs the installed binary against a fixture
transcript. It is what CI runs — Node 20/22/24 × npm/pnpm/yarn/bun on Linux,
plus npm on macOS and Windows — so a change that only works from source fails
before it ships.
Everything that parses a transcript lives in src/sources/claude-code/. TheSource interface in src/sources/source.ts is the seam a second tool
(Codex, Cursor) would plug into; src/core/ knows nothing about Claude Code.
The menu bar app lives in macos/ and is built with Xcode and
XcodeGen; the Xcode project is generated,
not checked in.
brew install xcodegen          # once; Xcode itself is needed too
macos/build.sh                 # -> macos/build/Claude Code Session Tracker.app
macos/build.sh install         # builds it, copies it to /Applications and opens it
It takes its version from package.json and is signed to run locally; setDEVELOPMENT_TEAM before build.sh to sign it with your own team. To have it run
a source checkout instead of the installed tracker:
defaults write com.meyusufdemirci.claude-code-session-tracker.app trackerCommand "node $PWD/src/cli.ts"
menubar install has two kinds of test. test/menubar.test.ts stands in forditto, open and the rest, so it runs on any machine and proves the order
things happen in. scripts/menubar-check.mjs is the other half, for a Mac: it
installs a zip you built with the real programs and checks the app starts, stays
up, and is replaced and removed cleanly. CI runs it on a macOS runner whenever the
app or the command changes.
ditto -c -k --keepParent "macos/build/Claude Code Session Tracker.app" app.zip
node scripts/menubar-check.mjs app.zip /tmp/Applications   # omit the folder to use /Applications
Releasing is a tag: npm version <patch|minor|major> then git push --follow-tags.
The release workflow builds the menu bar app first, writes its zip's checksum into
the package as dist/menubar.json, re-runs the checks, attaches the zip to a GitHub
release for the tag, publishes with npm provenance, and then moves the Homebrew tap
forward. The app goes up before npm does, so no published version ever points at an
app that is not there to download.
Two things follow from the checksum. A version that reached npm cannot be
re-released: the app never builds byte-identical twice, so a second run would
replace the zip that the published package vouches for, and the workflow stops
rather than do that. And a pre-release tag such as v0.10.0-rc.1 is the way to try
a release end to end — it publishes to npm under next instead of latest, is
marked as a pre-release on GitHub, and leaves the Homebrew tap alone.
pnpm formula prints the Homebrew formula for a published version, rendered from
the tarball on npm — Homebrew wants a sha256 of the exact file it will download
and npm only advertises a sha512, so the tarball is fetched and hashed rather than
described. Nothing .rb is committed here: the rendered formula lives inmeyusufdemirci/homebrew-tap,
pushed by .github/workflows/homebrew.yml once the version is on the registry and
once brew install, brew test and brew audit --strict have all passed on a
macOS runner. That workflow also runs on its own from the Actions tab, which is the
repair path when a release reaches npm but not the tap — an npm publish cannot be
taken back, so it must not require a second version to fix.
The push needs a HOMEBREW_TAP_TOKEN repository secret: a fine-grained PAT with
Contents: read and write on the tap repository, and nothing else.
pnpm formula                   # the formula for this package.json's version
pnpm formula --version latest  # for whatever npm currently serves
Project plan and phase breakdown: PLAN.md.
How it stays fast
Feature-complete for v1 — phases 0 through 4 of PLAN.md.
Running sessions come from ~/.claude/sessions/*.json. Those files outlive the
processes that write them, so each one is checked twice before it becomes an Active
row: process.kill(pid, 0), then the recorded start time against the real one, which
is what rules out a recycled PID.
Recent sessions come from the transcripts, which run to about a gigabyte on a
working machine. Listing them reads no file contents at all — one readdir per
project and a stat per file is enough to sort by recency. Only the sessions
actually shown are opened, and only their first 16 KB and last 64 KB, which is where
the title, the prompts, the model and the branch live. Results are memoised against
each file's size and mtime, so an untouched transcript is never read twice. Listing
all 794 transcripts on the development machine takes ~230 ms cold and ~75 ms warm.
Both the date range and the sort are settled from that same sweep where they can be.
A range is: stat already knows when each file was last written, so narrowing one
costs nothing and opens fewer files than not narrowing it. Ordering by tokens is not
— the totals are inside the transcripts — so it reads the whole range before it can
rank it, which is what makes "the ten biggest sessions this week" the ten biggest of
all 227 rather than of the ten on screen. That read is ~1.4 s cold for all 871
transcripts on the development machine, and free once memoised.
Opening a session streams its transcript once, line by line, capping how much of
any single line it holds — the largest record on the development machine is 9.4 MB,
and memory should be a property of the reader, not of the biggest tool output in the
session. A 37 MB transcript answers in 99 ms; the slowest of all 795 is 140 ms.
The history page adds no read of its own. It asks the same sweep for two things
the limit cards throw away — which project billed each half hour, and which model —
and the first costs nothing at all, since the sweep already walks projects/<slug>/…
and knew the slug it was dropping. A 7-day page is ~450 ms cold and ~15 ms warm on
the development machine, and the bucket cache is shared with the cards, so whichever
you open second is the cheap one. The year grid is a read of its own, a calendar
year at a time, so it is drawn after the rest of the page rather than holding it up;
past the 28 days the cards keep warm, the first read of a year is cold, and memoised
after that.
The limits are the one read that has to cover weeks rather than a page, because
the yardsticks they fall back on are the heaviest window of the last 7 days and the
heaviest week of the last 28. It bounds itself the same way: a transcript is append-only, so
one last written before the cutoff cannot hold a record after it, and mtime settles
that without opening anything. The files that survive are then reduced to half-hour
buckets and memoised per file version — the part that does not change — so only the
handful still being appended to are ever re-read. Both clocks are counted off that
one sweep: 901 files and 1 GB on the development machine come to ~1.3 s cold and ~7 ms
warm. The page asks every 15 seconds and ticks the countdown itself in between; the
server's percentage behind it is asked at most every five minutes, one request at a
time, with a five-second timeout.
Malformed lines are counted and skipped, never thrown on: the .jsonl format is
private and undocumented, and it will change under us. When it does, the detail
panel reports what it could not read in notes instead of pretending.
Contributing
Issues and pull requests are welcome. pnpm typecheck and a passingpnpm smoke against a fresh npm pack are what CI will ask of a change; both
run in well under a minute locally.
Since every number here was measured on one machine, a bug report that includes
your GET /api/health output and the notes from an affected session is worth
far more than a description.
License
MIT © Yusuf Demirci
Reviews (0)
Sign in to leave a review.
Leave a reviewNo results found