InsightTrack
Health Pass
- License — License: MIT
- Description — Repository has a description
- Active repo — Last push 0 days ago
- Community trust — 15 GitHub stars
Code Warn
- fs module — File system access in .github/workflows/ci.yml
Permissions Pass
- Permissions — No dangerous permissions requested
No AI report is available for this listing yet.
Self-hosted, privacy-first web analytics — the open-source alternative to Google Analytics
📊 InsightsTrack
Self-hosted, privacy-first web analytics — the open-source alternative to Google Analytics






Track visitors, pageviews, conversions, heatmaps, and Core Web Vitals — all on your own server.
No cookies, no consent banners, no data selling. Deploy in under 15 minutes.
Live Demo · Quick Start · Features · Deploy · Docs
What is InsightsTrack?
InsightsTrack is a complete, production-grade web analytics platform you run yourself. It gives you the depth of Google Analytics 4 — real-time visitors, traffic sources, funnels, heatmaps, Web Vitals — without sending a single byte of your visitors' data to a third party.
Why teams choose it:
- 🔒 Privacy by design — no cookies, no fingerprinting, pseudonymous visitor IDs, no stored IP addresses, and DNT/GPC opt-out honored in both the tracking script and the API. GDPR-friendly by design; compliance depends on your deployment.
- ⚡ Built for analytical reads — a dual-database design (PostgreSQL for writes, DuckDB for reads). In an isolated local test with ~101K events, representative 90-day analytics requests completed in well under 100 ms measured at the HTTP/API layer (which includes the application response cache). That is not a measurement of DuckDB execution time and is not a guarantee at larger datasets — see
docs/PERFORMANCE_BENCHMARK_AUDIT.md. - 🧩 Everything in one place — 17 analytics pages: dashboard, pages, realtime, funnels, heatmaps, engagement, performance, audience, acquisition, conversions, user flow, reporting studio, SQL editor, and more.
- 🔍 Search Visibility — joins live Google rankings & AI Overview citations with your own traffic to explain why a page moved. Jump to Search Visibility →
- 🤖 Pulse, your AI analyst — ask your data anything in plain English and get real charts, tables, and CSVs. Also works from Claude Desktop & Cursor over MCP. Jump to Pulse →
- 🪶 Single tag — one
<script>tag (~7.5 KB gzipped in the current build; exact size varies with build and transfer encoding), works with any site (WordPress, Next.js, Shopify, plain HTML…). - 👥 Team-ready — invite teammates, assign roles, build custom permission roles, and control which pages each member sees.
- 💸 Free forever — MIT licensed, self-hosted, no seat limits.
How it works
┌──────────────┐   POST /api/track/*    ┌──────────────────────────────┐
│  Your website│──────────────────────▶ │  Backend API (Express, :3001)│
│  (one tag)   │                        │                              │
└──────────────┘                        │  ┌──────────┐   ┌──────────┐ │
                                        │  │ Postgres │──▶│  DuckDB  │ │
┌──────────────┐  GET /api/analytics/*  │  │ (writes) │sync│ (reads)  │ │
│  Dashboard   │◀────────────────────── │  └──────────┘   └──────────┘ │
│  React SPA   │                        └──────────────────────────────┘
└──────────────┘
All writes (tracking events, auth, sites) go to PostgreSQL. A background sync streams them into DuckDB, an embedded columnar engine that powers every analytics read. Columnar storage suits the wide aggregations analytics dashboards issue; actual performance depends on workload, dataset, hardware, and query shape. A reproducible benchmark comparing both engines on identical generated data — including the methodology, its limitations, and the raw measurements — is in docs/PERFORMANCE_BENCHMARK.md. The dashboard never queries PostgreSQL directly.
Project layout. This repository uses a split-service layout:
apps/analytics-api/— the unified backend: Express API, PostgreSQL writes, DuckDB analytics reads, and the PostgreSQL→DuckDB sync worker (:3001).apps/dashboard-web/— the React dashboard (:4173).archive/analytics-api-legacy/— the legacy write/auth service, retained for reference only.appsv2/— a secondary working copy kept in sync withapps/.apps/is canonical; despite the name,appsv2/is not a newer version. Seeappsv2/README.md.
🎬 Live Demo
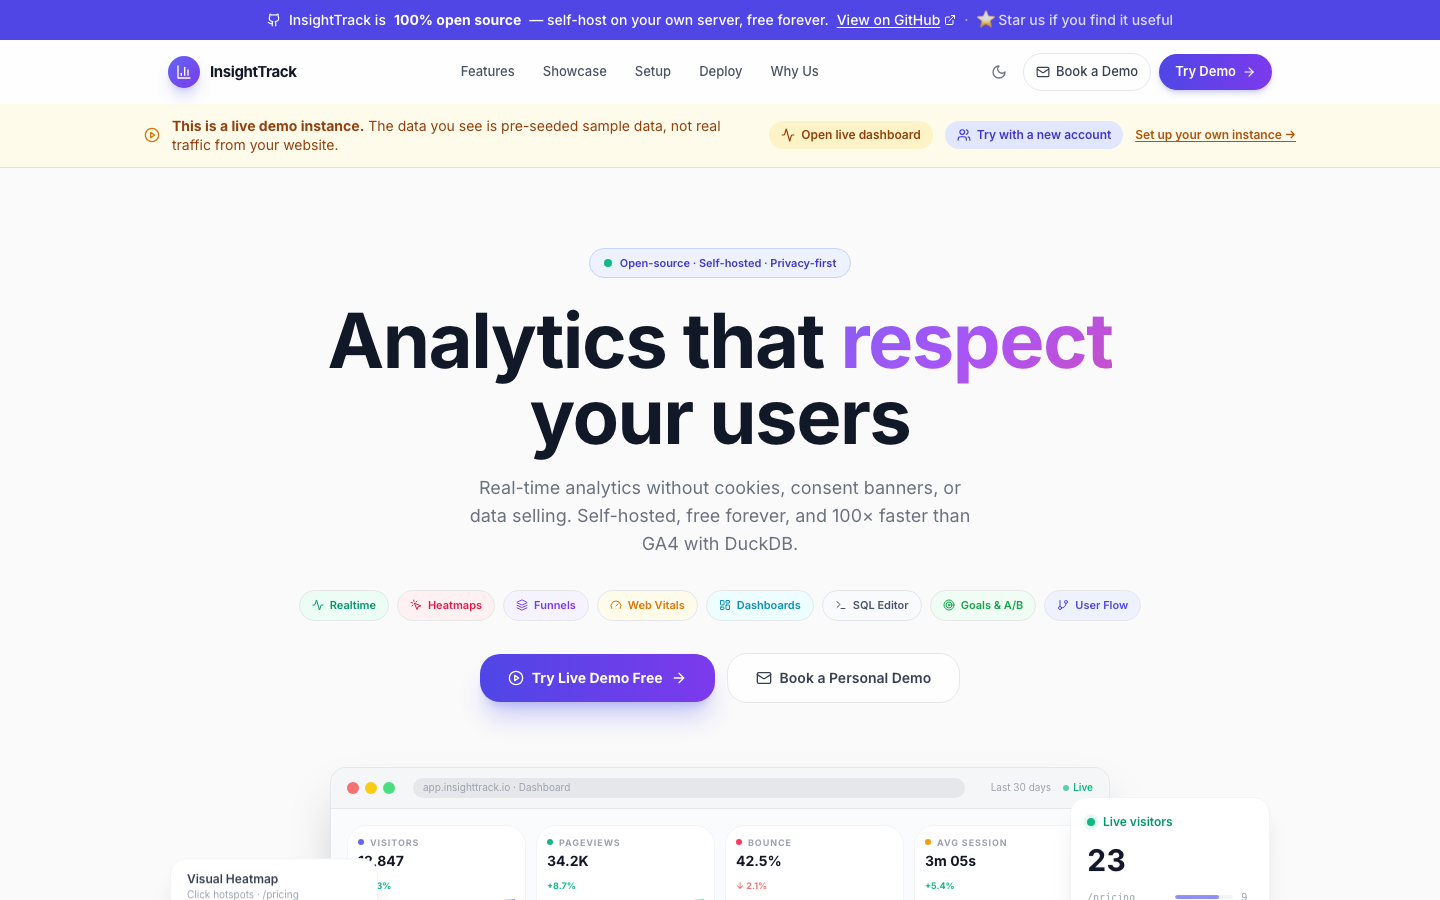
The landing page ships a live demo instance so anyone can explore the full product with realistic sample data before installing anything.
 |
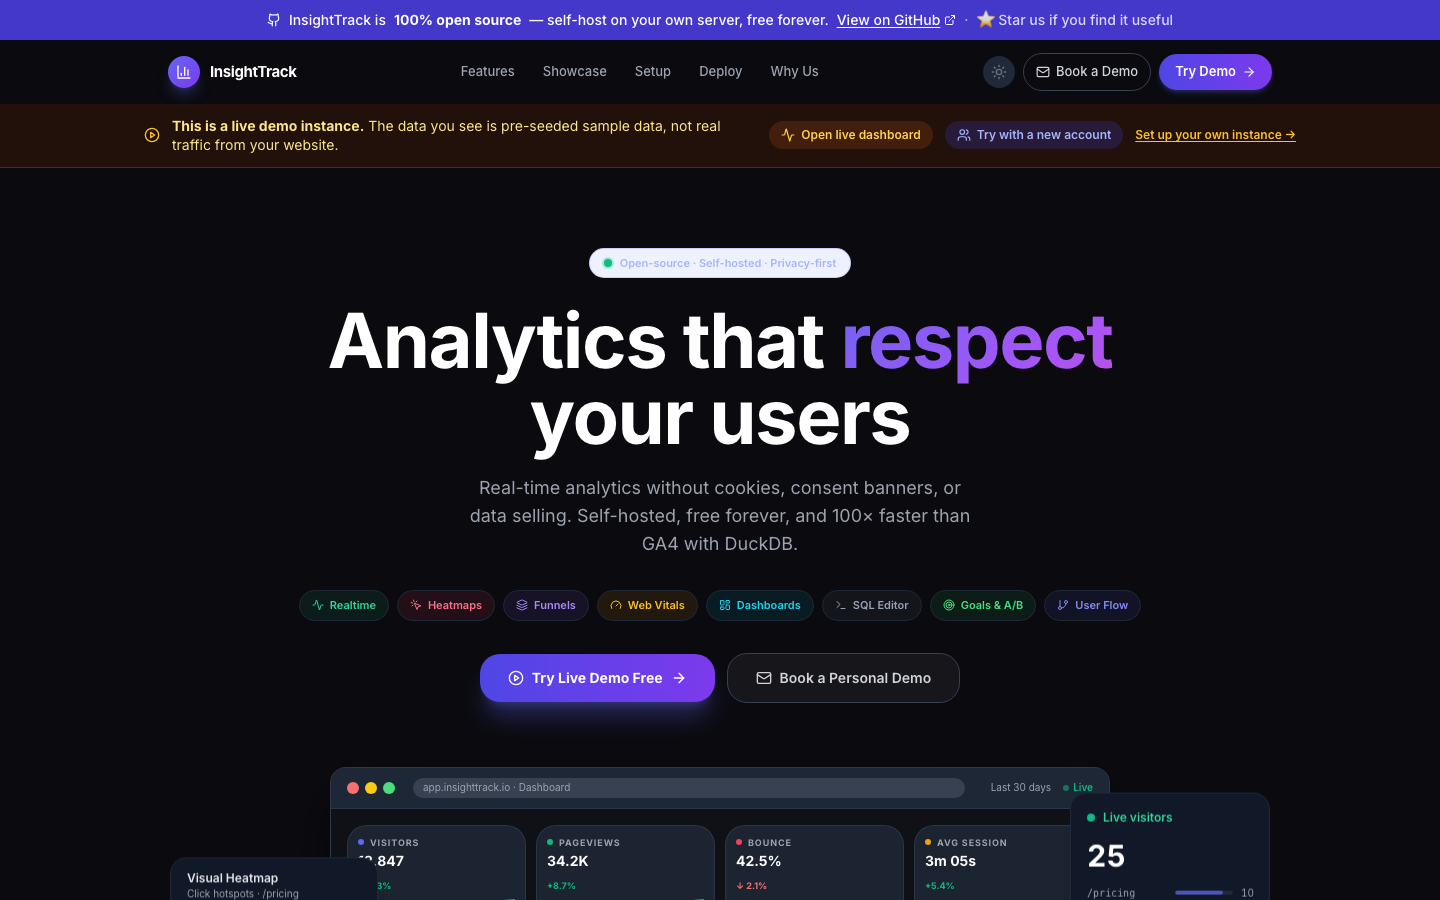 |
| Landing page — open-source banner, live demo notice, and clear CTAs. | Light & dark mode — the whole site (and app) supports both. |
Two paths from the landing page:
- Open live dashboard → log in or sign up → you're dropped straight into a dashboard pre-loaded with demo data (the
hello.comsample site). Great for evaluating features. - Set up your own instance → sign up for a fresh account → onboarding walks you through adding your first site and tracking script.
🚀 Quick Start
The fastest way to run the whole stack (PostgreSQL + API + dashboard + a demo site) is Docker.
Prerequisites
- Docker & Docker Compose (recommended), or Node.js 20+ + PostgreSQL 16 for manual setup.
One command (Docker)
git clone https://github.com/NishikantaRay/InsightTrack.git
cd InsightTrack

cp .env.example .env          # fill in passwords / secrets
docker-compose up --build -d
| Service | URL |
|---|---|
| 📊 Dashboard | http://localhost:4173 |
| 🔌 Backend API | http://localhost:3001 |
| 🌐 Demo site (sample tracked page) | http://localhost:8080 |
| 🗄️ pgAdmin (DB browser) | http://localhost:5050 |
Open the dashboard, register an account, and you're live.
Manual setup (no Docker)
Requires Node.js 20+ and a running PostgreSQL.
# 1. Backend — Express + PostgreSQL (writes) + DuckDB (analytics reads)
cd apps/analytics-api
npm install
cp .env.example .env   # PG_*, JWT_SECRET, and everything else — see below
npm run migrate        # create PostgreSQL tables
npm run seed           # generate sample data (optional)
npm run init           # create DuckDB tables
npm run sync           # sync PostgreSQL → DuckDB
npm start              # → http://localhost:3001

# 2. Dashboard — in a second terminal
cd apps/dashboard-web
npm install
cp .env.example .env   # sets VITE_API_URL=http://localhost:3001
npm run dev            # → http://localhost:5173 (dev) / 4173 (preview)
Full walkthrough, including starting PostgreSQL in a container and the
troubleshooting steps, is in docs/running-locally.md.
That document is the authoritative manual-setup reference.
Configuration: apps/analytics-api/.env.example
is the complete backend configuration reference — PostgreSQL connection, JWT,
DuckDB path, sync tuning, cache TTLs, rate limits, and optional integrations.
The root .env.example configures the Docker Compose stack
only and is not a substitute for it.
Add tracking to your website
After creating a site in Settings, paste this once into your site's <head>:
<script src="http://localhost:3001/api/sites/YOUR_SITE_ID/script"></script>
Pageviews, sessions, clicks, scroll depth, Web Vitals, JS errors, and heatmap data start flowing immediately — no extra configuration.
Full local walkthrough: docs/running-locally.md
✨ Feature Walkthrough
🌟 Pulse — your AI analyst
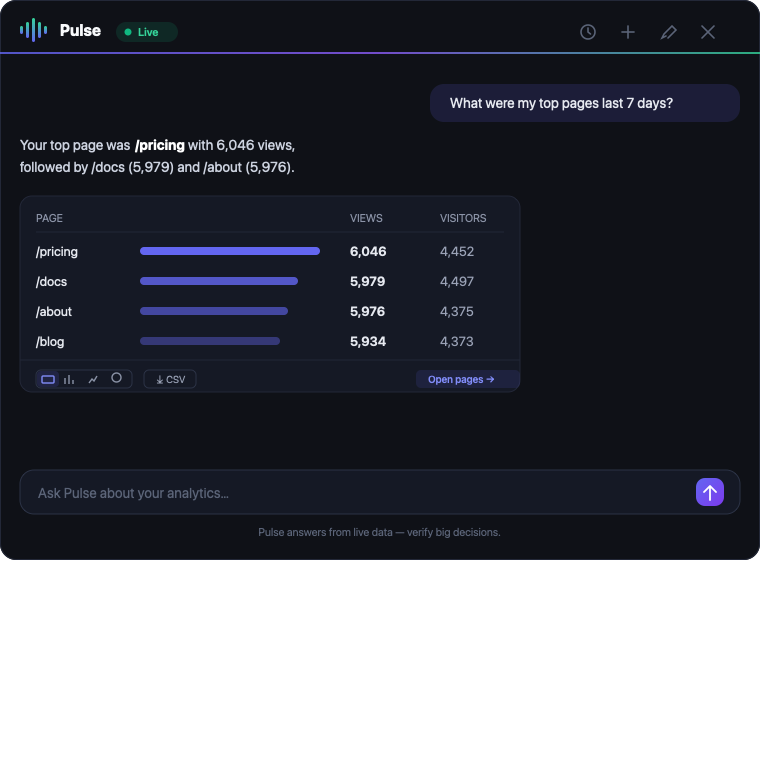
Ask your analytics anything in plain English. Pulse is a built-in AI analyst that turns questions into real answers — "top pages last 7 days", "where's my traffic from?", "how's my funnel doing?" — backed by live data, never invented.
- Real charts, tables & CSV — every answer renders as a chart, table, or KPI card. Switch the view (table ↔ bar ↔ line ↔ donut), export to CSV, or deep-link straight to the matching dashboard page.
- Read-only & safe — Pulse calls a fixed catalogue of read-only analytics tools. It can query, but can never change settings or delete data, and every number is backed by a real tool call.
- Works in Claude Desktop, Cursor & any MCP client — the same tools are exposed over the Model Context Protocol. Connect via a remote URL or a local bridge, then ask Claude Desktop about your traffic and it queries InsightTrack directly. See
docs/ai-analyst.mdanddocs/mcp-toolkit.md. - Bring your own key — Anthropic (Claude), OpenAI (GPT), or Google (Gemini). Stored encrypted at rest (AES-256-GCM), never leaves your server. Or set a server key so the panel just works.
- Session memory — every conversation is saved and resumes where you left off; follow-ups keep context.
// Claude Desktop / Cursor — connect over MCP (remote, nothing to install)
{
  "mcpServers": {
    "insighttrack": {
      "type": "http",
      "url": "https://analytics.example.com/api/mcp/http",
      "headers": { "Authorization": "Bearer <your connect token>" }
    }
  }
}
Dashboard
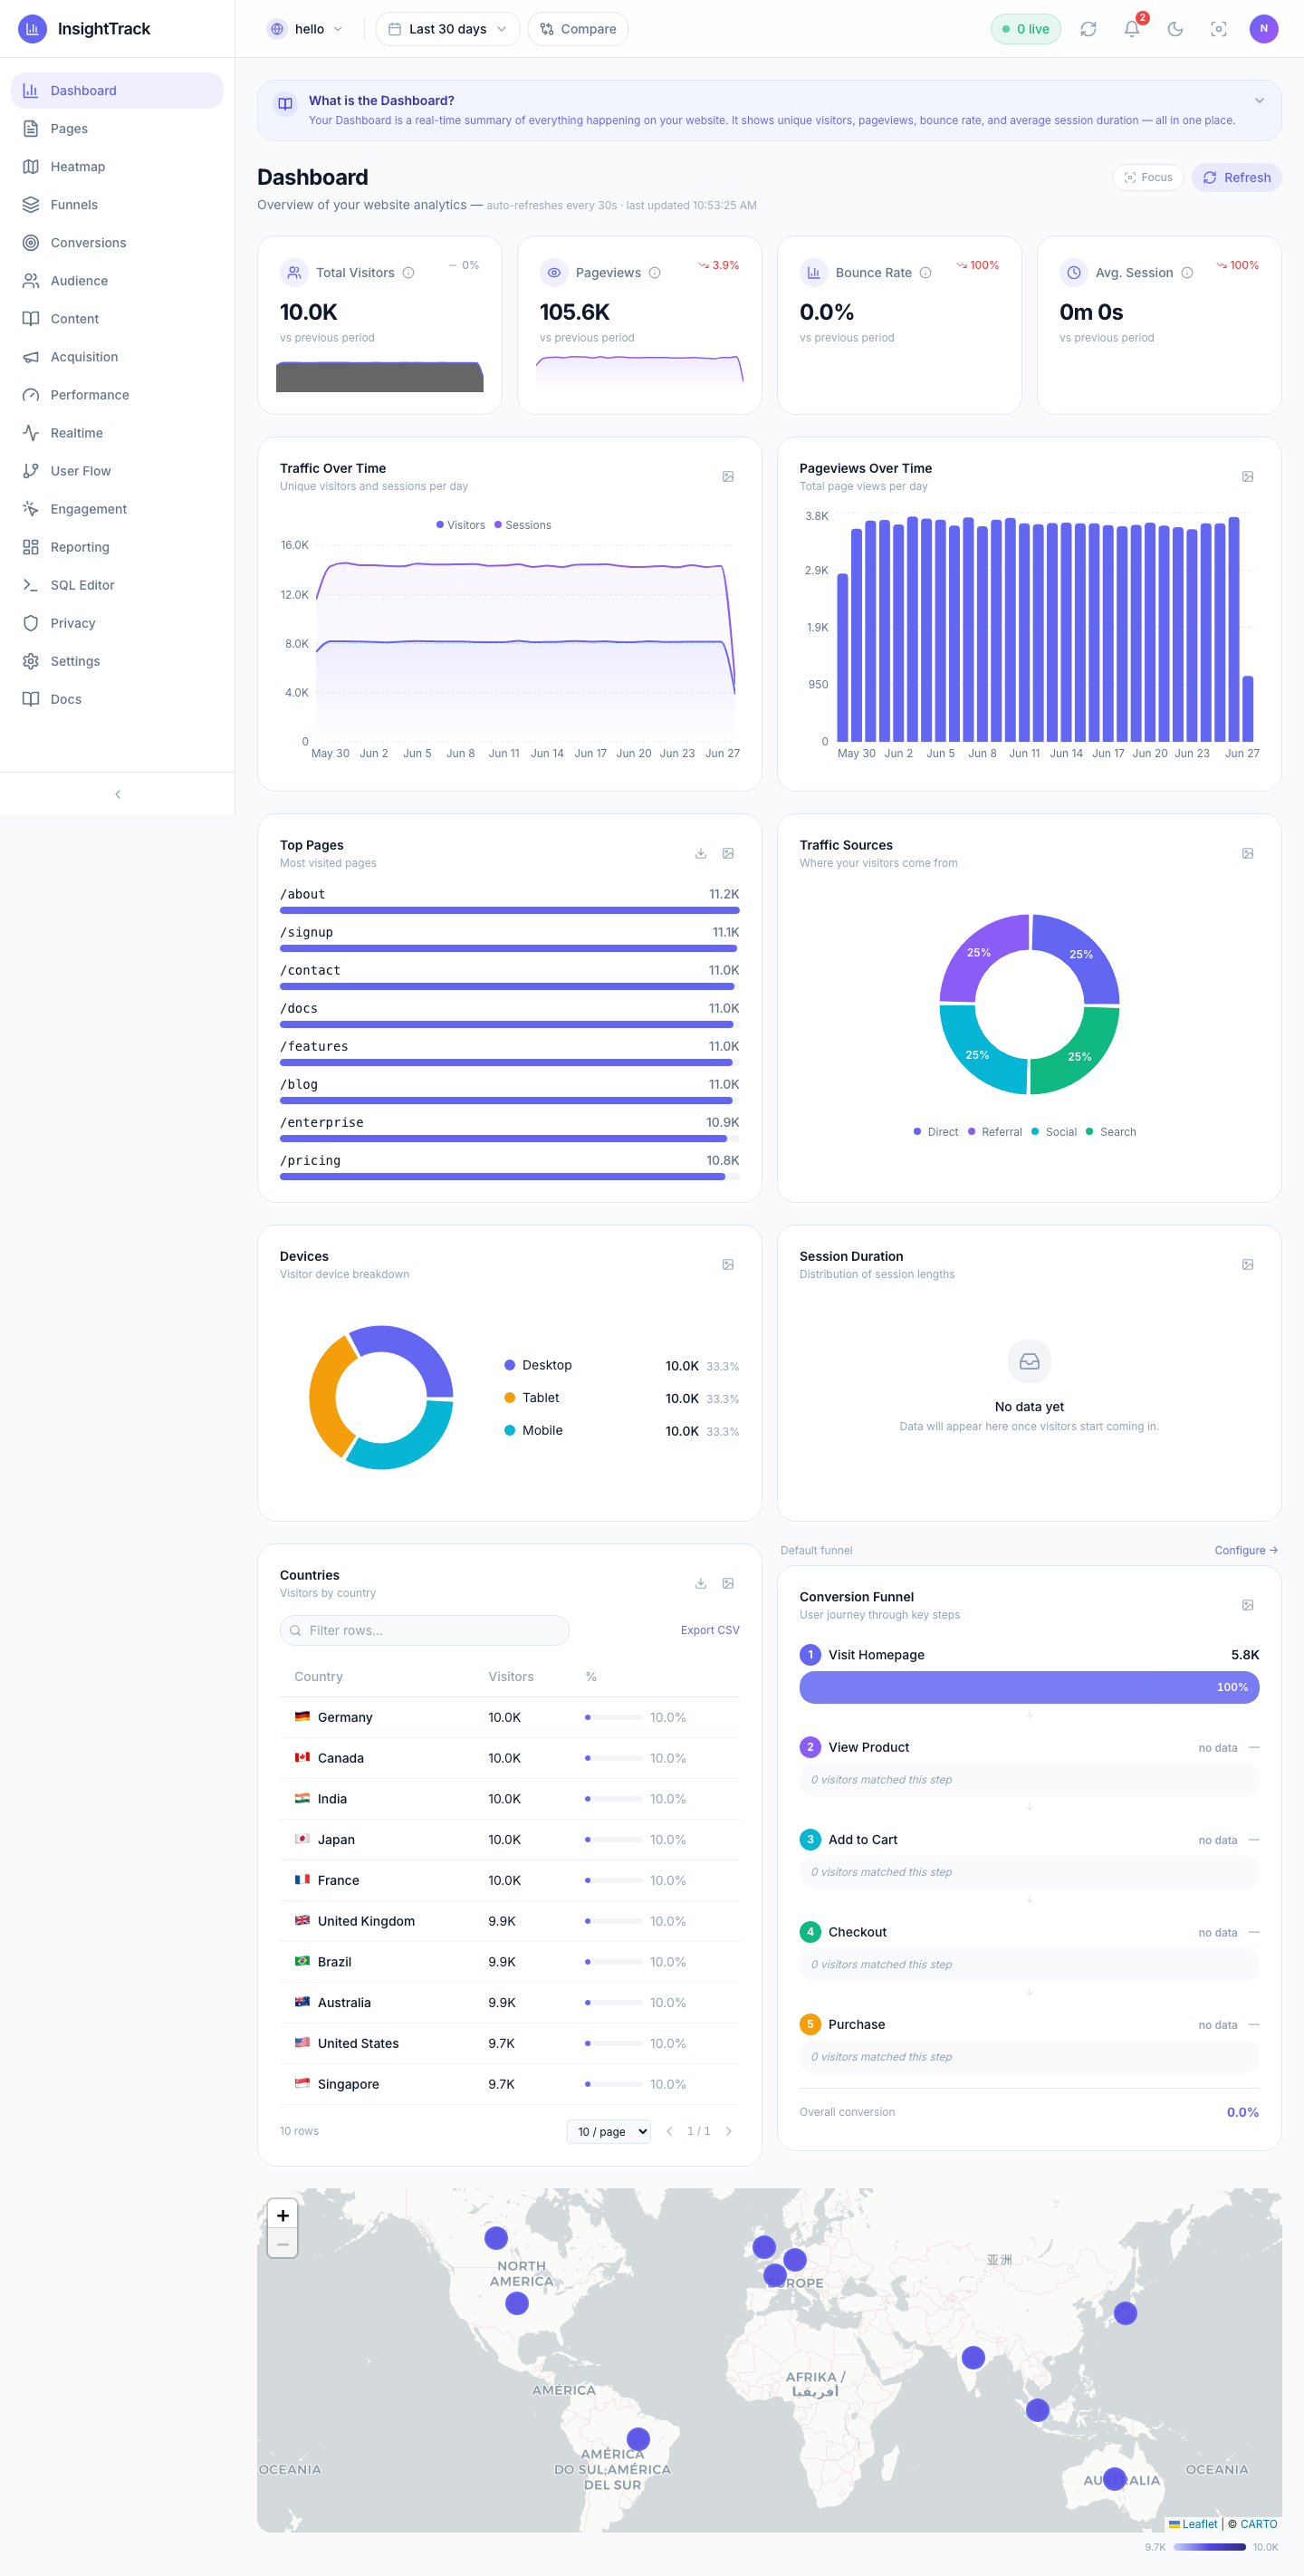
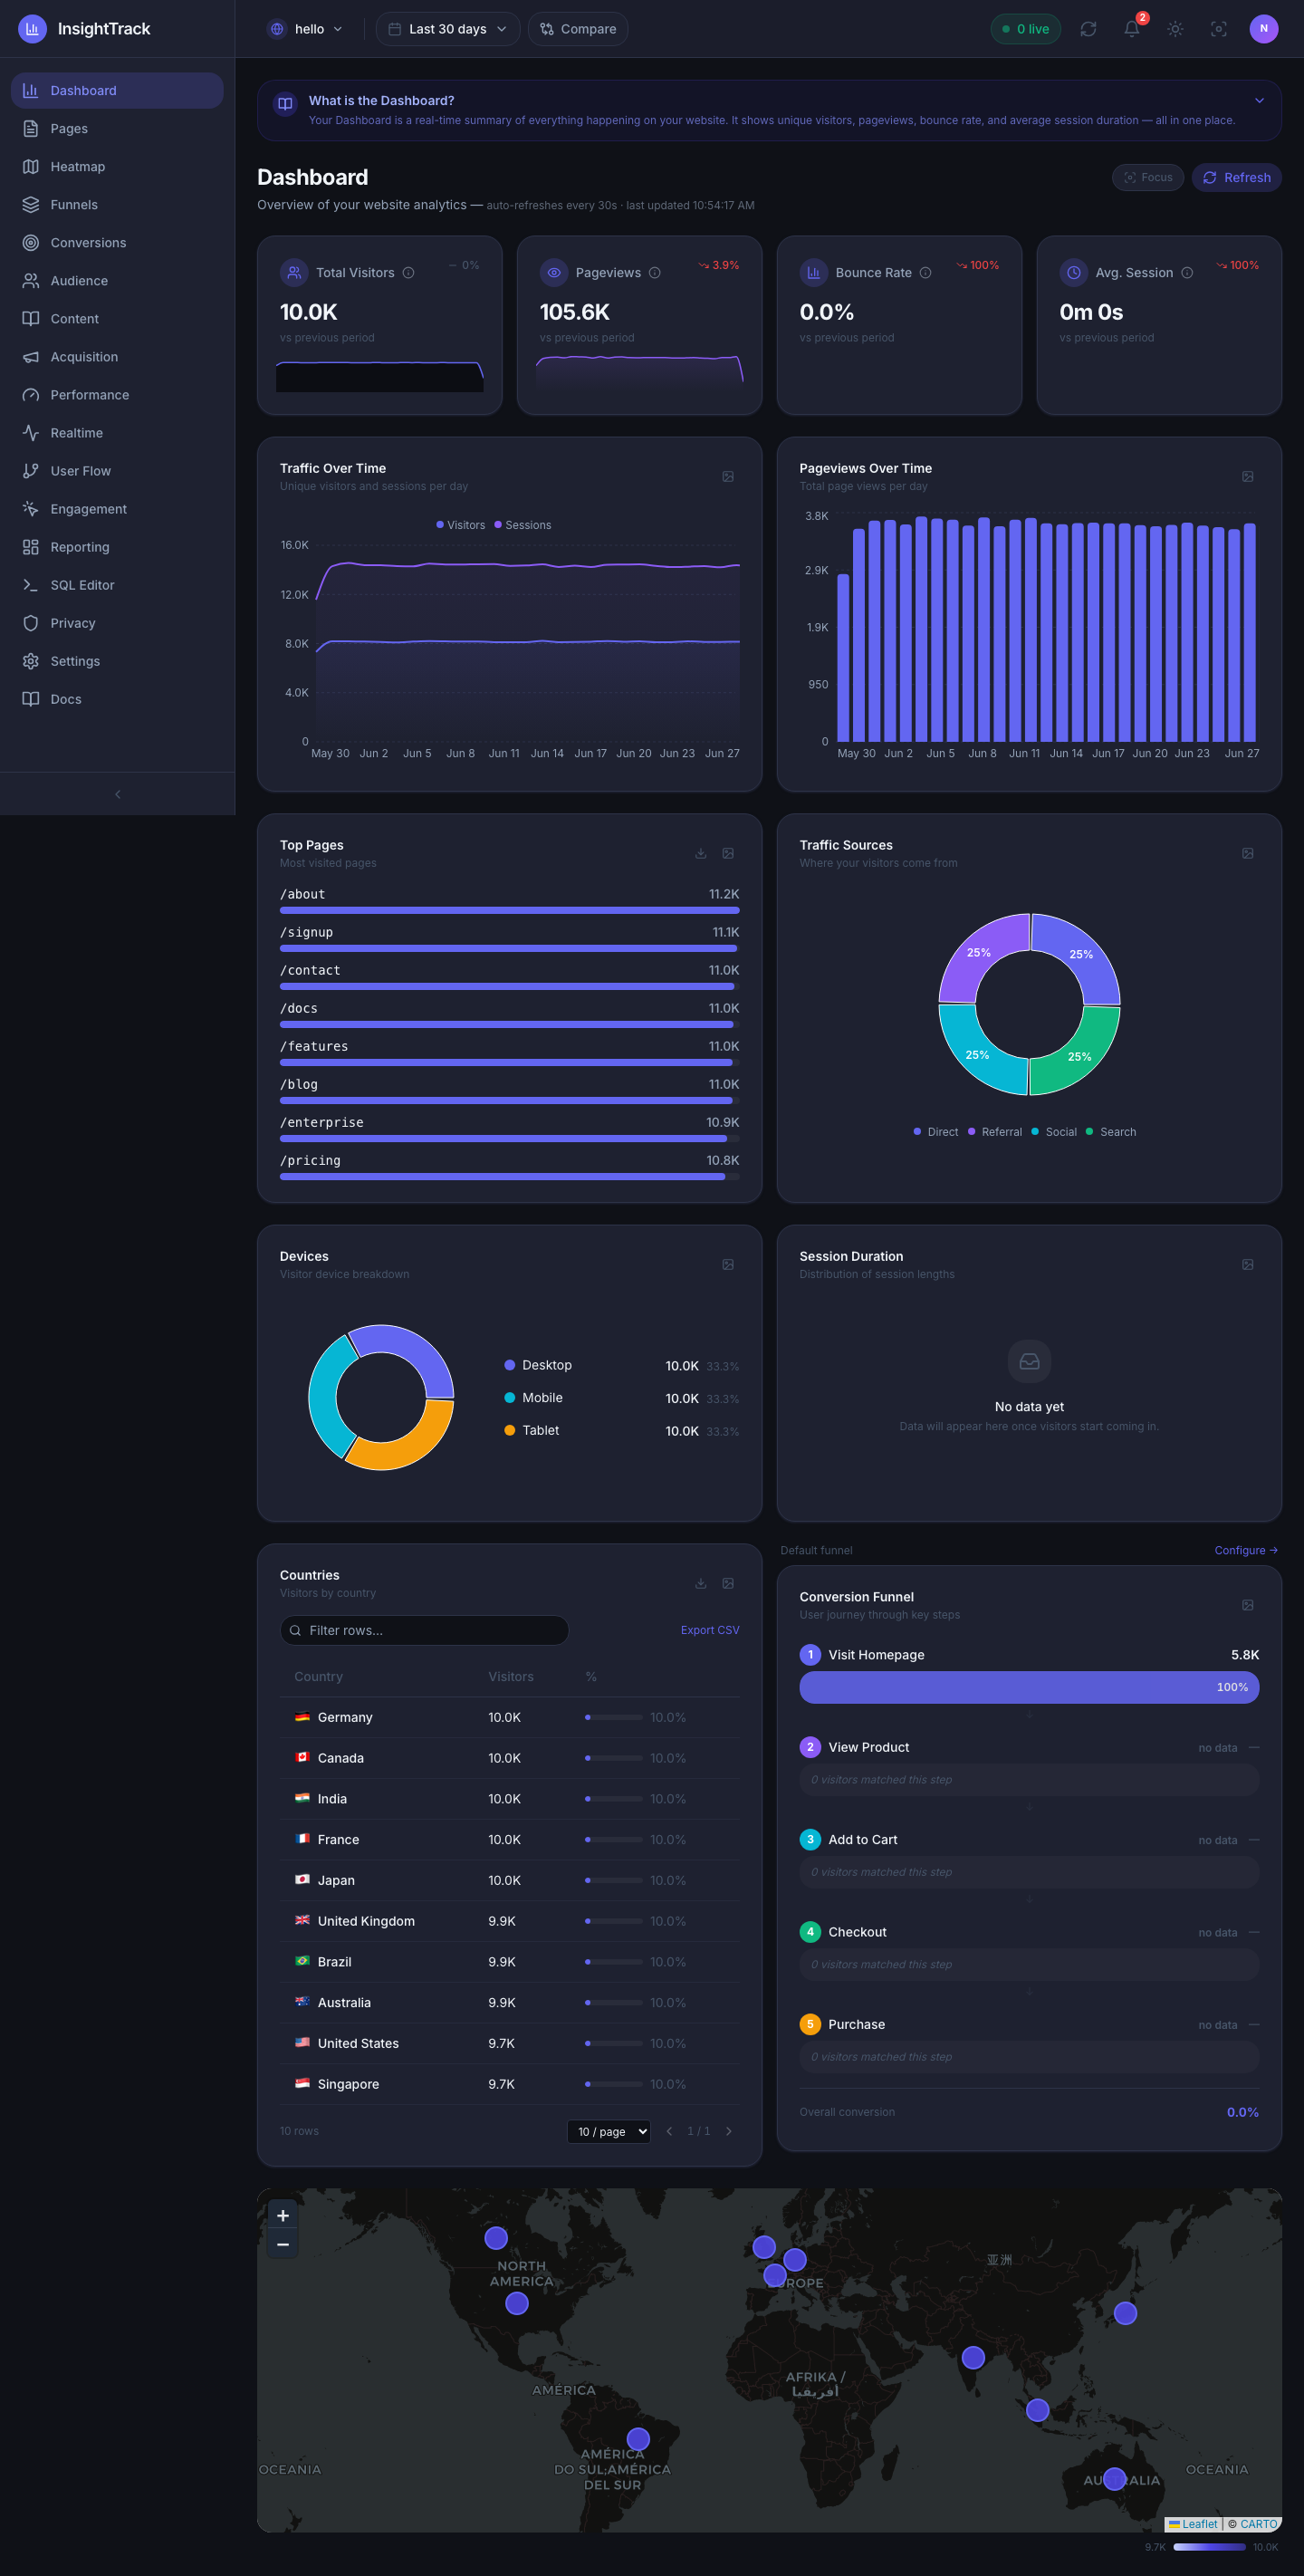
The home view: KPI cards (visitors, pageviews, bounce rate, avg. session) with trends and sparklines, traffic & pageviews charts, top pages, traffic sources donut, devices, countries leaderboard, the conversion funnel, and a live world map — all for the selected date range, auto-refreshing.
Real-time
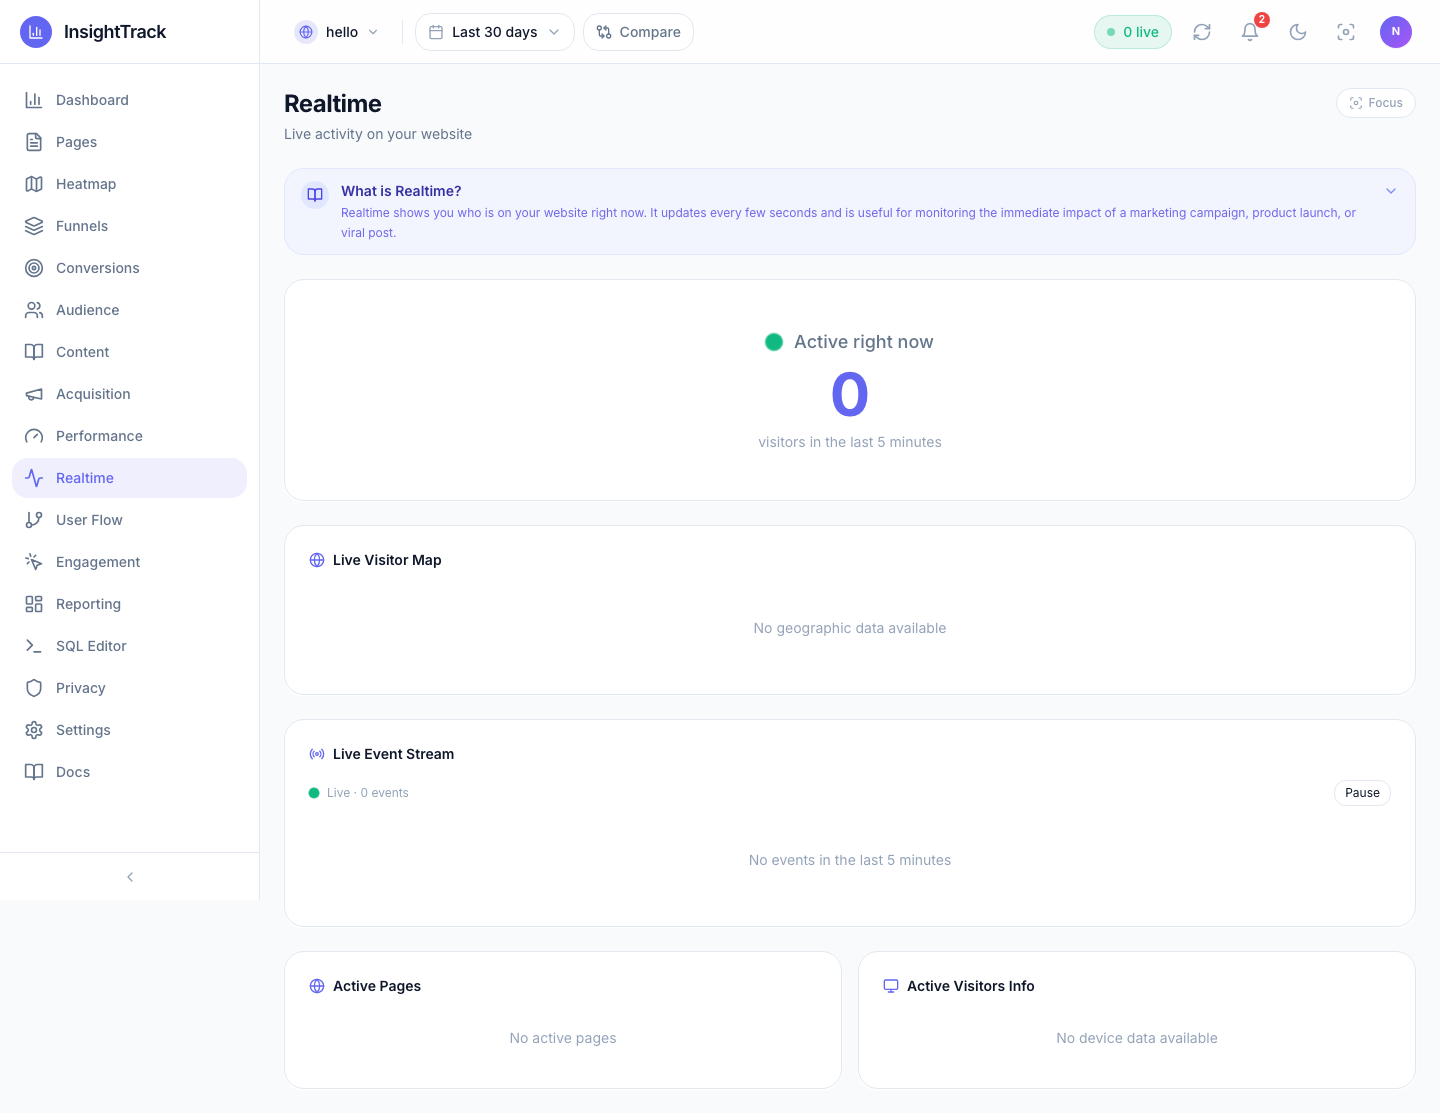
Live visitor count, active pages, an interactive world map of current visitors, and a device breakdown — refreshing every few seconds.
Visual Heatmap
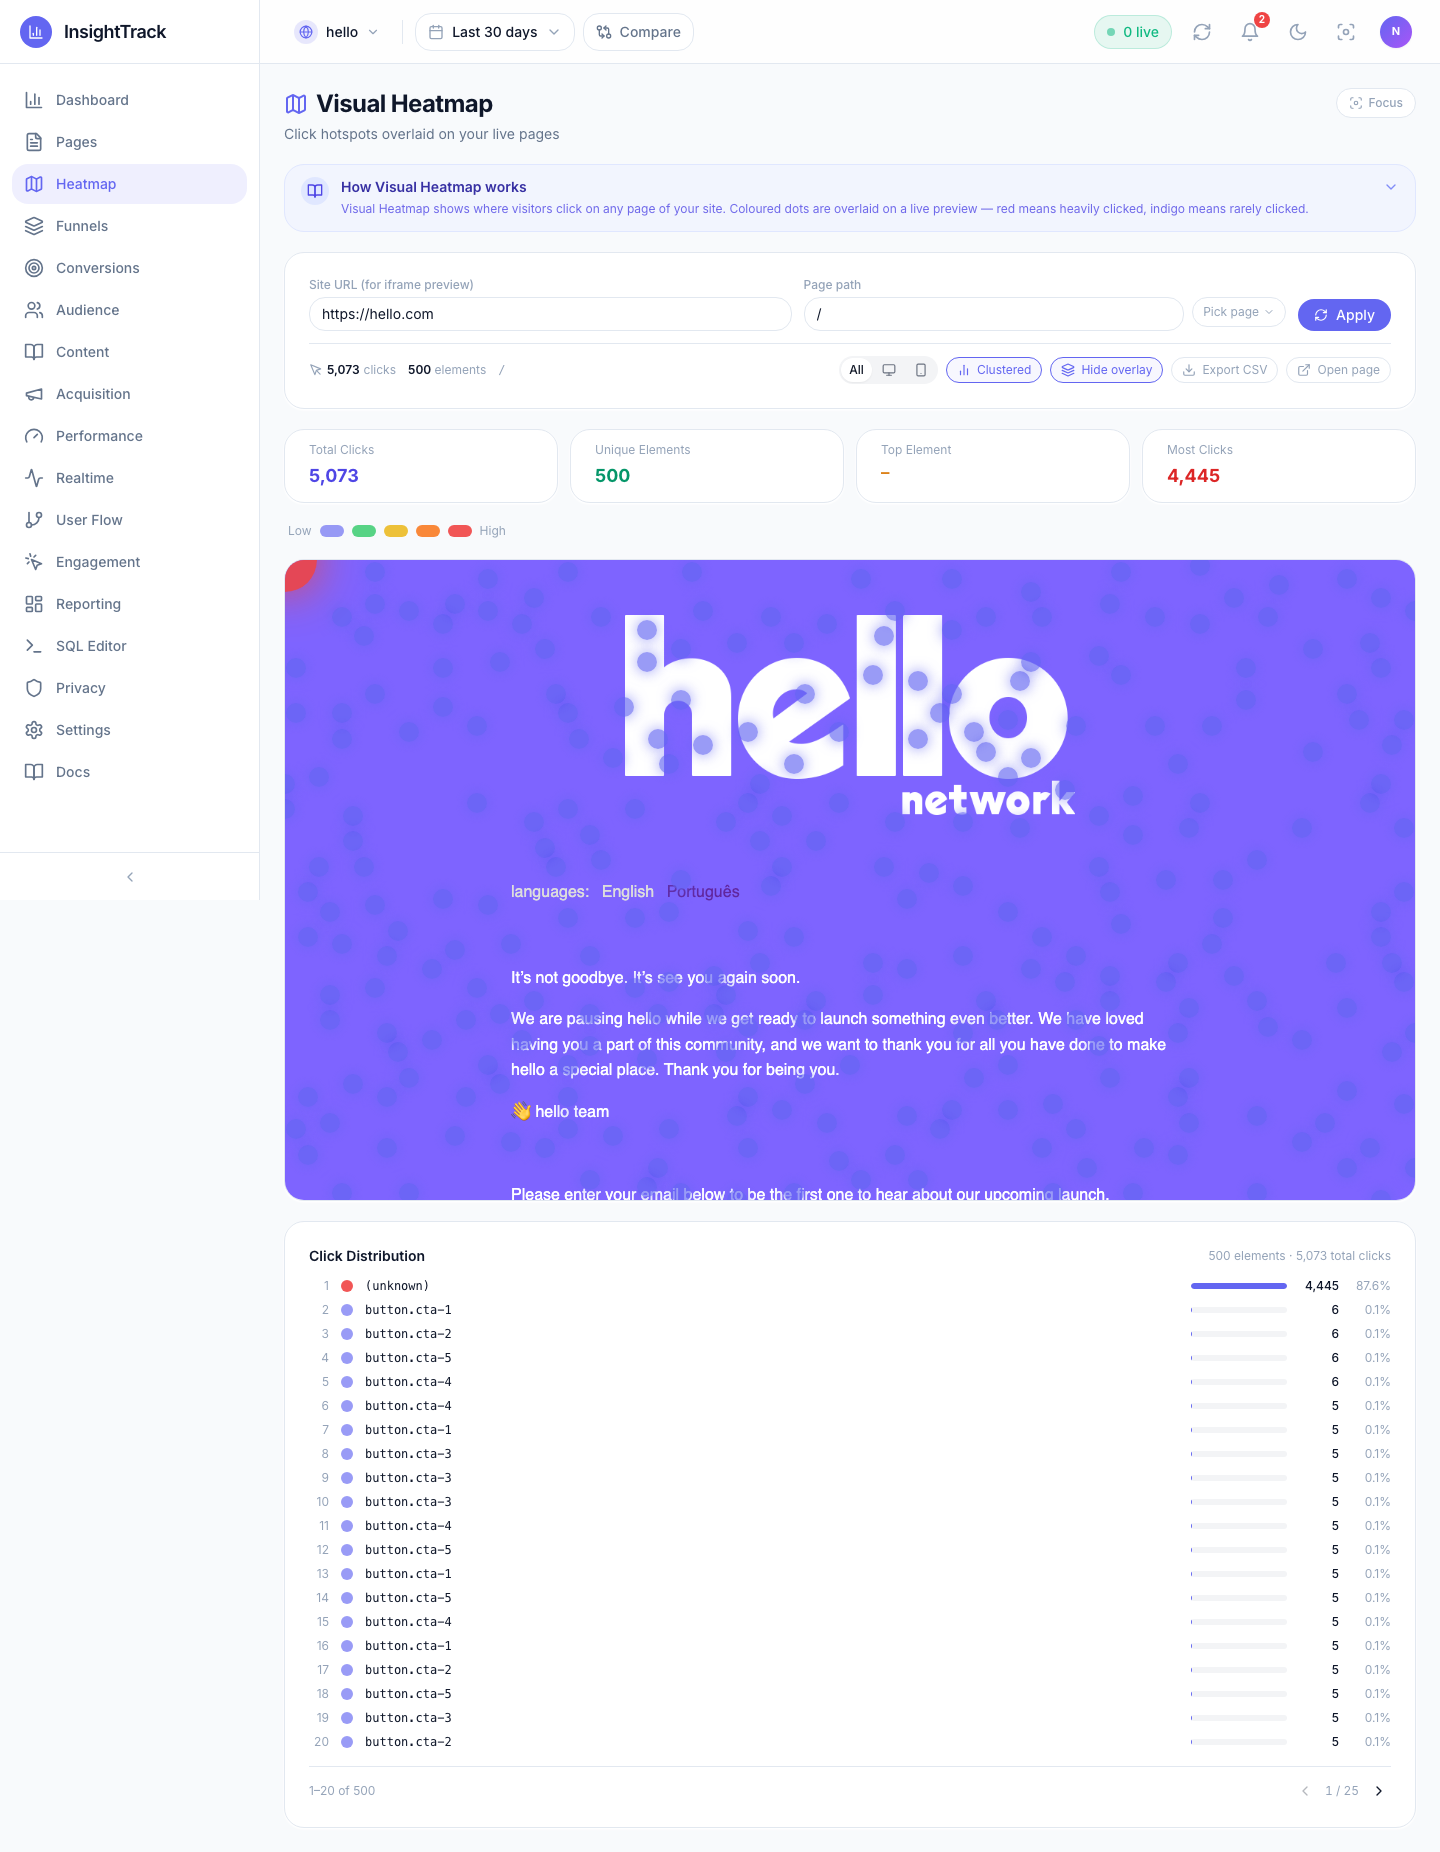
Click-density dots overlaid on a live preview of any tracked page — indigo (rare) → red (hottest). A Click Distribution table ranks every element by clicks and unique users. Filter by device, cluster nearby clicks, and export to CSV.
Engagement & Performance
 |
 |
|---|---|
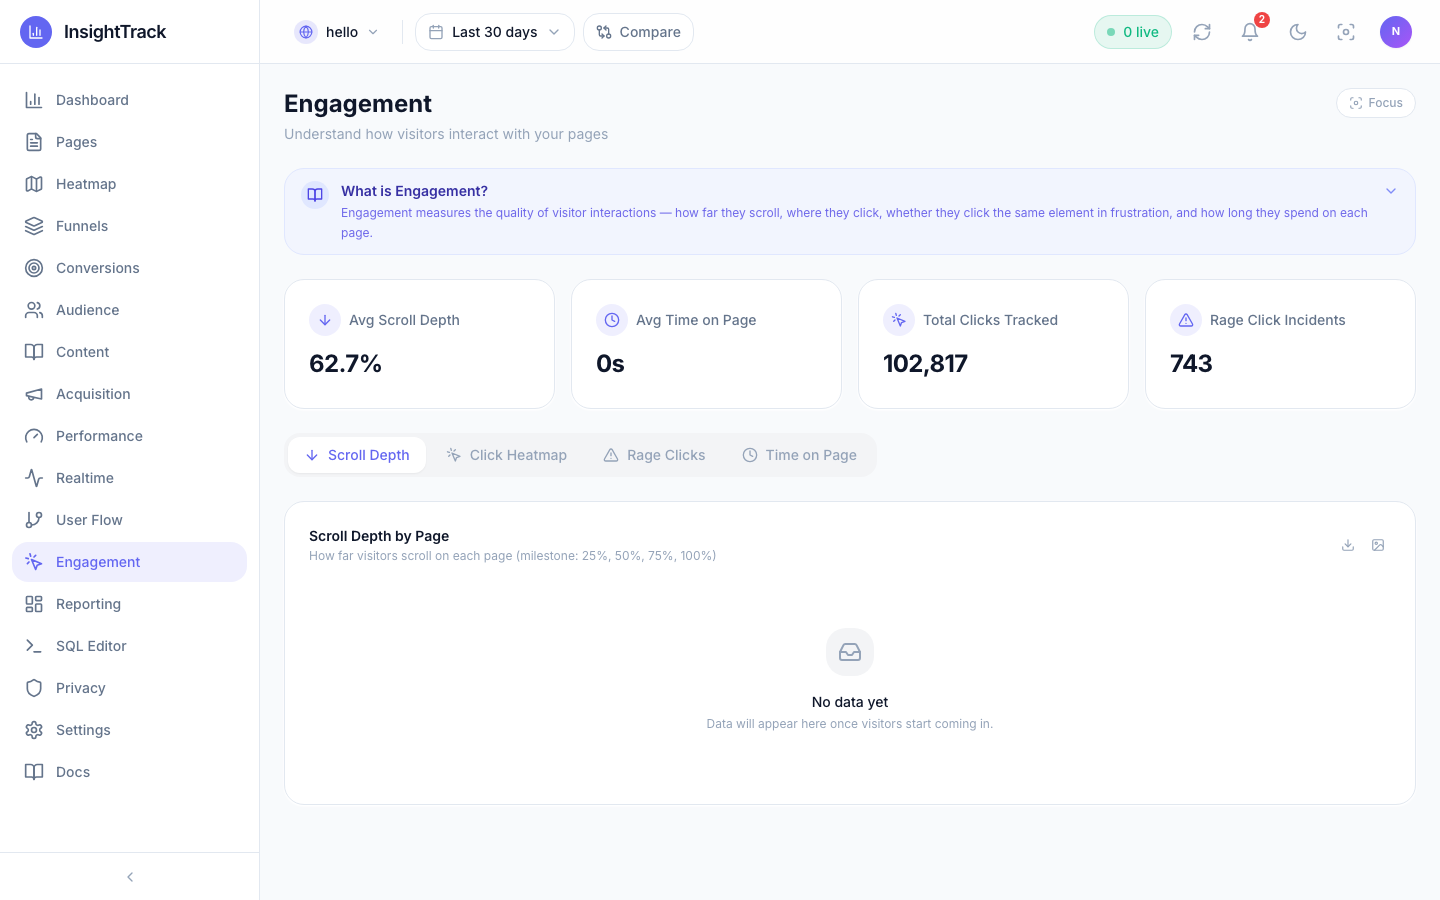
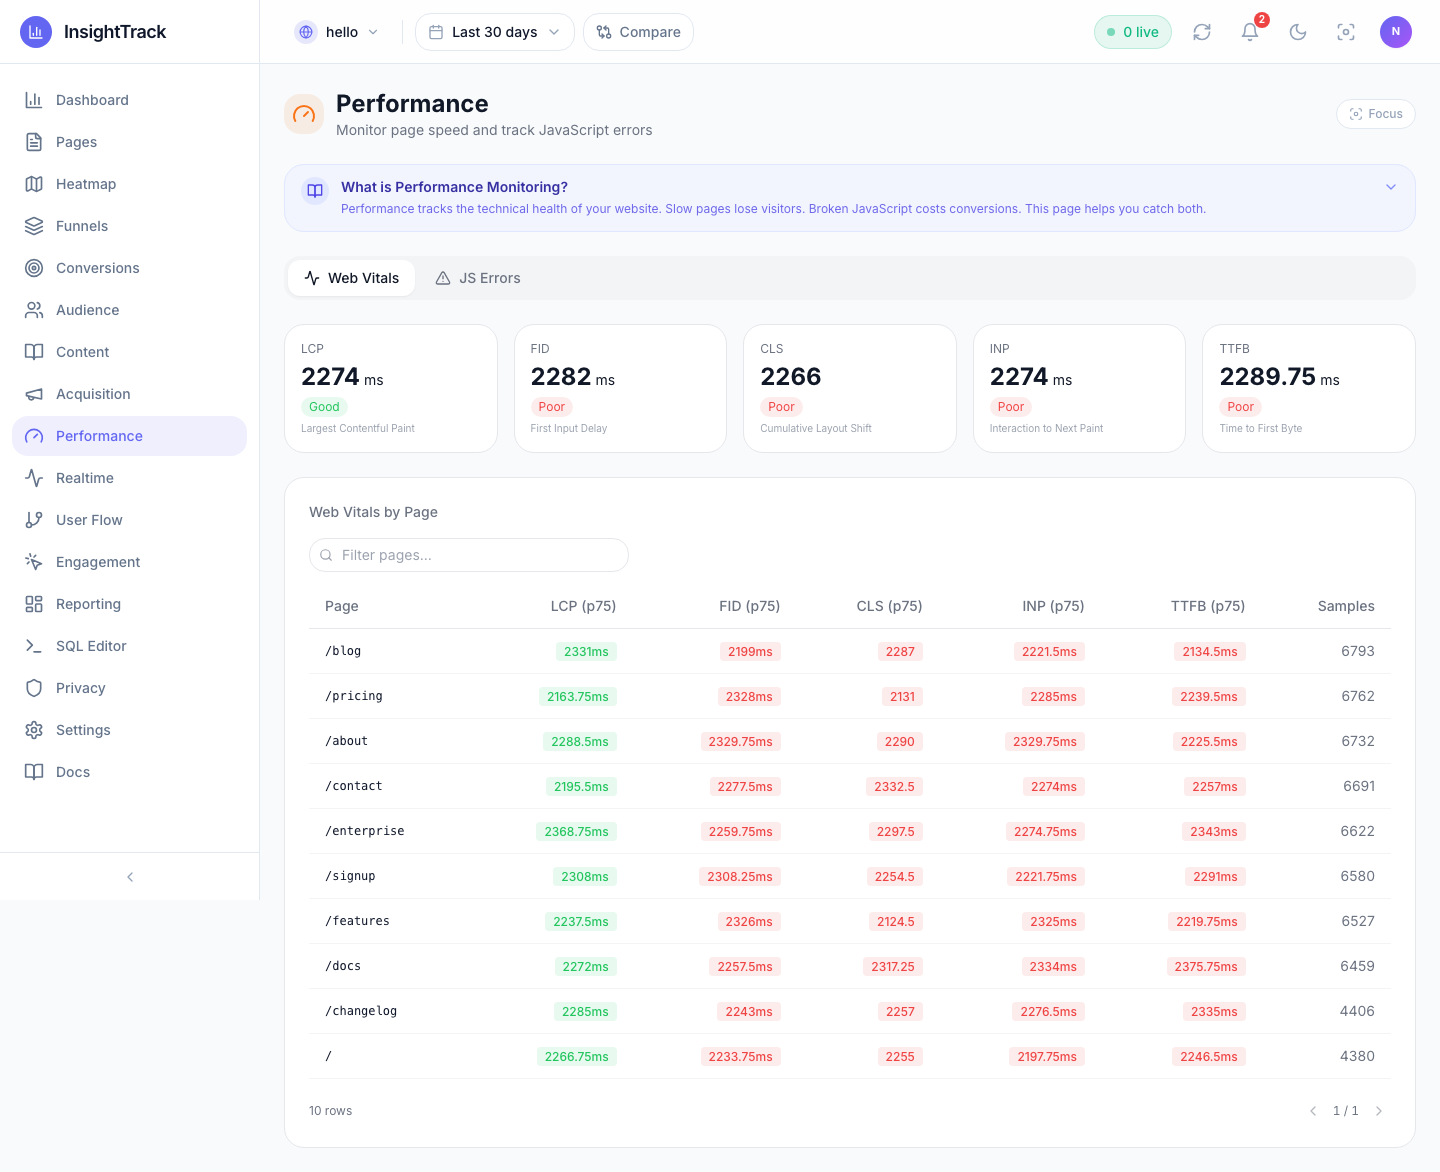
| Engagement — scroll-depth milestones (25/50/75/100%), rage-click detection, and time-on-page behaviour. | Performance — Core Web Vitals (LCP, FID, CLS, INP, TTFB) scored against Google thresholds, plus a JS error log with trend chart. |
Funnels & Conversions
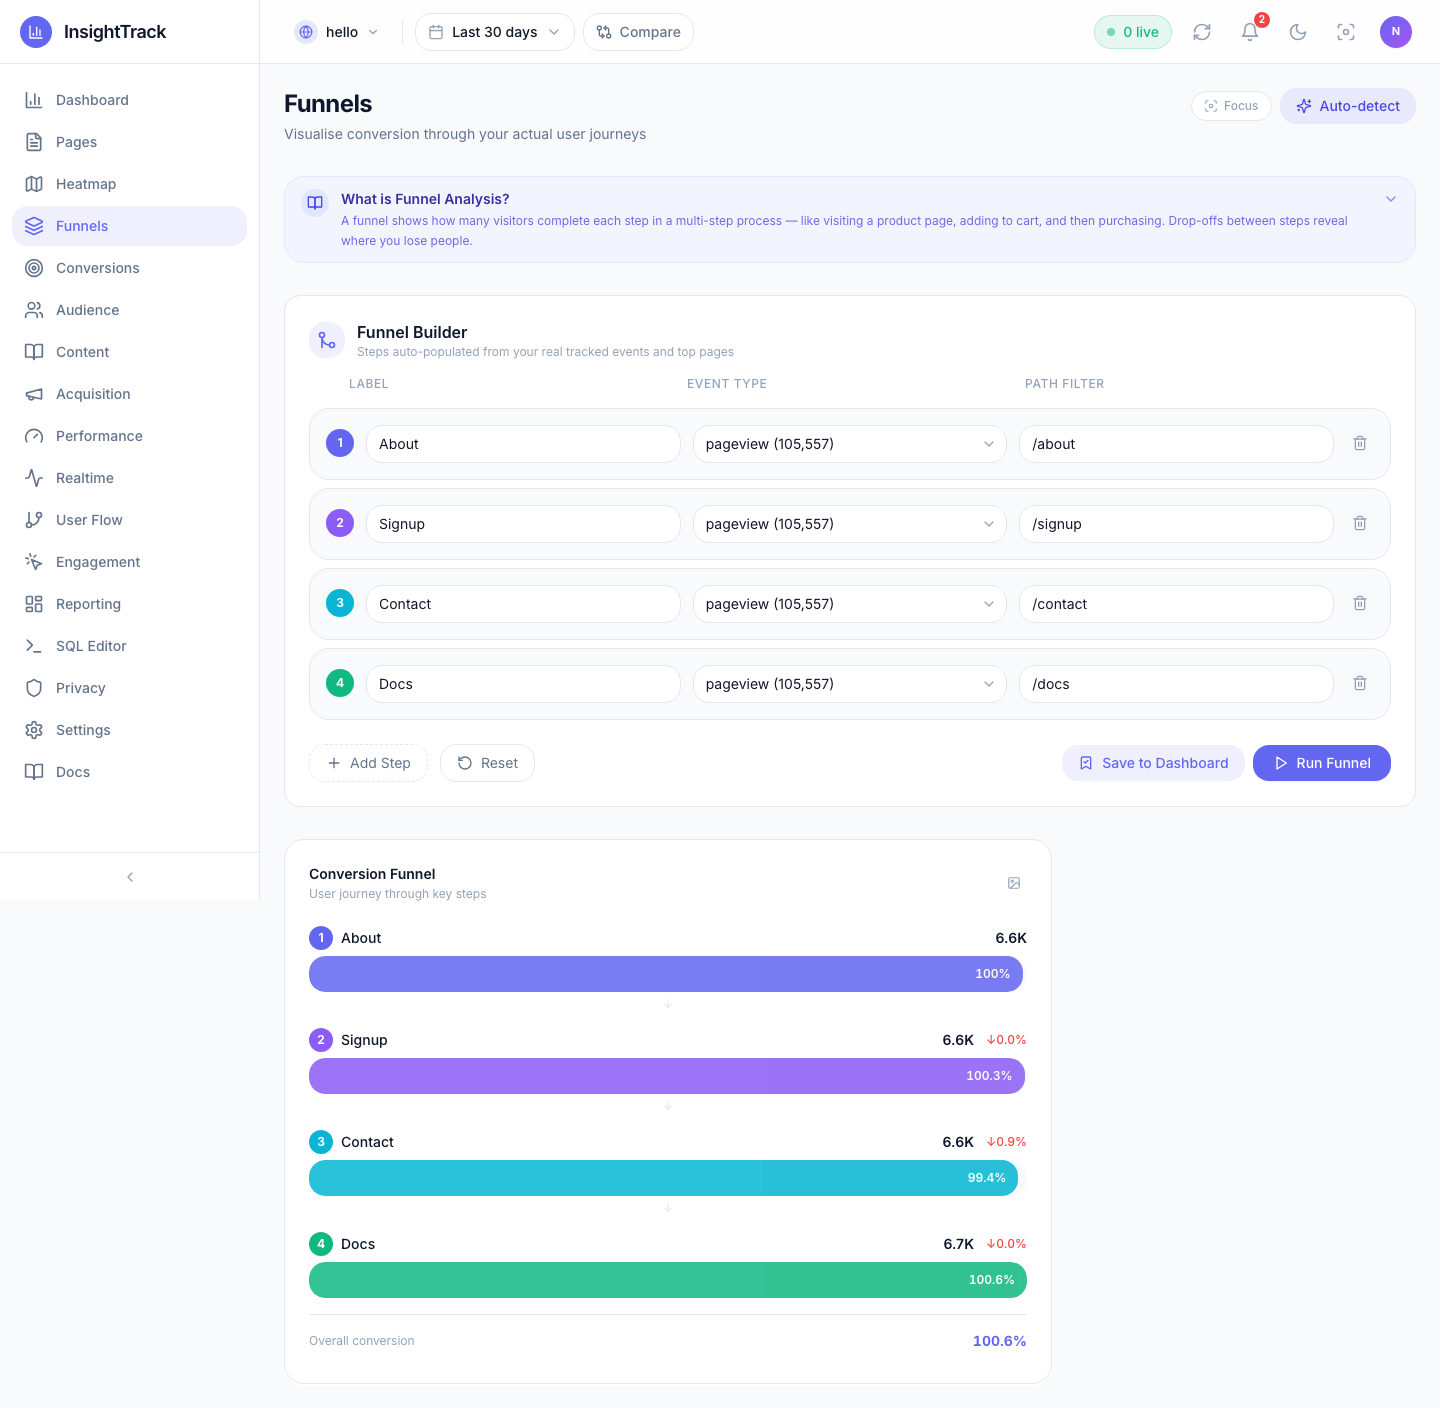 |
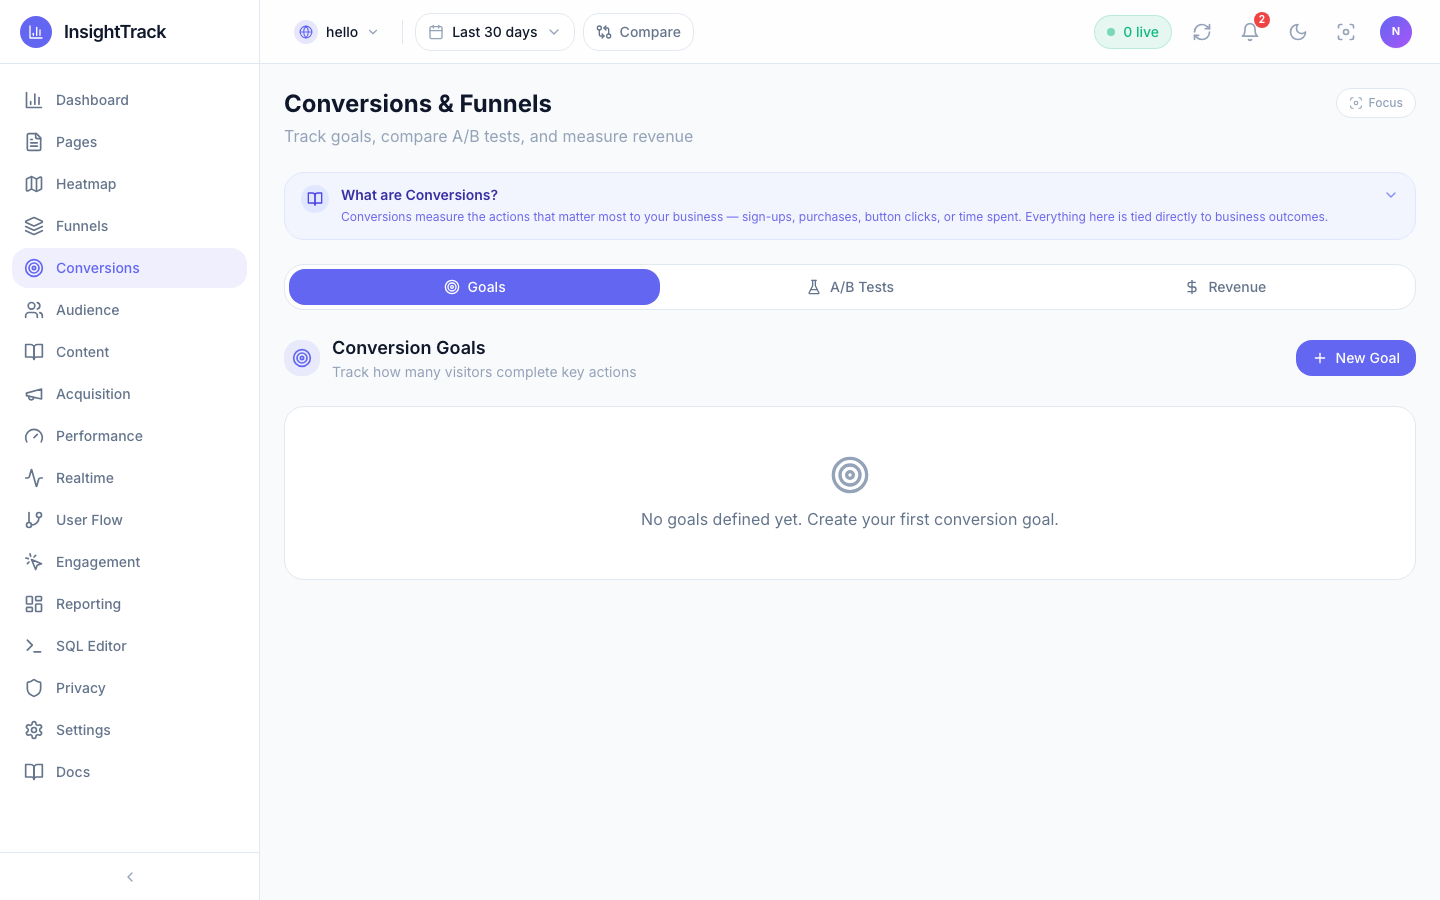 |
|---|---|
| Funnels — define multi-step journeys and see exact drop-off between stages. | Conversions — track goals and conversion rates over time. |
Audience, Acquisition & Pages
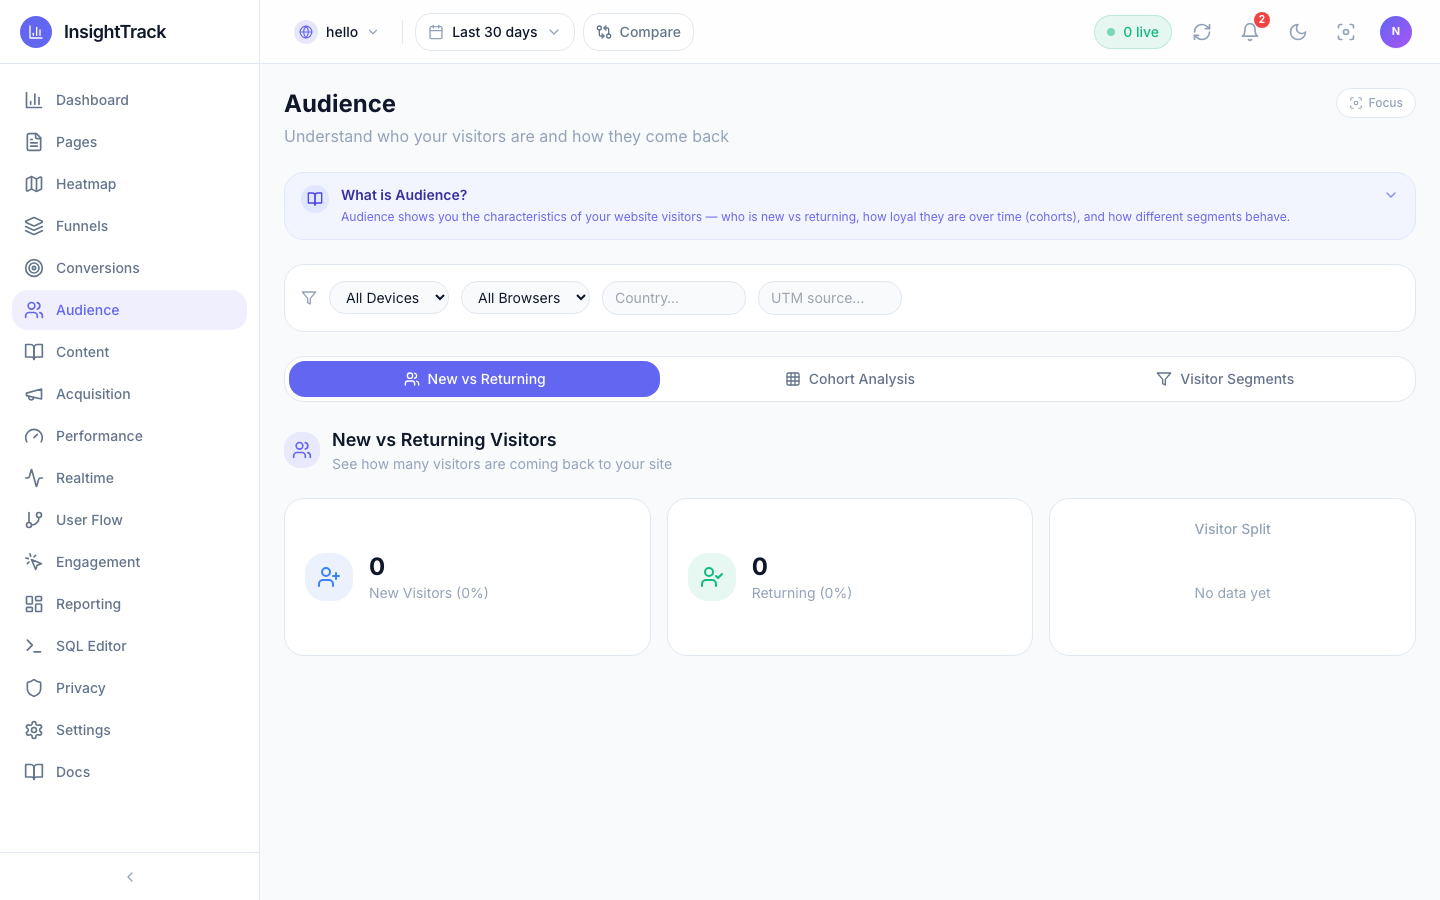 |
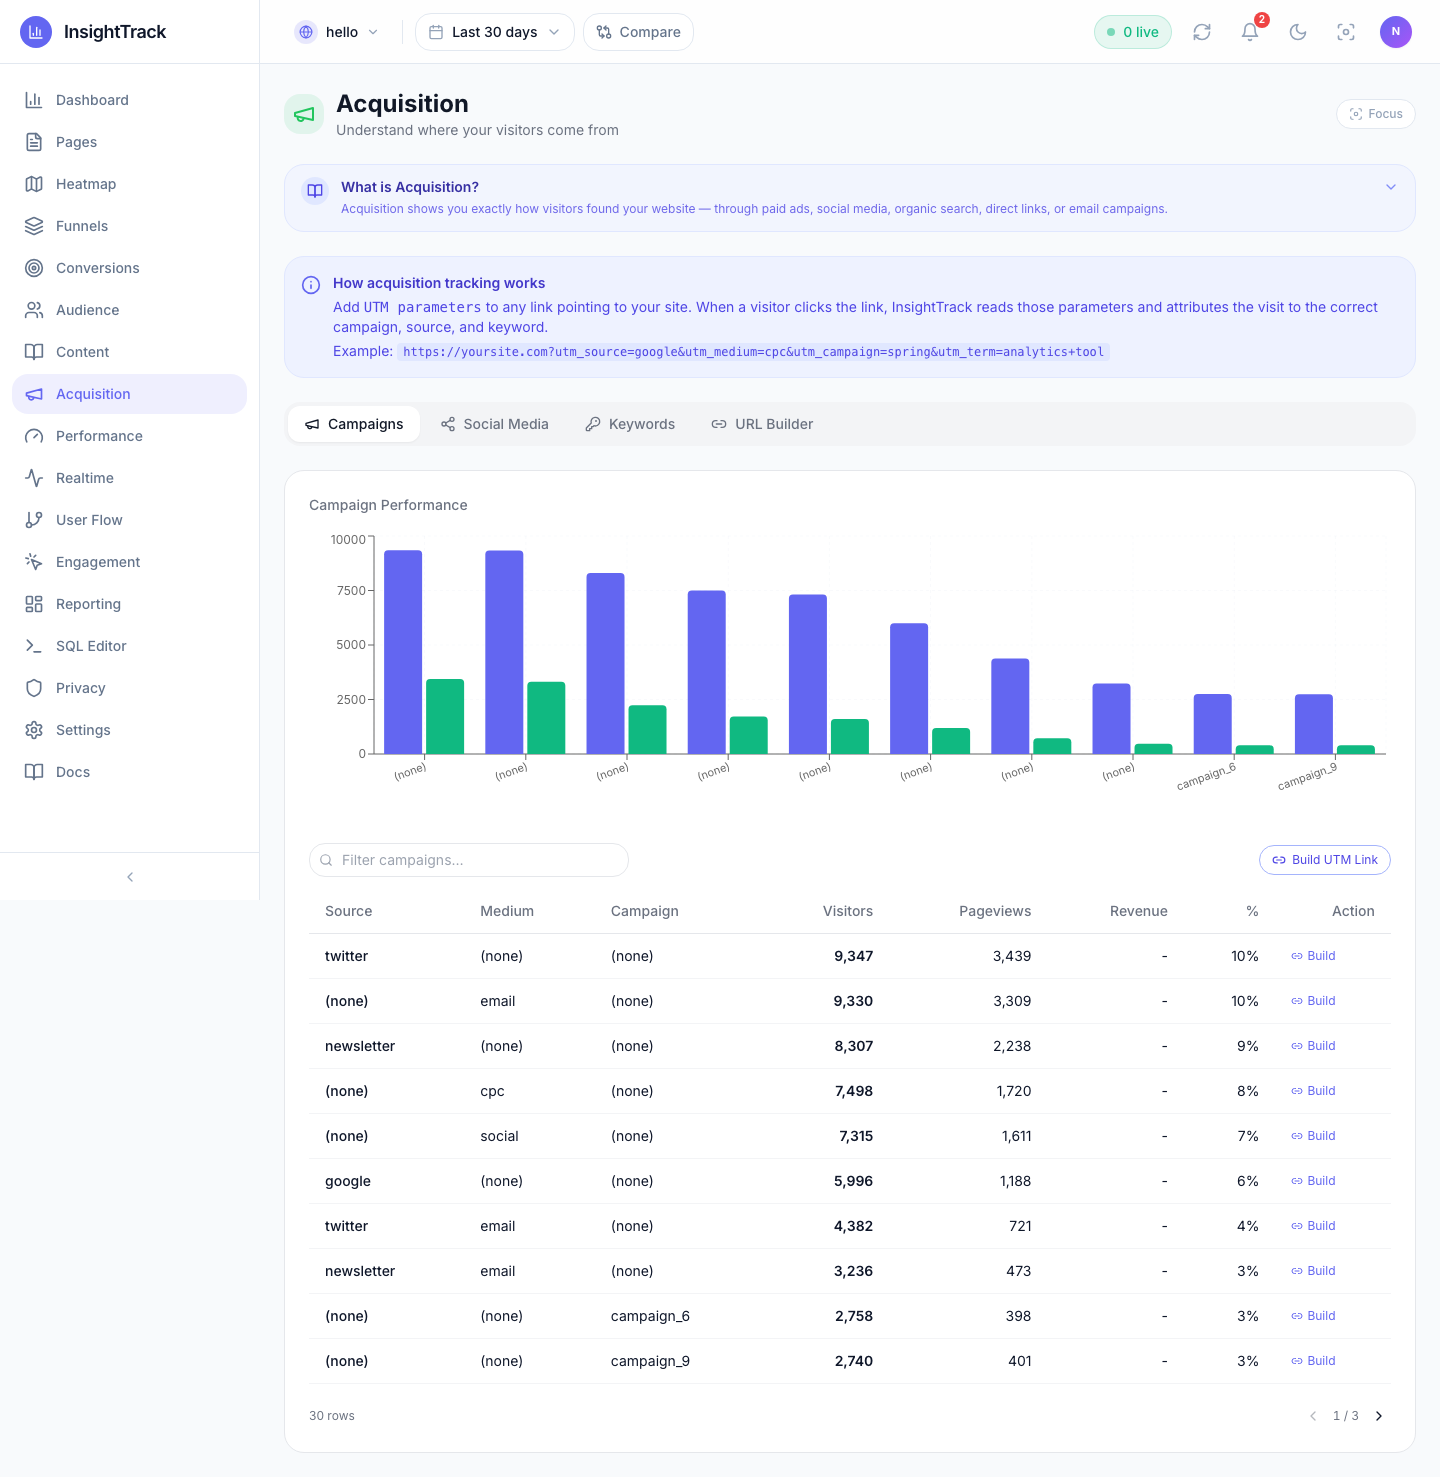 |
|---|---|
| Audience — devices, browsers, OS, countries, returning vs. new. | Acquisition — traffic sources, referrers, and UTM campaign breakdown. |
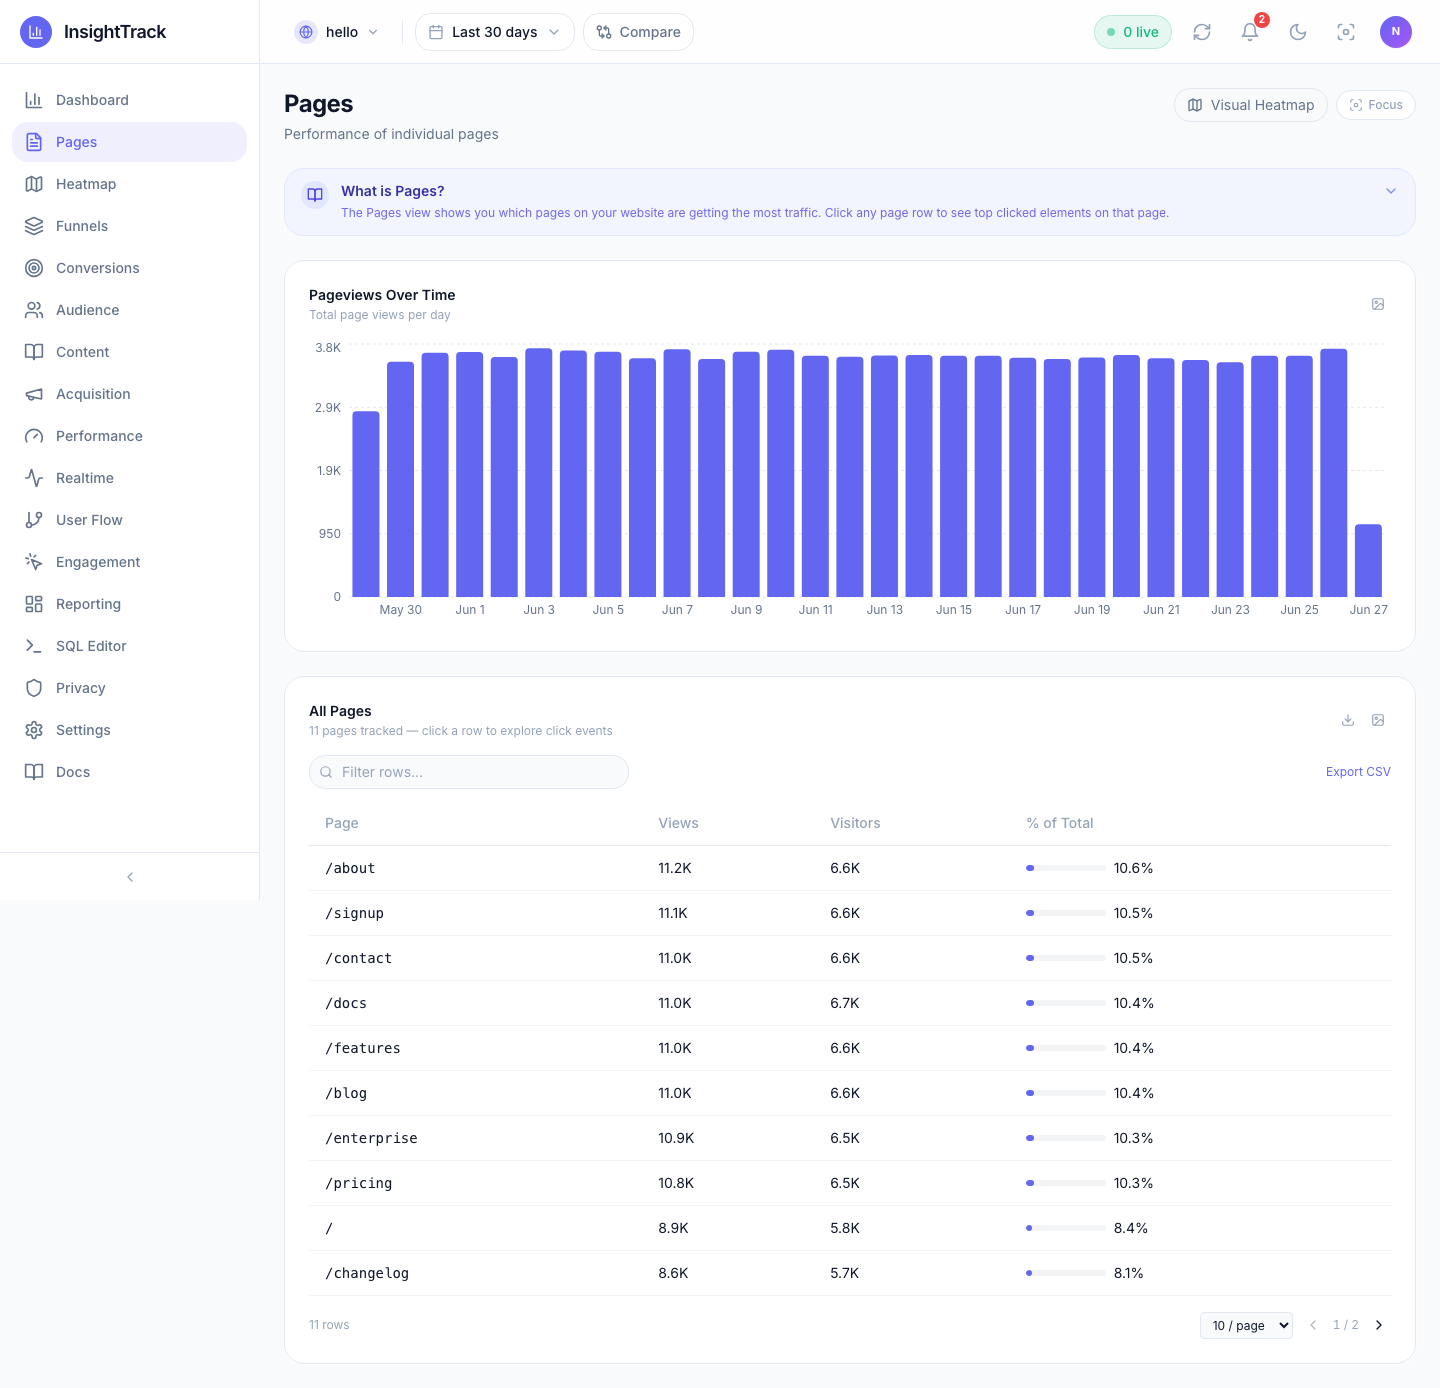
Pages — every tracked URL with views, unique visitors, and % of total. Sortable, filterable, CSV/JSON export.
🔍 Search Visibility — why your traffic changed
Web analytics tells you what happened to a page. A rank tracker tells you what
happened in the search results. Neither explains the link. Search Visibility
joins them:
"Traffic to /guides/email-templates dropped 33% this week (616 → 413 views).
Likely cause: rank slipped #3 → #6 on 'free email templates' and a new AI
Overview now cites competitorx.com and competitory.com instead of you."
Per page, on one card: the weekly traffic trend, the current Google position and
how far it moved, and whether Google's AI Overview cites you or your
competitors. Powered by SerpApi, cached so repeat views
cost no API credits.
The same correlation is available to Pulse and any MCP client asexplain_traffic_change — so you can just ask "why did traffic to /page drop
last week?" and get the joined answer.
No SerpApi key? It still runs. Leave SERPAPI_KEY blank and the feature
serves bundled sample SERPs, clearly labelled as such in the UI — the full
correlation works end to end for evaluation. Seedocs/search-visibility-connector.md.
Reporting Studio & SQL Editor
 |
 |
|---|---|
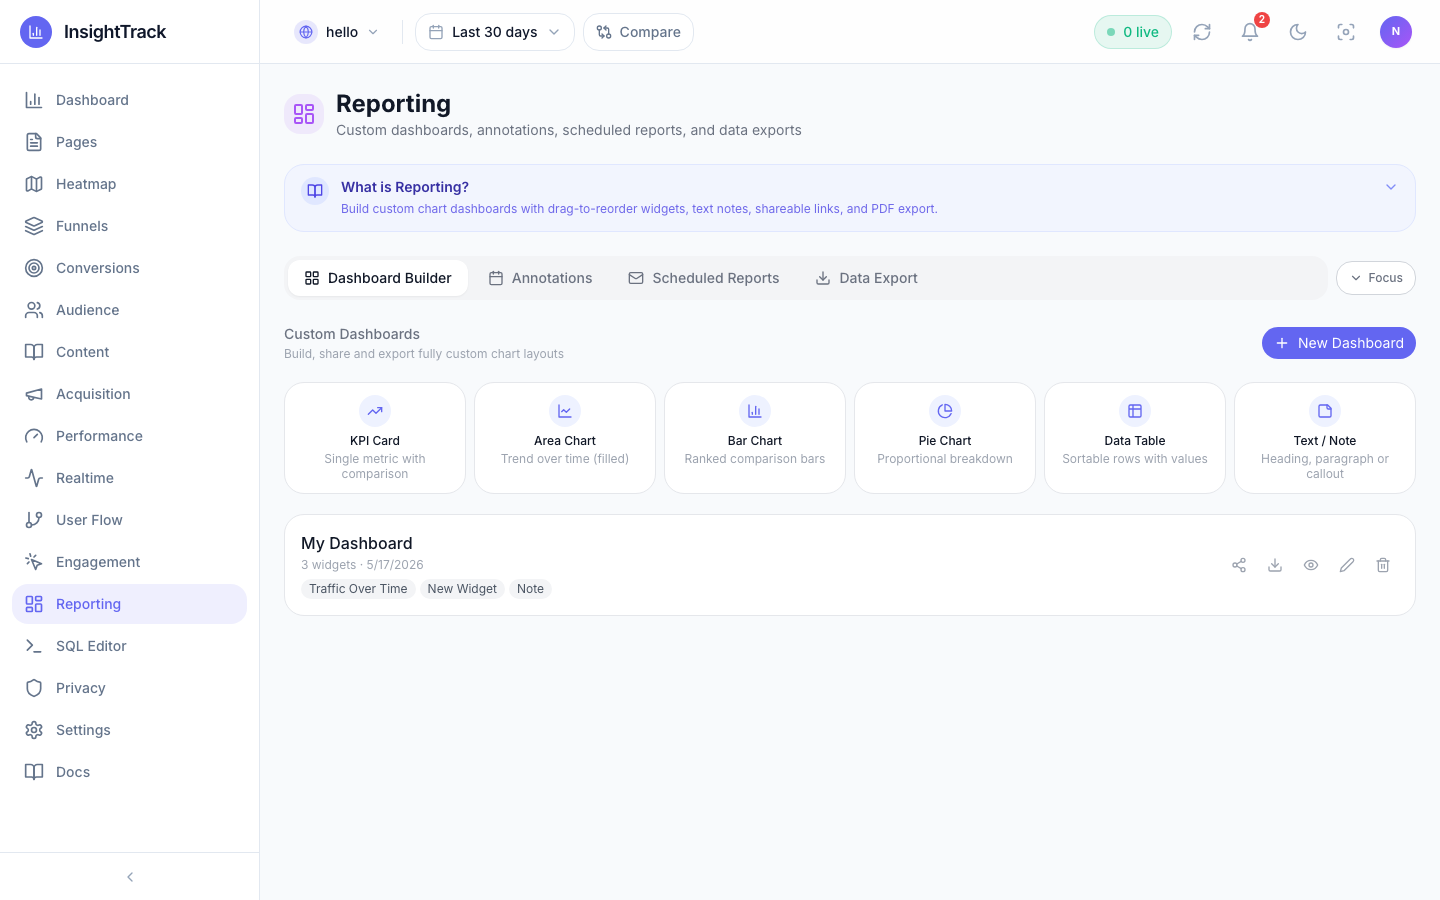
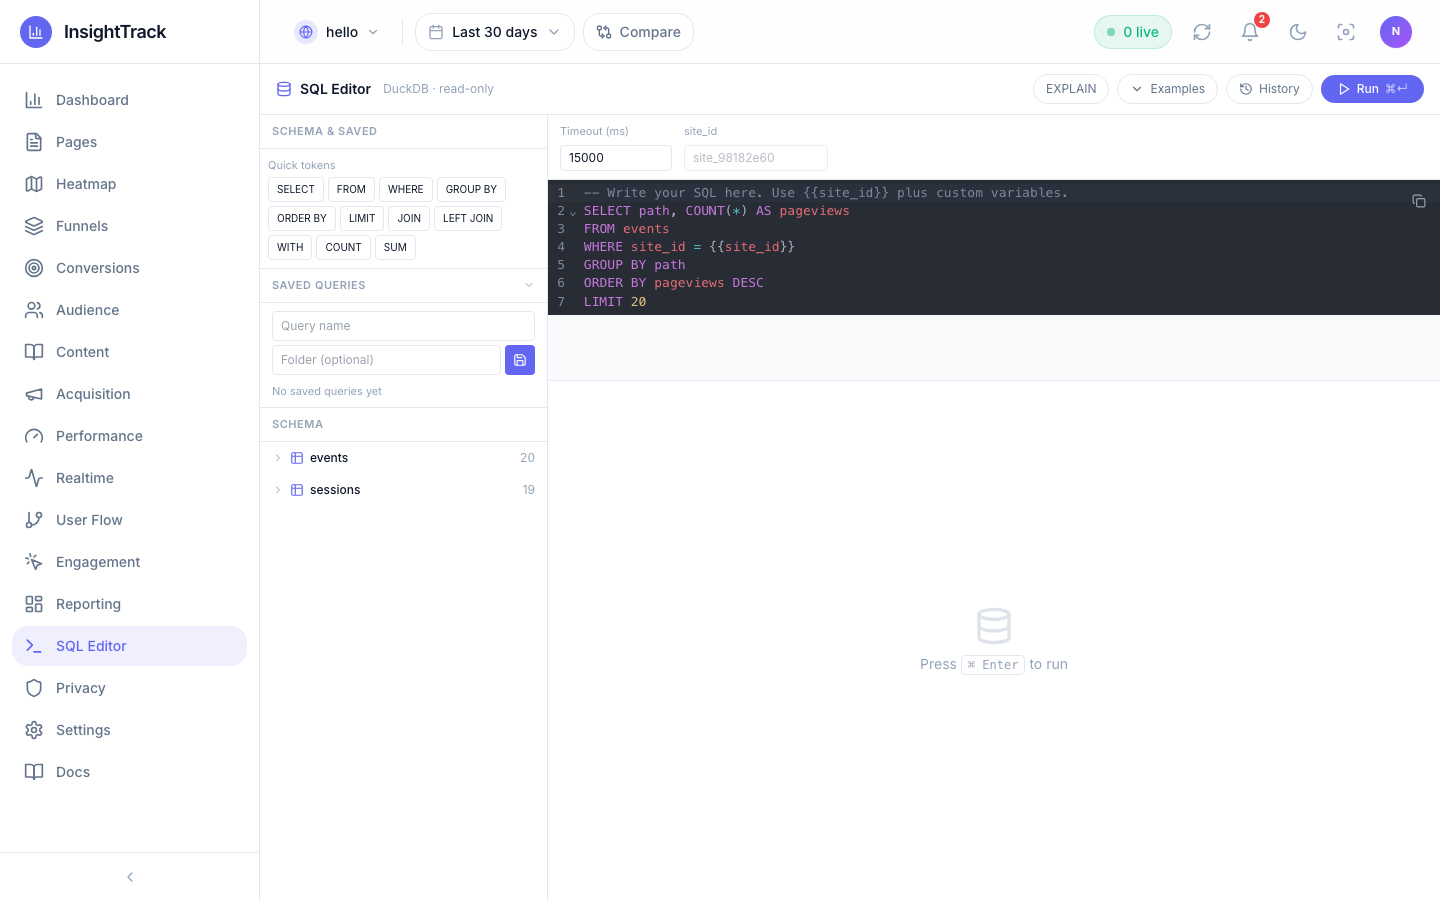
| Reporting Studio — drag-and-drop custom dashboards, scheduled email reports, shareable links. | SQL Editor — run read-only DuckDB queries directly against your analytics data, with schema browser and saved queries. |
User Flow & Dark Mode
 |
 |
|---|---|
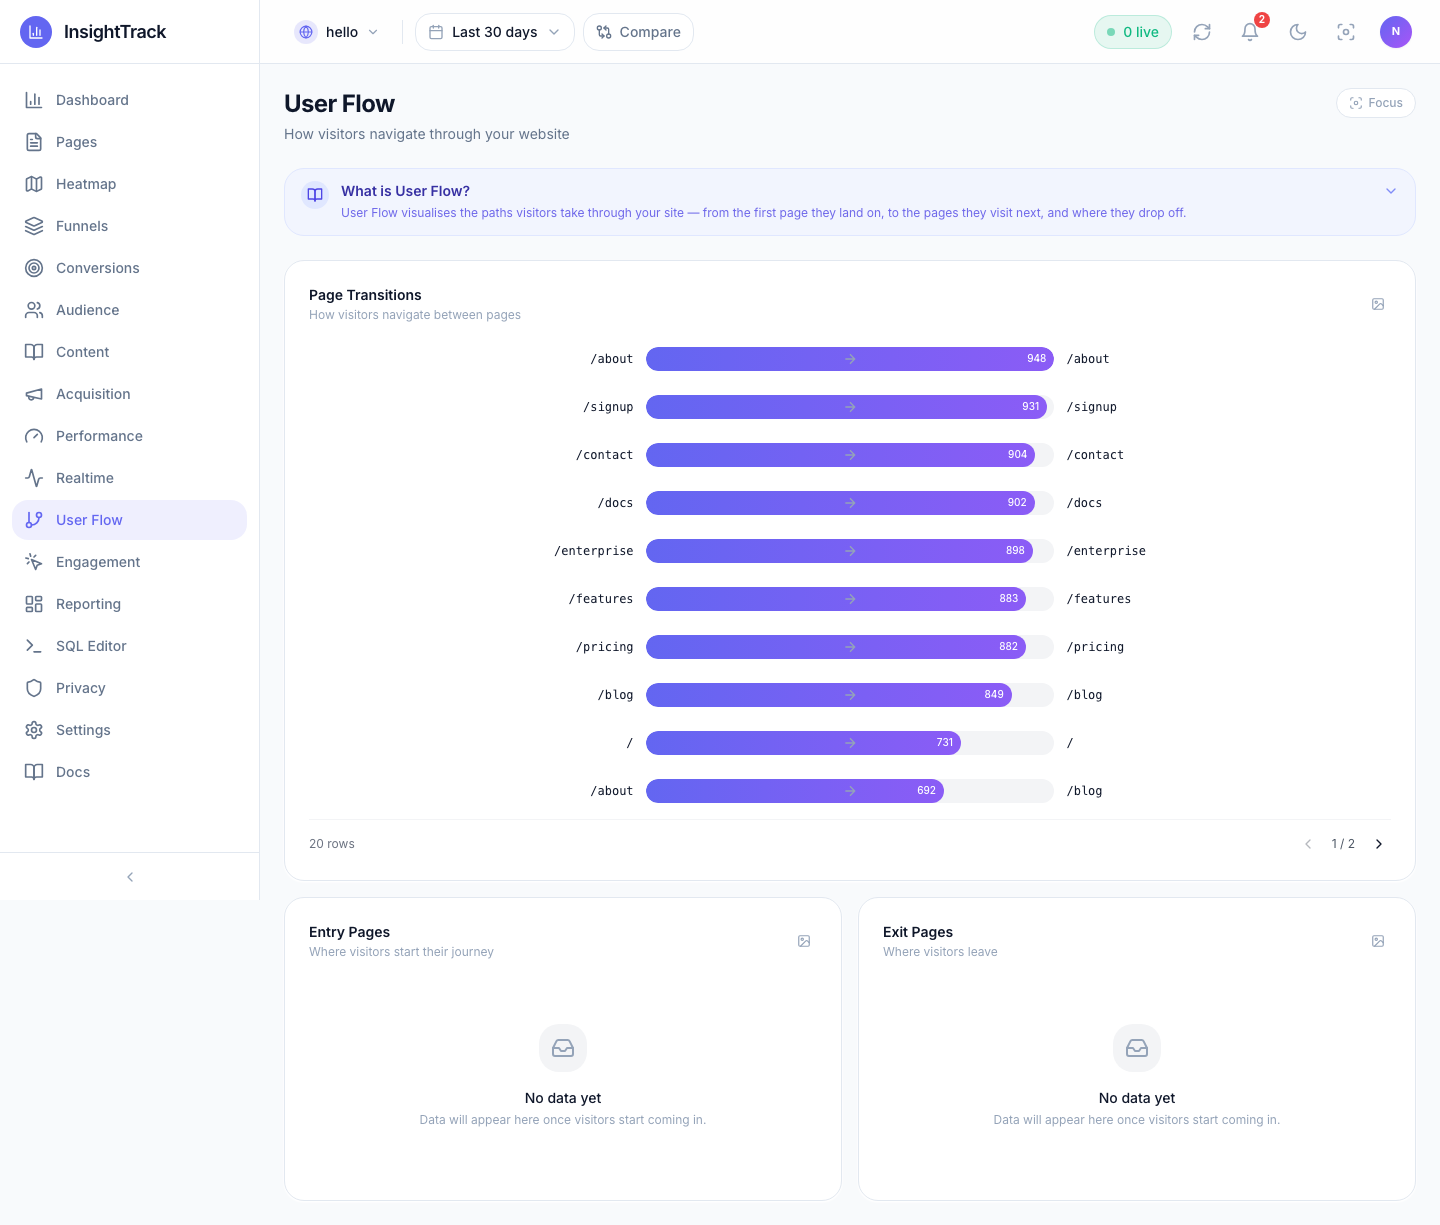
| User Flow — how visitors move between pages, entry → transitions → exits. | Dark mode — full app theming, system-preference aware. |
Team, Settings & Profile
 |
 |
|---|---|
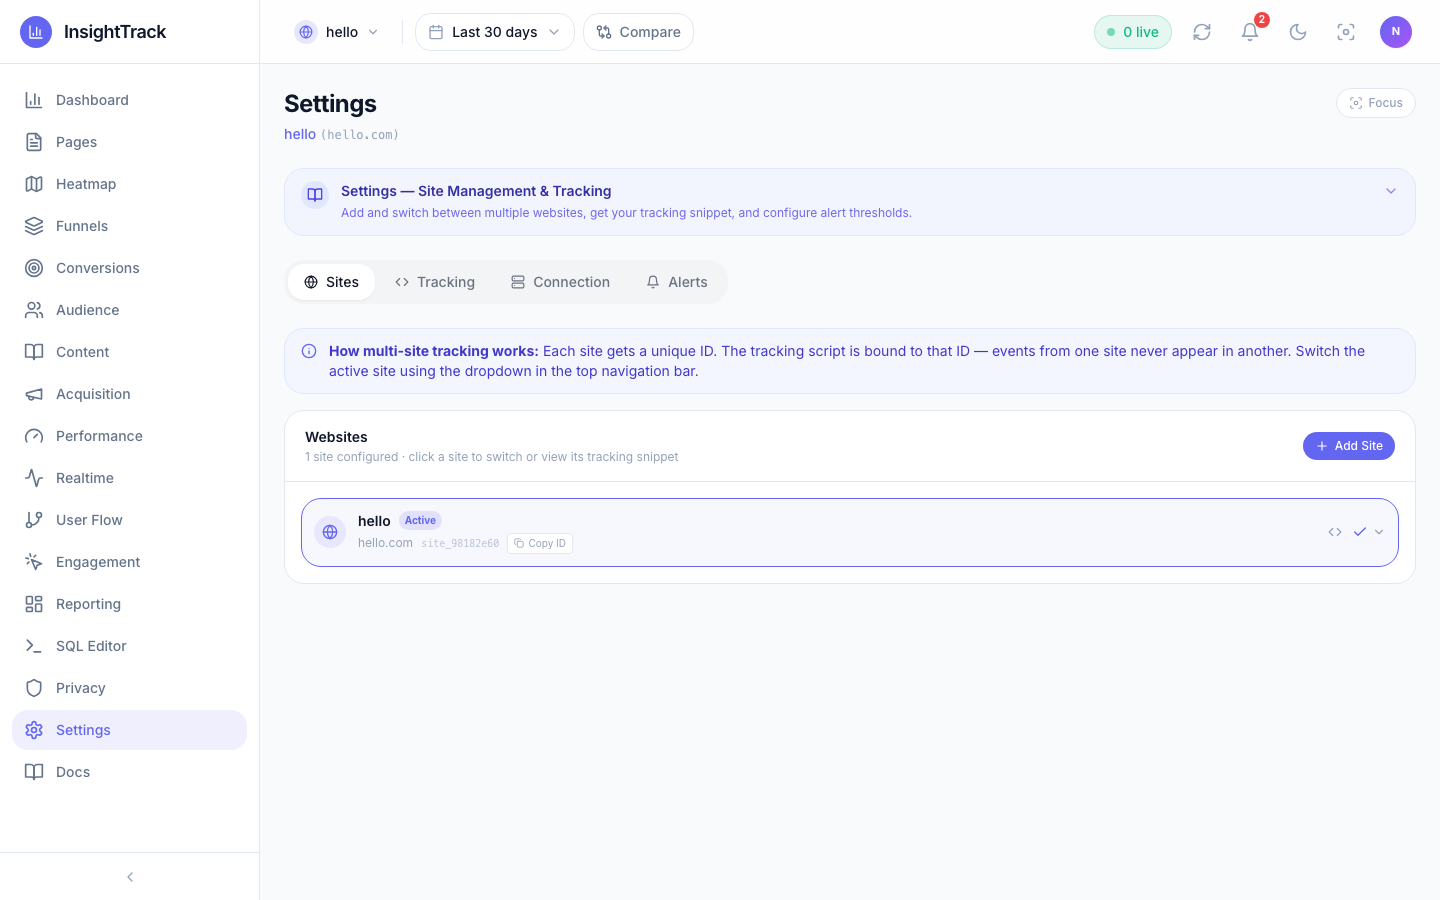
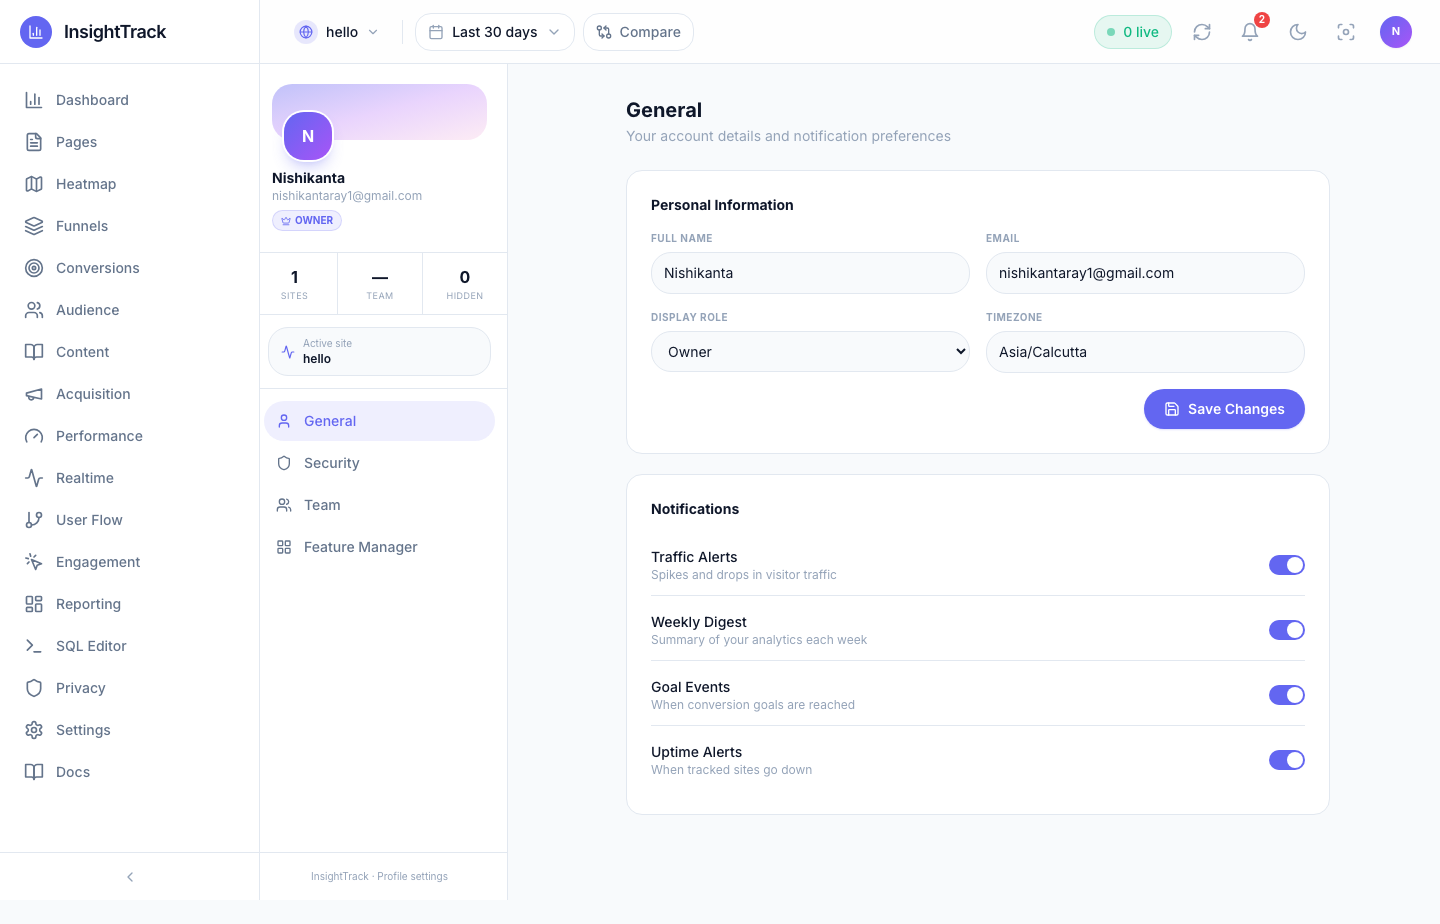
| Settings — manage multiple sites, copy the tracking script, configure traffic-spike alerts. | Profile — General, Security, Team (invite members, custom roles), and per-member Feature Manager. |
Team access, custom roles, and the live-demo join flow are documented in docs/team-access.md.
🛳️ Deploy Your Own
Docker (fastest)
git clone https://github.com/NishikantaRay/InsightTrack.git
cd InsightTrack
cp .env.example .env
docker-compose up --build -d
This builds the apps/analytics-api backend (:3001), the apps/dashboard-web UI (:4173), a demo site (:8080), PostgreSQL (:5432), and pgAdmin (:5050).
Manual
# Backend
cd apps/analytics-api
cp .env.example .env        # set PG_* / DATABASE_URL, JWT_SECRET, APP_BASE_URL
npm install && npm run migrate && npm run init && npm start   # :3001

# Frontend
cd apps/dashboard-web
npm install && npm run build && npm run preview               # :4173
Cloud (Railway / Render + Vercel / Cloudflare Pages)
- Backend → Railway or Render. Add a PostgreSQL plugin (sets
DATABASE_URL), set Root Dir toapps/analytics-api, Start commandnpm run migrate && npm run init && npm start, and attach a volume at/datafor the DuckDB file. - Frontend → Vercel, Cloudflare Pages, or Netlify. Root Dir
apps/dashboard-web, buildnpm run build, outputdist, and setVITE_API_URLto your backend URL.
Full production guide (Nginx, SSL, backups, env vars): docs/deployment.md
🔑 Key Environment Variables
| Variable | Default | Description |
|---|---|---|
PORT |
3001 |
API server port |
DATABASE_URL |
postgresql://…@localhost:5432/analytics |
PostgreSQL connection string |
JWT_SECRET |
(set in production) | Secret for signing JWTs (≥ 32 random bytes) |
APP_BASE_URL |
http://localhost:4173 |
Frontend URL for team invite links |
DEMO_SITE_DOMAIN |
hello.com |
Domain of the public demo site for the "Open live dashboard" CTA |
DUCKDB_PATH |
duckdb/analytics.duckdb |
Path to the DuckDB file (use a volume in production) |
DUCKDB_POOL_SIZE |
4 |
DuckDB connection pool size |
SYNC_DEBOUNCE_MS |
5000 |
Debounce window before PG→DuckDB sync after a tracking event |
CORS_ORIGINS |
localhost:4173,… |
Comma-separated allowed origins |
🗂️ Project Structure
InsightsTrack/
├── apps/
│   ├── analytics-api/             # Backend: Express + PostgreSQL + DuckDB (:3001)
│   │   └── src/{db,routes,services,queries,sync,schema,mcp}/
│   ├── dashboard-web/             # React 18 + Vite + Tailwind dashboard (:4173)
│   ├── mcp-server/                # stdio MCP bridge (Claude Desktop / Cursor)
│   └── mcp-toolkit-core/          # OpenAPI→MCP mapping engine
├── archive/analytics-api-legacy/  # Legacy write/auth service (reference)
├── examples/                      # demo-blog · demo-site · demo-website
├── scripts/                       # seed-live-demo.js, helpers
├── screenshots/                   # Product screenshots used in this README
├── docs/                          # Full documentation
└── docker-compose.yml             # Full stack
🧱 Tech Stack
| Layer | Technology |
|---|---|
| Frontend | React 18, Vite 5, Tailwind CSS 3, Recharts, Zustand, React Router 6 |
| Backend | Node.js 20, Express 4 |
| Write DB | PostgreSQL 16 — tracking events, auth, sites, teams |
| Read DB | DuckDB (embedded columnar) — analytics queries |
| Auth | JWT (7-day expiry), bcrypt |
| Caching | In-memory TTL cache + request coalescing |
| Testing | Vitest, Supertest, Playwright |
🔌 API Overview
| Group | Key Endpoints | DB |
|---|---|---|
| Auth | POST /api/auth/register · /login · GET /api/auth/me |
PostgreSQL |
| Sites | GET/POST /api/sites · GET /api/sites/:id/script |
PostgreSQL |
| Tracking | POST /api/track/event · /pageview · /batch · GET /api/track/pixel.gif |
PostgreSQL |
| Analytics | /api/analytics/:siteId/{kpi,traffic,top-pages,sources,devices,countries,realtime,user-flow,funnel,…} |
DuckDB |
| Engagement | /engagement/{scroll-depth,rage-clicks,heatmap,time-on-page} |
DuckDB |
| Performance | /performance/{web-vitals,errors,errors-over-time} |
DuckDB |
| Team | /api/team/:siteId/{members,invite,roles} · /api/demo/join |
PostgreSQL |
| Pulse (AI) | POST /api/assistant/chat (SSE) · GET /api/assistant/{status,threads} · PUT /api/assistant/settings |
DuckDB (read-only tools) |
| MCP | POST /api/mcp/http (JSON-RPC 2.0) · /api/mcp/connect · /api/mcp/run |
DuckDB (read-only tools) |
| Search | /api/search/:siteId/{overview,explain,rankings,ai-overview,related,keywords} |
DuckDB + SerpApi (cached) |
All analytics endpoints accept ?dateRange=today|7d|30d|90d|custom:YYYY-MM-DD:YYYY-MM-DD.
Full reference: docs/api-reference.md
📚 Documentation
| Document | What's inside |
|---|---|
| Getting Started | Setup from scratch |
| Running Locally | Detailed local dev walkthrough |
| Deployment | Production: Docker, Nginx, SSL, Railway |
| Tracking Script | How tracking works, SPA support, custom events |
| API Reference | Full REST API with examples |
| Architecture | System design & data flow |
| Team Access | Multi-user, custom roles, live-demo flow |
| Visual Heatmap | Heatmap feature deep-dive |
Running Tests
cd apps/analytics-api && npm test                 # backend (Vitest + Supertest)
cd apps/dashboard-web && npm test                 # frontend unit tests
cd apps/dashboard-web && npm run test:e2e         # end-to-end (needs the stack running)
❤️ Support
InsightsTrack is free and open source. If it's useful to you, please consider
sponsoring on GitHub — it directly
funds new features, maintenance, and keeping the project free for everyone.

A ⭐ on the repo also helps a lot!
Citing this software
Archived on Zenodo. If you use InsightTrack in academic work, please cite it:
@software{ray_insighttrack,
  author  = {Ray, Nishikanta},
  orcid   = {0009-0006-8210-5093},
  title   = {{InsightTrack: a self-hosted web analytics platform
             with a dual-database architecture}},
  year    = {2026},
  version = {1.0.0},
  doi     = {10.5281/zenodo.22148654},
  url     = {https://github.com/NishikantaRay/InsightTrack}
}
The DOI above is the concept DOI — it always resolves to the latest release.
To cite v1.0.0 specifically, use 10.5281/zenodo.22148655.
Machine-readable metadata lives in CITATION.cff.
License
MIT — free to self-host, modify, and run forever.
Reviews (0)
Sign in to leave a review.
Leave a reviewNo results found