rocketplaneIO
Health Pass
- License — License: Apache-2.0
- Description — Repository has a description
- Active repo — Last push 0 days ago
- Community trust — 122 GitHub stars
Code Warn
- network request — Outbound network request in apps/web/app/(app)/clusters/[id]/alerts/page.tsx
Permissions Pass
- Permissions — No dangerous permissions requested
No AI report is available for this listing yet.
Self-hosted AI SRE for Kubernetes — zero-instrumentation eBPF observability plus a copilot that fixes issues through guardrailed, self-verifying actions. BYO-LLM, air-gapped capable.
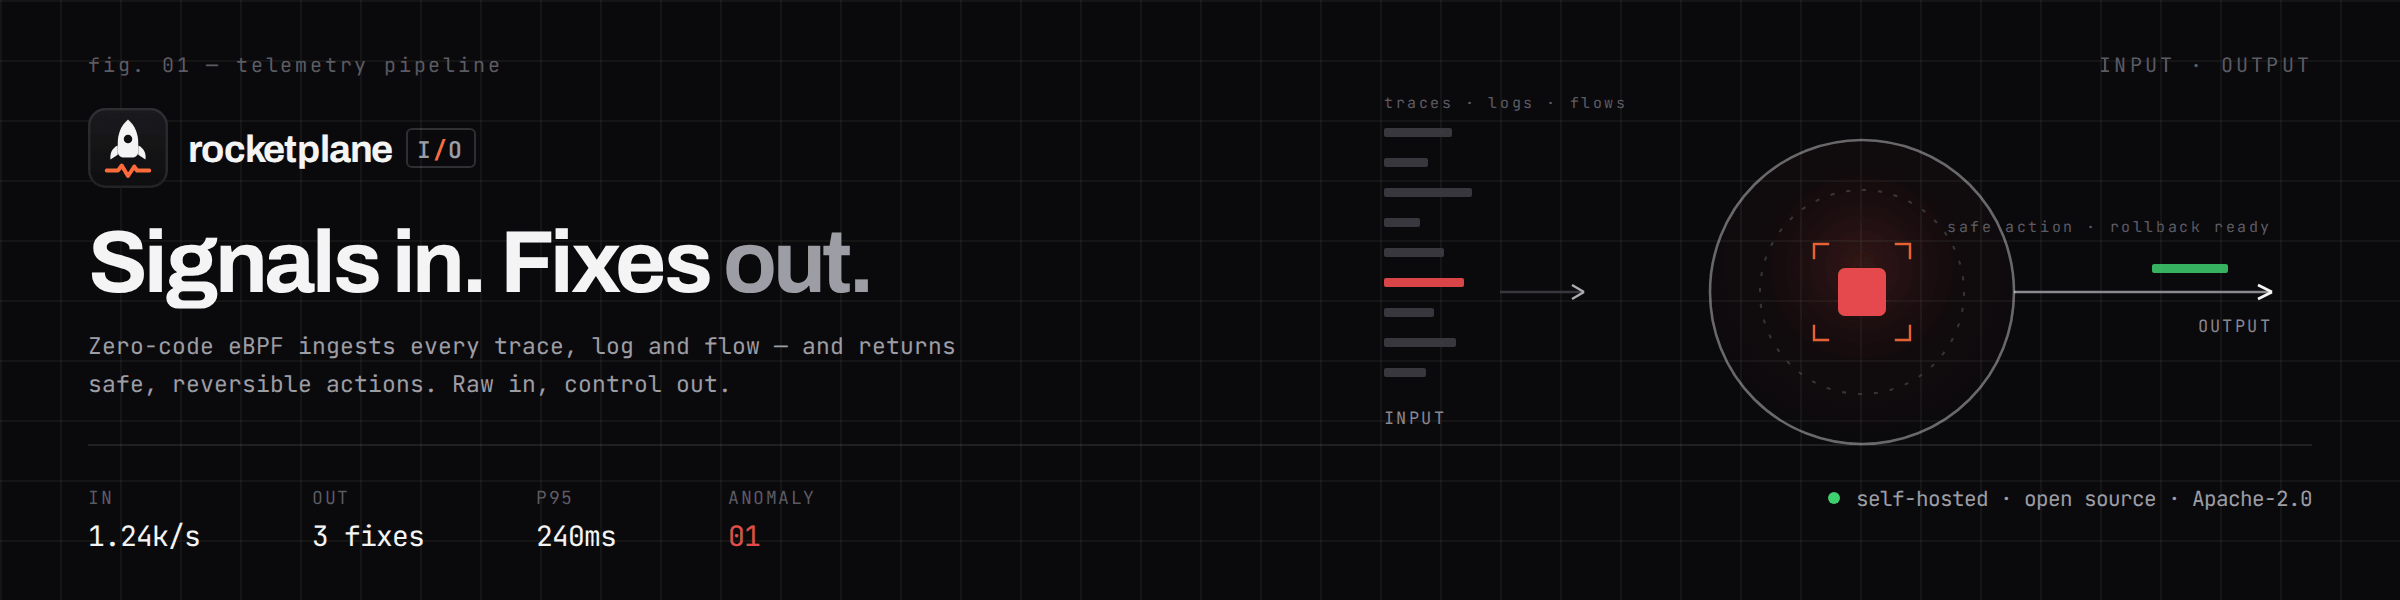
An AI SRE for your Kubernetes cluster —
that can actually fix things, safely.
Self-hosted · Apache-2.0 · bring your own LLM · air-gapped capable



Alpha. The full loop works end-to-end today, developed against minikube. APIs and schemas
still change without notice — don't point it at production yet.
Three things you don't get anywhere else
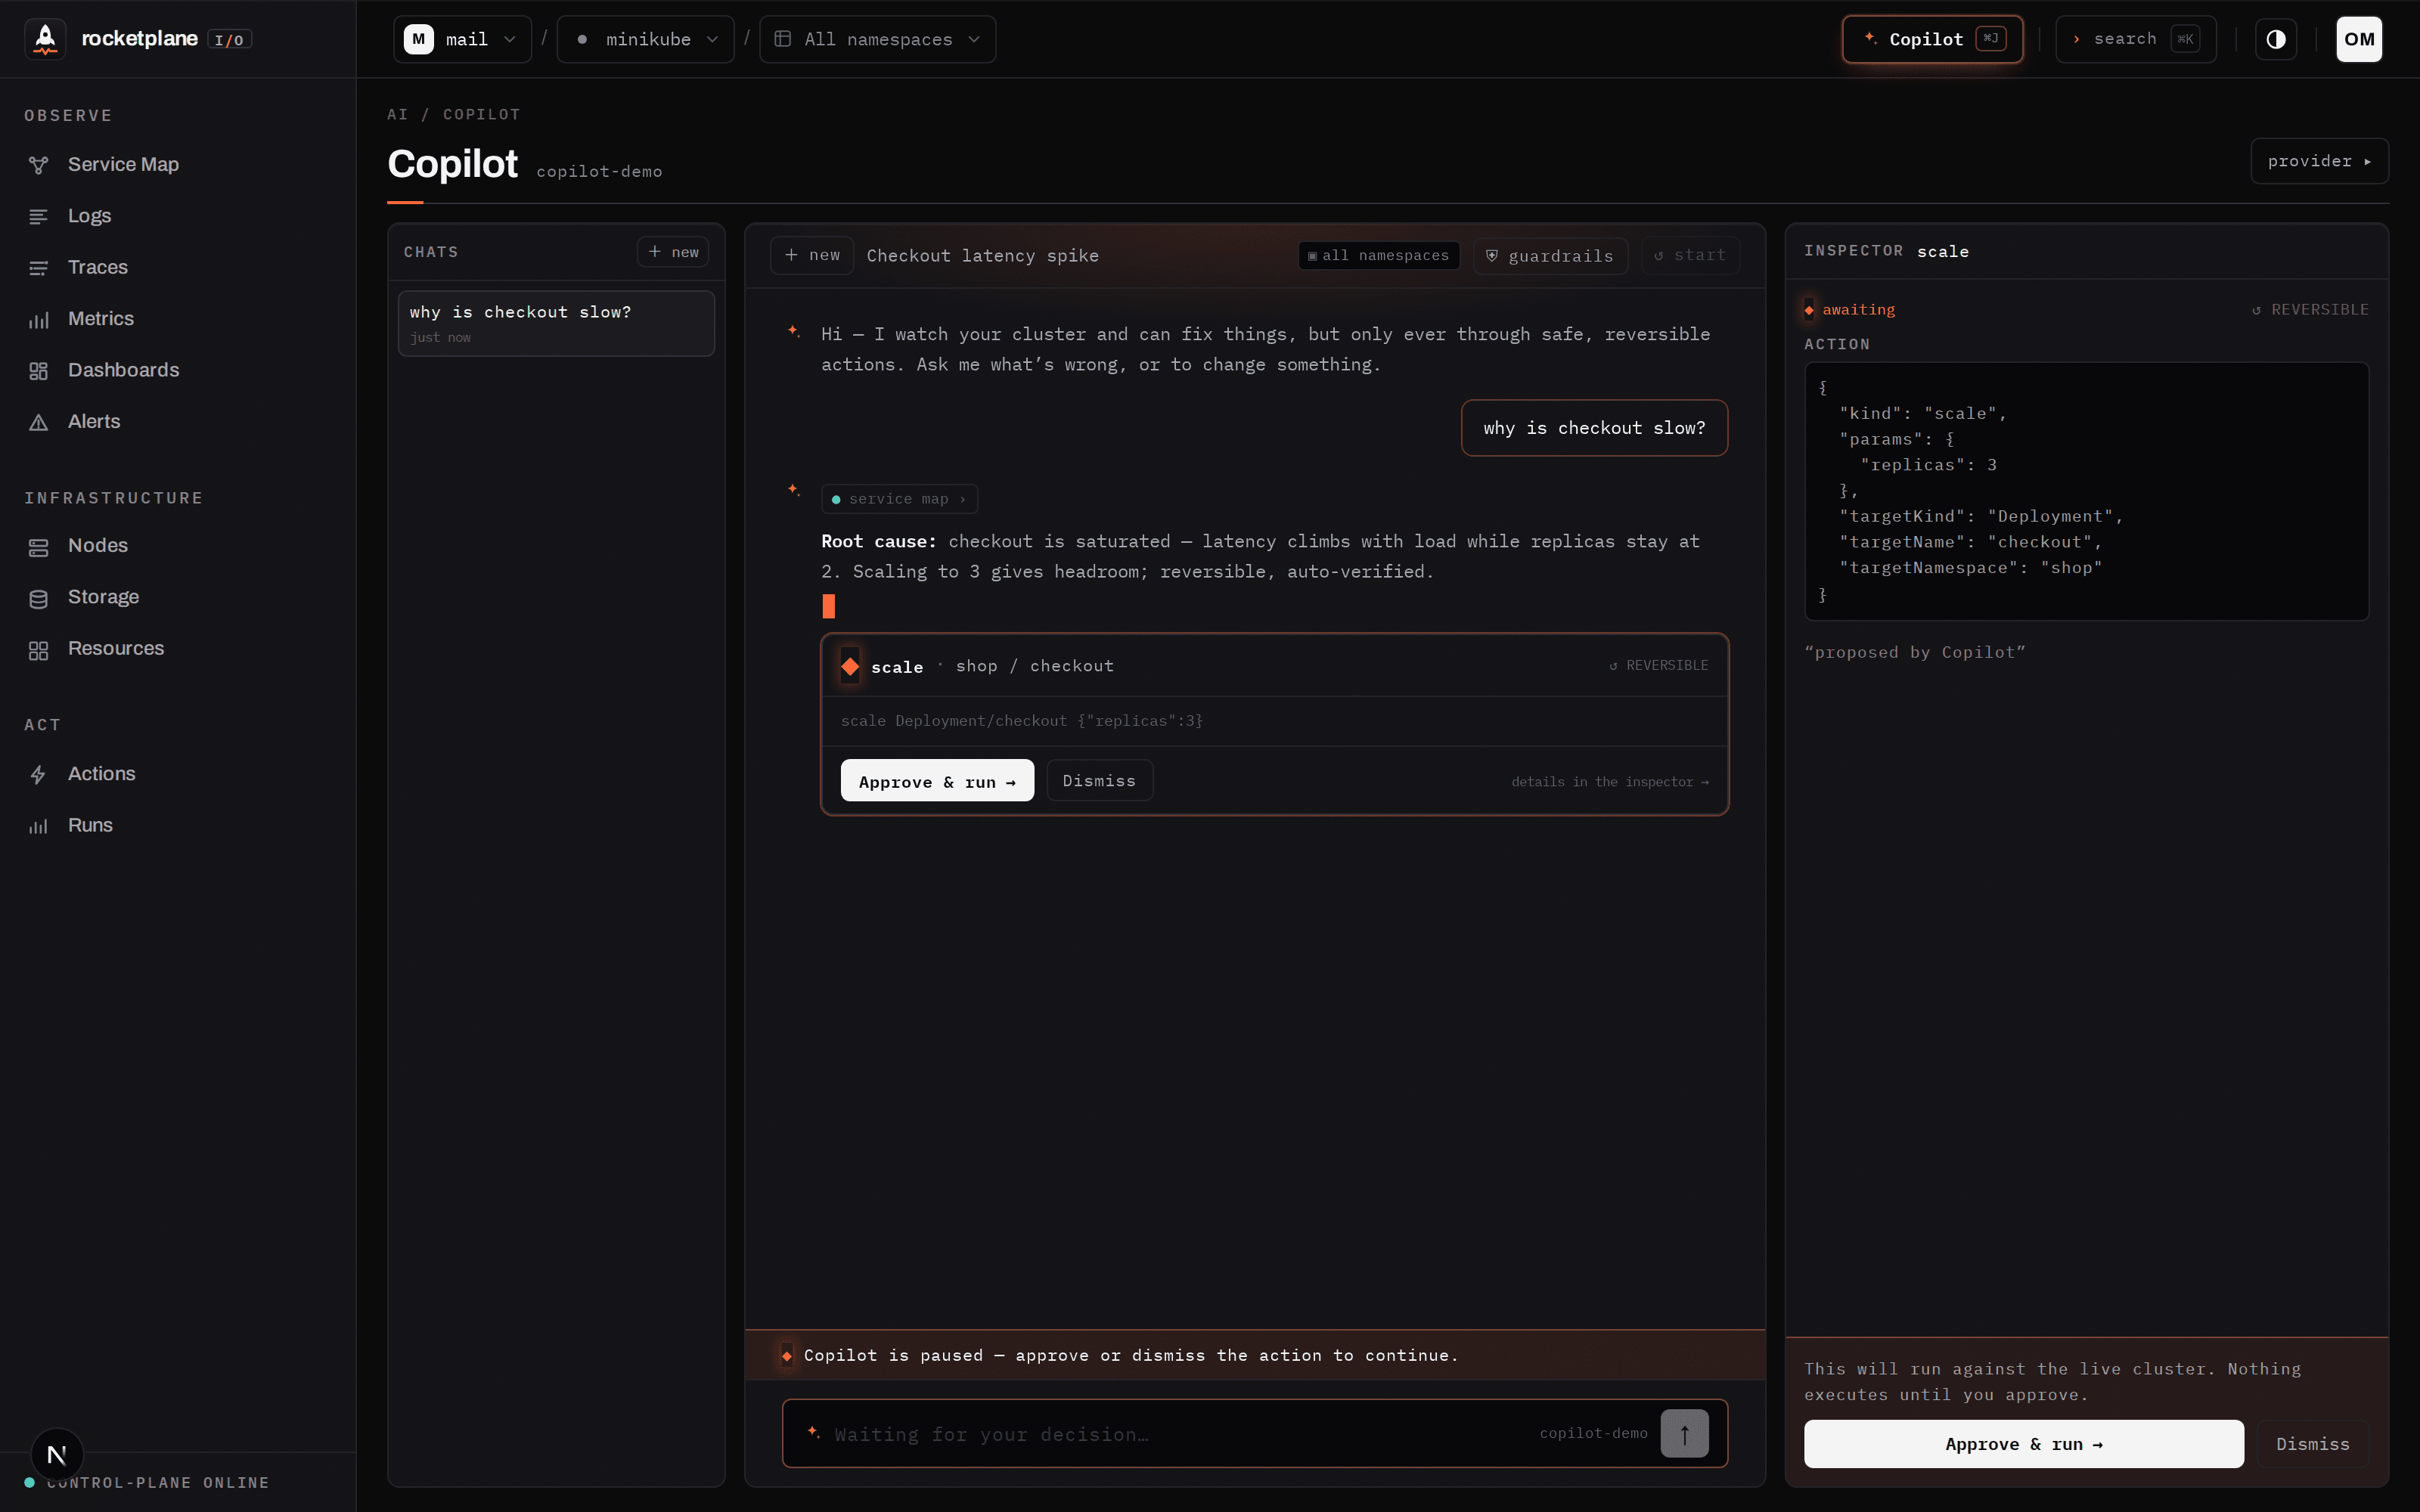
1 · An AI SRE with a safety catalog — not an AI with kubectl
The Copilot investigates on its own: eBPF traces, logs, PromQL metrics, the live service map and
the full Kubernetes inventory (Services, Ingress, ConfigMaps, policies — everything). But it
can only change the cluster through ~30 named, reversible action pipelines. No shell, nokubectl, no YAML it could hallucinate.
Every action is risk-graded — and you set the approval rule per level:
| Level | Examples | Default approval |
|---|---|---|
| ◎ read-only | debug bundle, rollout history, drain preview | runs automatically |
| ↺ reversible | scale up, restart, set image, config edits | one click |
| ◇ disruptive | evict pod, rollout undo, cleanup | one click |
| △ destructive | drain, scale-to-0, NoExecute taint | type the target's name to arm |
Risk is parameter-aware (scale replicas=3 is reversible; replicas=0 is destructive), scope is
enforced server-side (a namespace-scoped session cannot touch nodes or other namespaces), and
every level can be set to auto, click, confirm or off.
The model proposes. Deterministic pipelines execute, verify at pod level, and roll back.
The LLM never touches the cluster directly.
Bring any Anthropic- or OpenAI-compatible model — including a fully local, air-gapped one. Your
telemetry never leaves your infrastructure either way.
2 · Traces for services you never instrumented
One outbound-only agent plus an eBPF DaemonSet
(OTel eBPF Instrumentation, née Grafana Beyla). HTTP/gRPC
spans with cross-service context propagation — including compiled Go binaries — plus SQL,
Redis and Kafka client spans. No SDKs, no sidecars, no code changes.
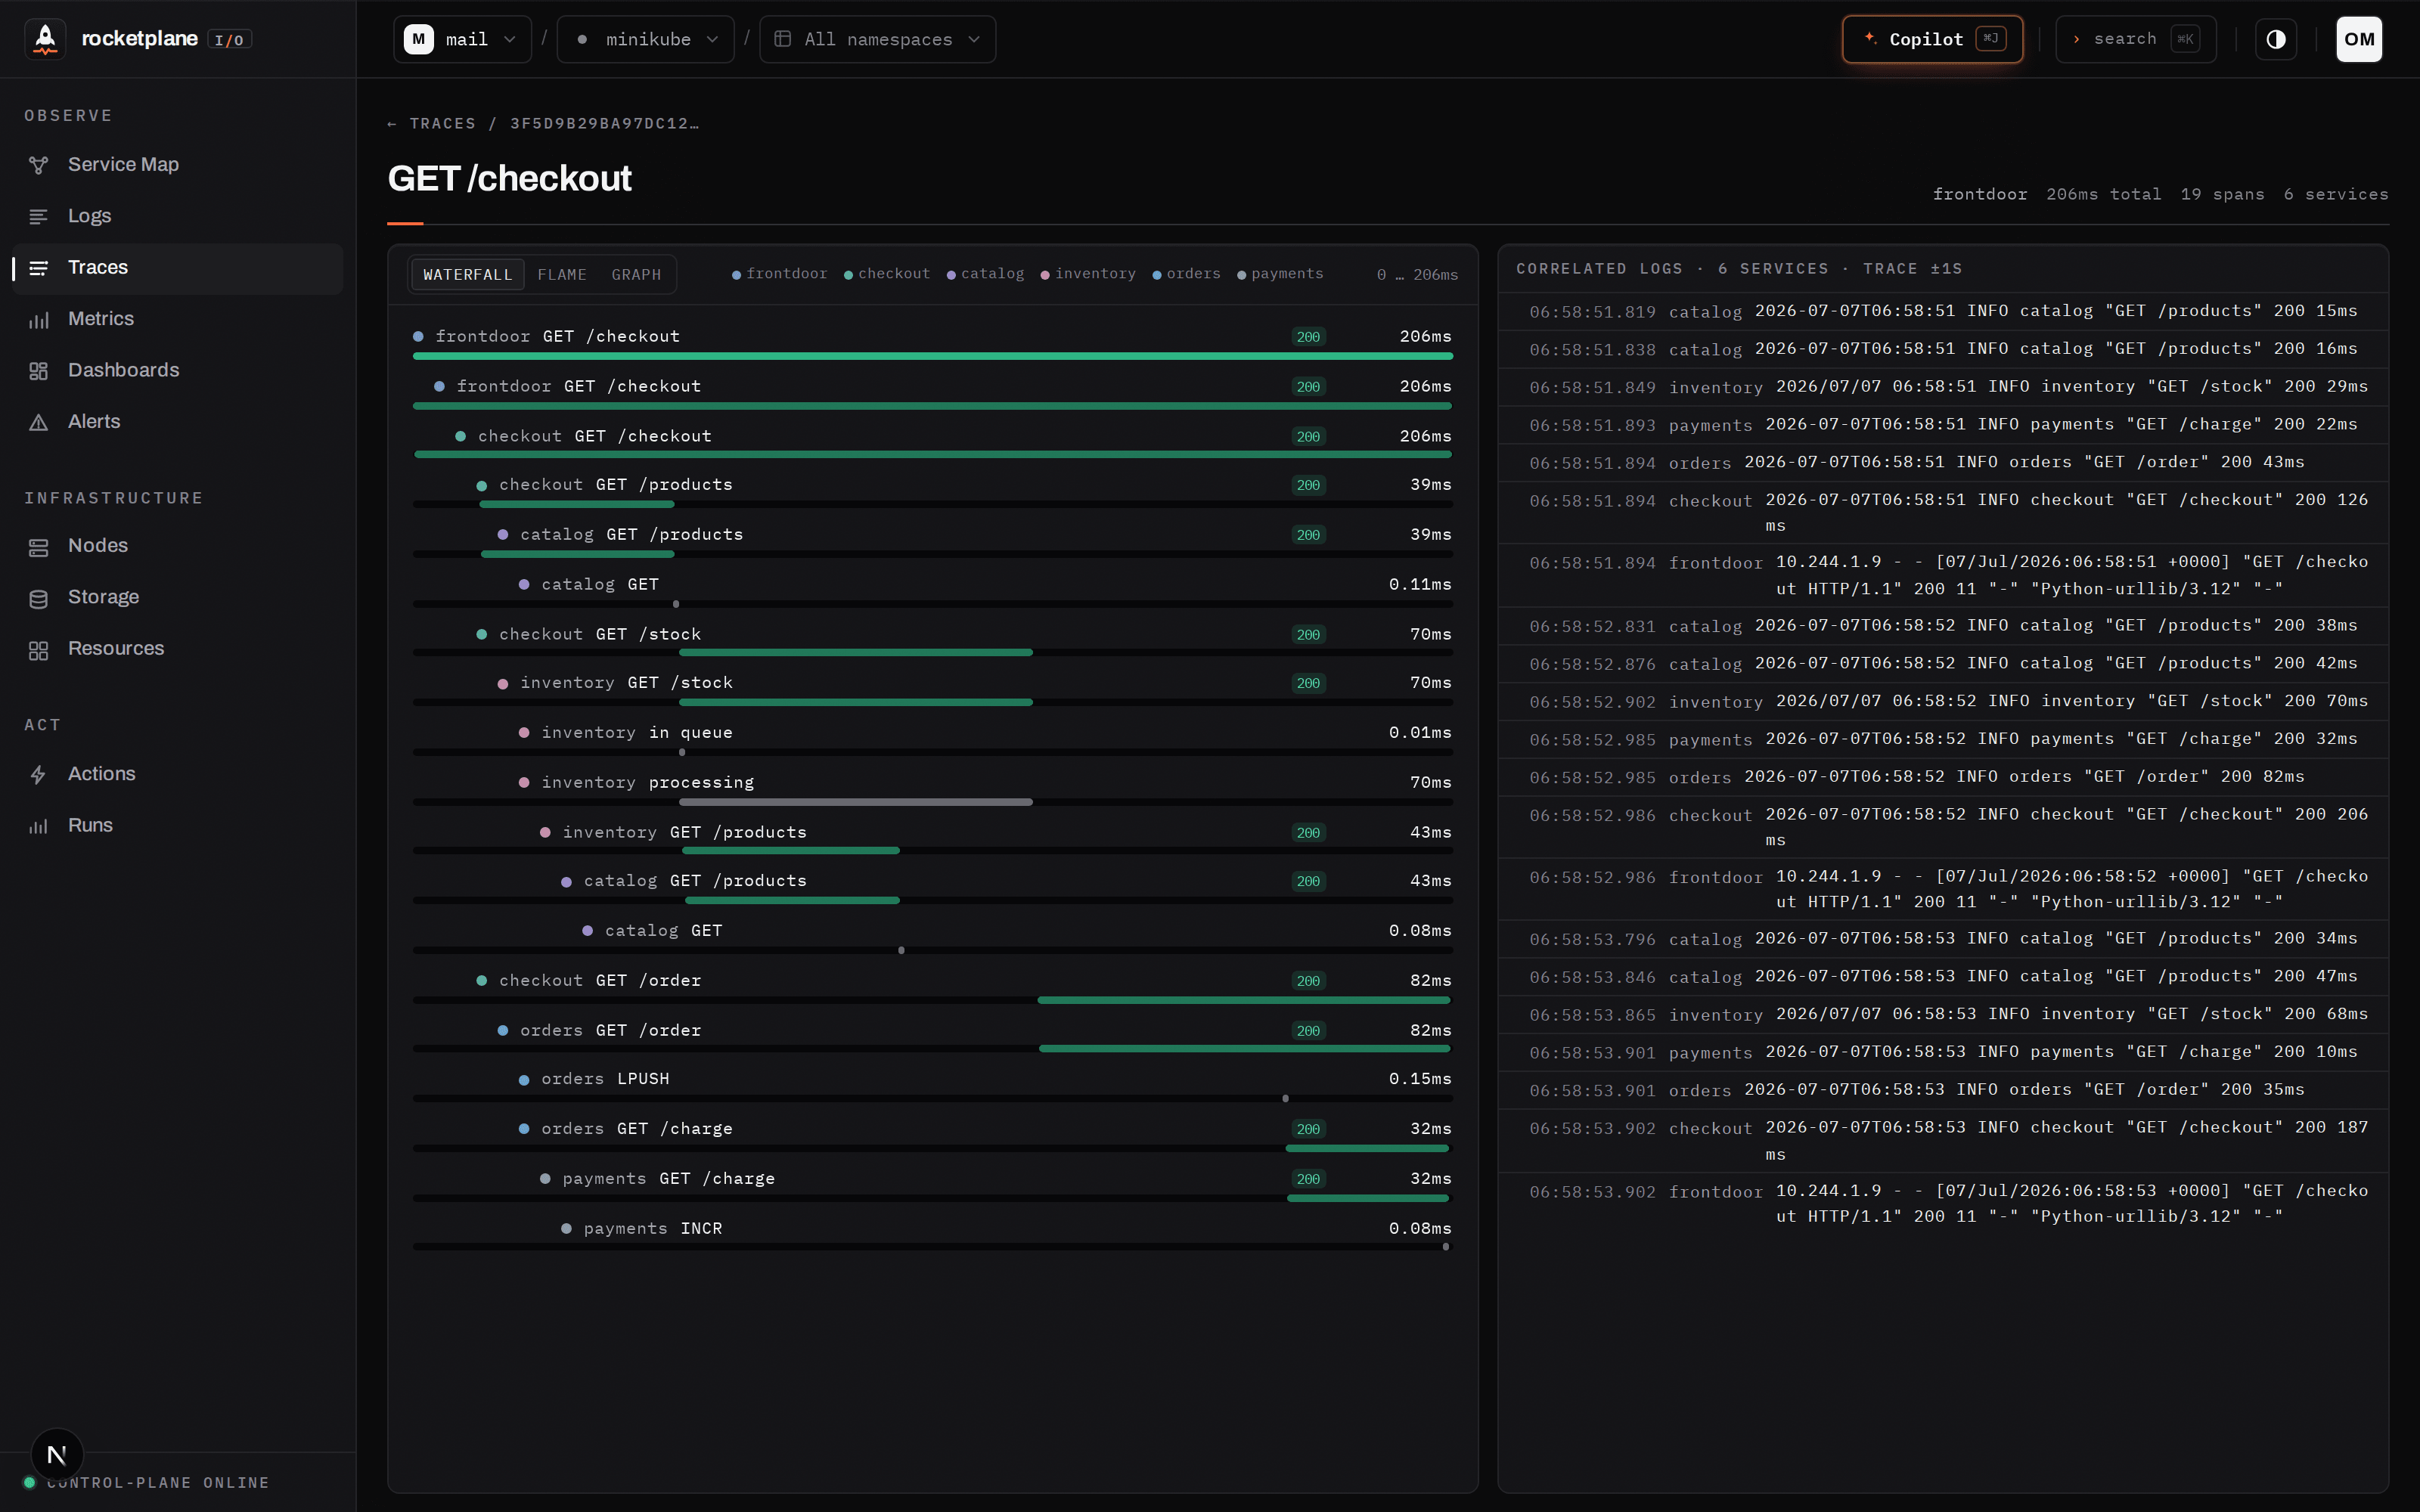
GET /checkout: the failure cascades frontdoor → checkout → catalog,
the exact ERROR log lines are correlated on the right. No SDK in any of these services.
An ERROR log line is two clicks away from this view. PromQL runs on the real Prometheus engine, embedded, on ClickHouse.3 · Every change proves itself — or undoes itself
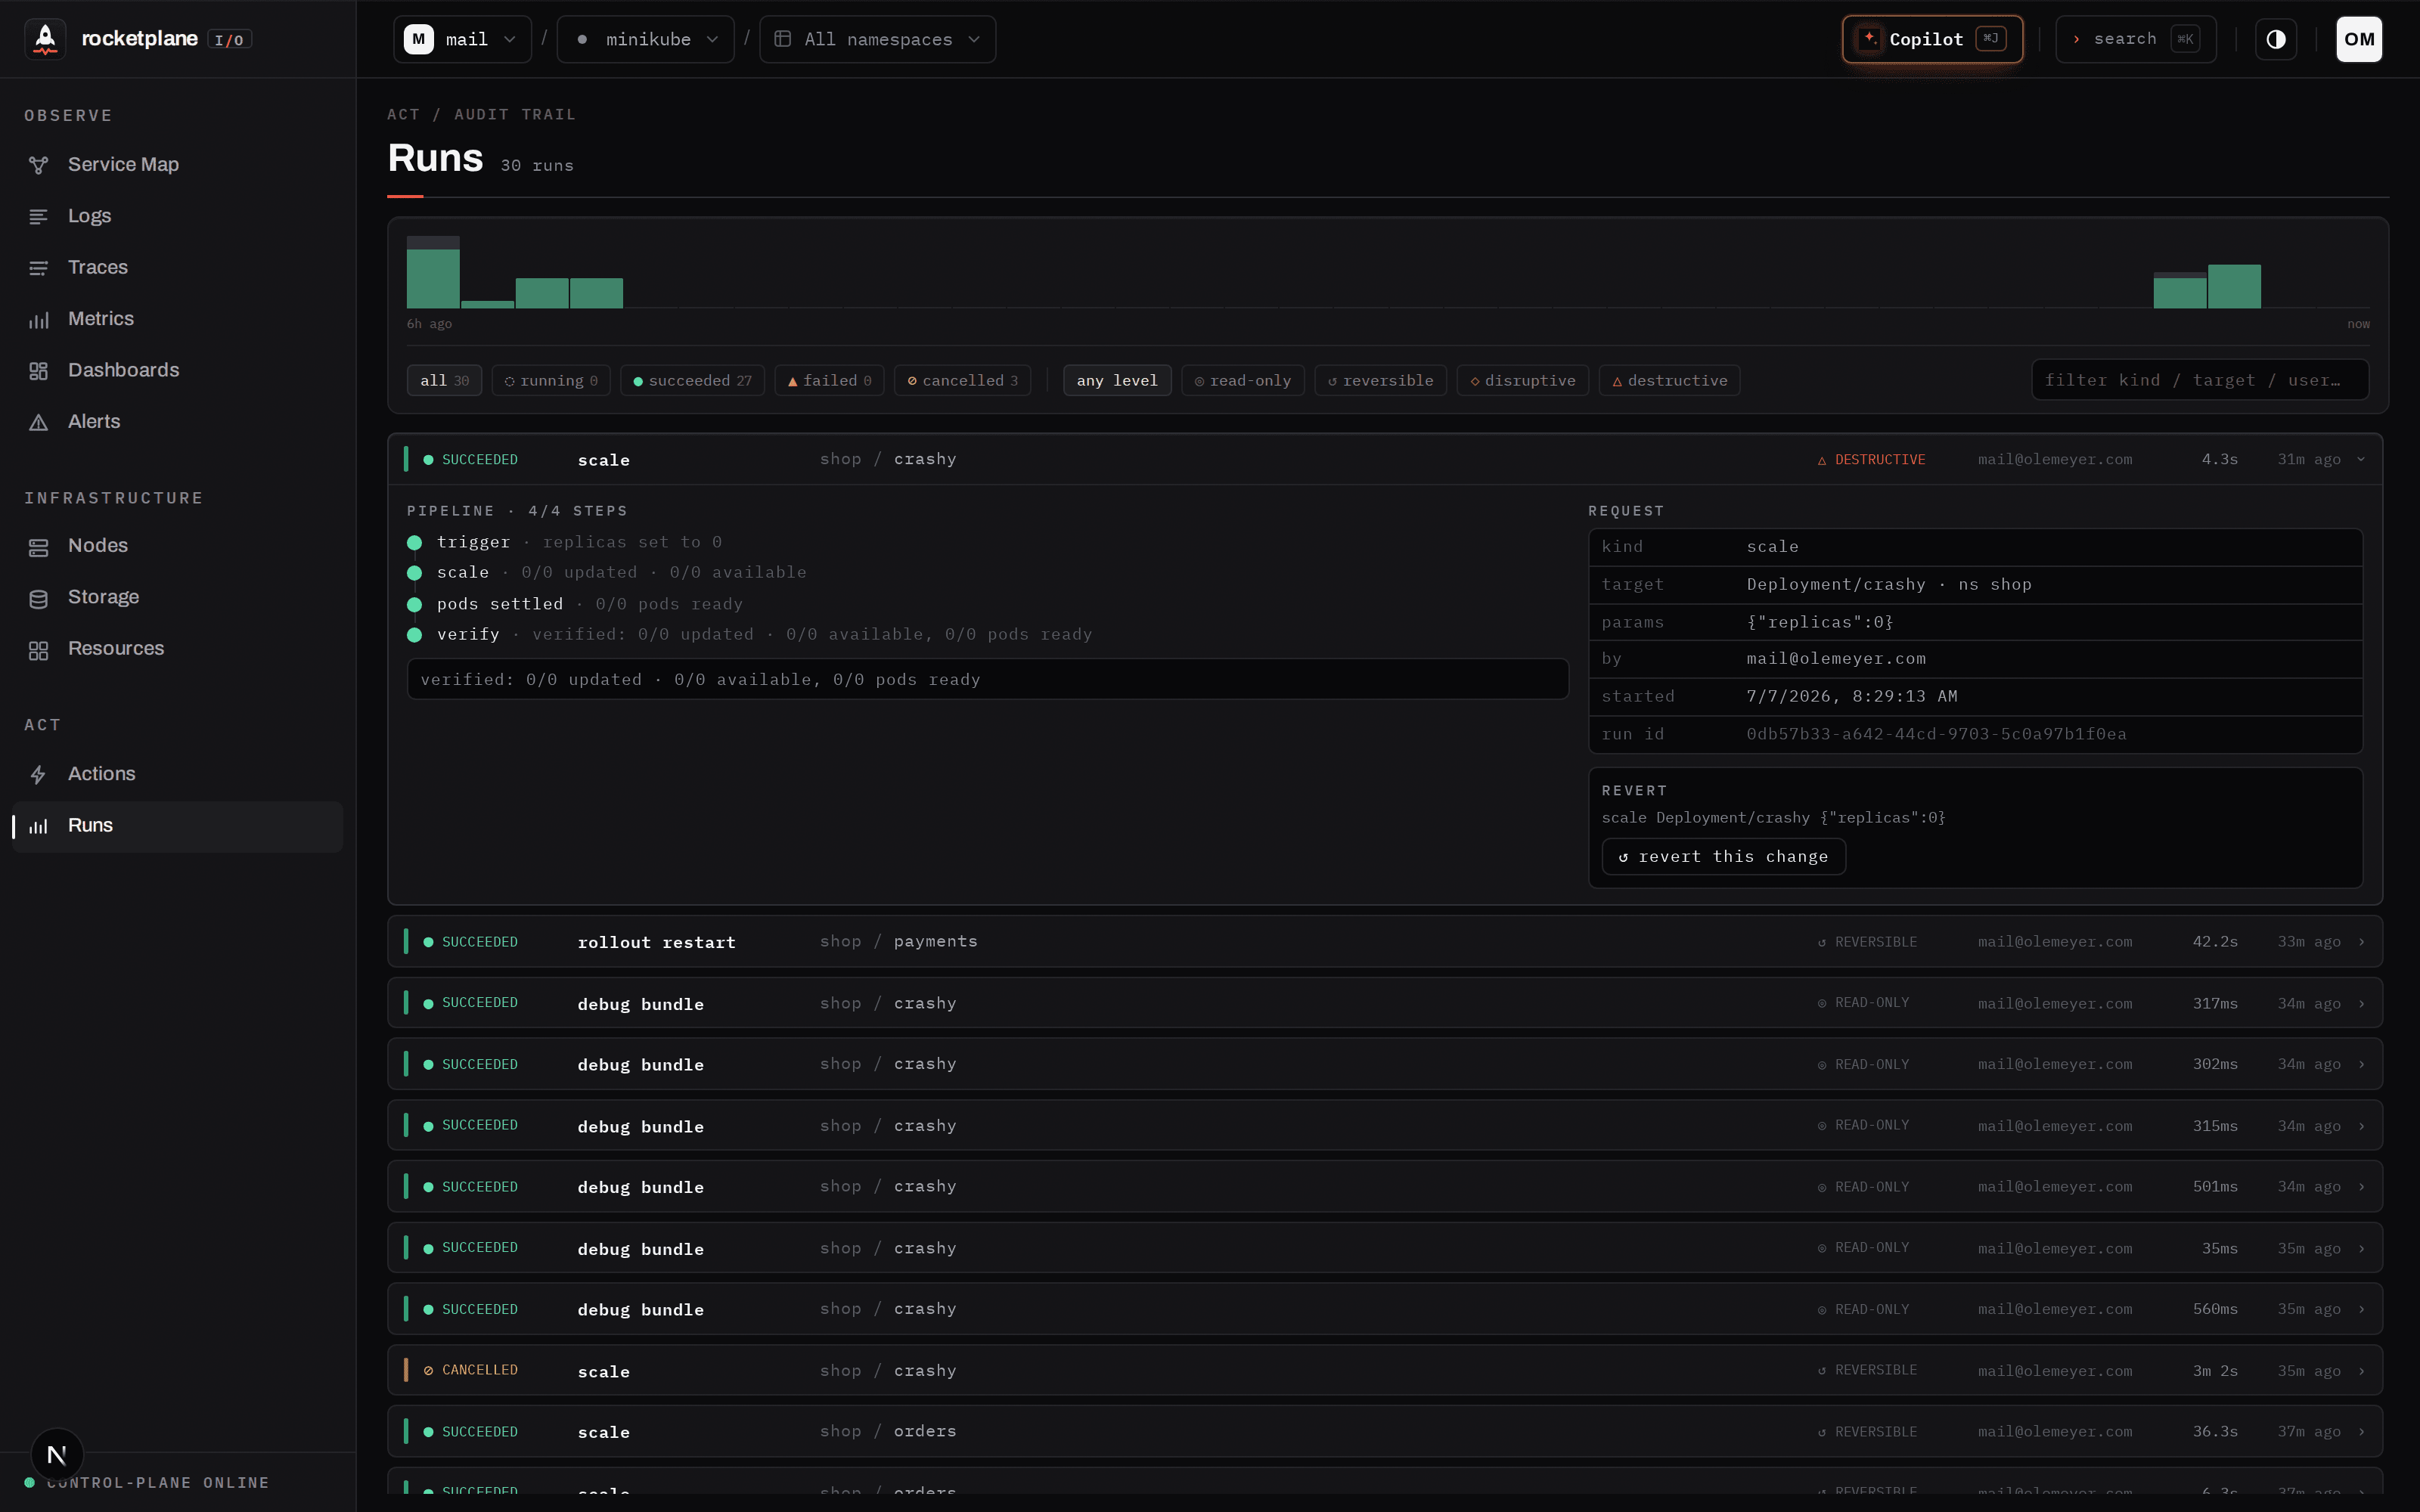
Actions aren't fire-and-forget kubectl calls. Each one is a pipeline —
trigger → observe → verify — that only reports success when the cluster actually converged:
old pods gone, new pods Ready, stable. Cancel, timeout or a failed verify triggers automatic
rollback from a snapshot taken before the mutation.
Quick start
No published container images yet — you run the platform from source (that's the alpha part).
With Go 1.25+, Node 22+/pnpm and Docker installed:
git clone https://github.com/olemeyer/rocketplaneIO && cd rocketplaneIO

# 1 — data stores + OTLP collector (Postgres, ClickHouse — defaults just work)
docker compose -f deploy/compose/docker-compose.yml up -d

# 2 — control plane on :8090
go run ./services/controlplane/cmd/controlplane &

# 3 — web UI on :4173
pnpm install && pnpm dev
Open http://localhost:4173, create the owner account, hit Connect cluster — it hands you
one copy-paste kubectl command that installs the agent and the Beyla DaemonSet. When the service
map draws your namespaces and spans appear under Traces, you're live — without touching a line of
your code.
Copilot: open it from the top bar and connect any LLM provider — the key stays on your
instance, requests go straight from your control plane to the provider you chose.
Demo workload: a Python + Redis shop behind nginx that generates real traffic, errors and
slow queries — the workload every screenshot here was taken from:
kubectl apply -f deploy/dev/shop-realistic.yaml -f deploy/dev/frontdoor.yaml
Alpha gap: the agent image isn't on a public registry yet. For a local minikube:
docker build -t rocketplane/agent:dev -f agent/Dockerfile . && minikube image load rocketplane/agent:dev,
then setRP_AGENT_IMAGE=rocketplane/agent:devon the control plane.
Is it safe?
The section every platform team reads first:
- Outbound-only. The agent dials out over HTTPS; nothing connects into your cluster, nothing
listens. Actions are claimed by the agent — never pushed in. - Enumerated RBAC, two blocks (
deploy/install.yaml): observe is
read-only; act holds exactly the write verbs the action catalog needs. Delete the act block
(or setrbac.actions=falsein Helm) for a strictly observe-only agent. No wildcards, no
cluster-admin. - Secrets: the inventory shows names, types and key counts — never values. That restraint is
enforced in agent code; if you'd rather enforce it with RBAC too, delete the onesecretsrule
and the agent degrades gracefully. - The LLM is caged. It reads through the same authenticated APIs you use, and mutates only
via the whitelisted, validated, risk-gated action catalog. Every proposal, approval and result
lands in the audit trail. - eBPF: Beyla runs as a privileged DaemonSet (kernel ≥ 5.8 with BTF). The capture layer is
upstream OpenTelemetry tooling — rocketplaneIO is the investigation-and-action loop on top.
What else is in the box
Live service map · alerts with auto-remediation · PromQL on ClickHouse · full K8s inventory · Starlark workflows · more screens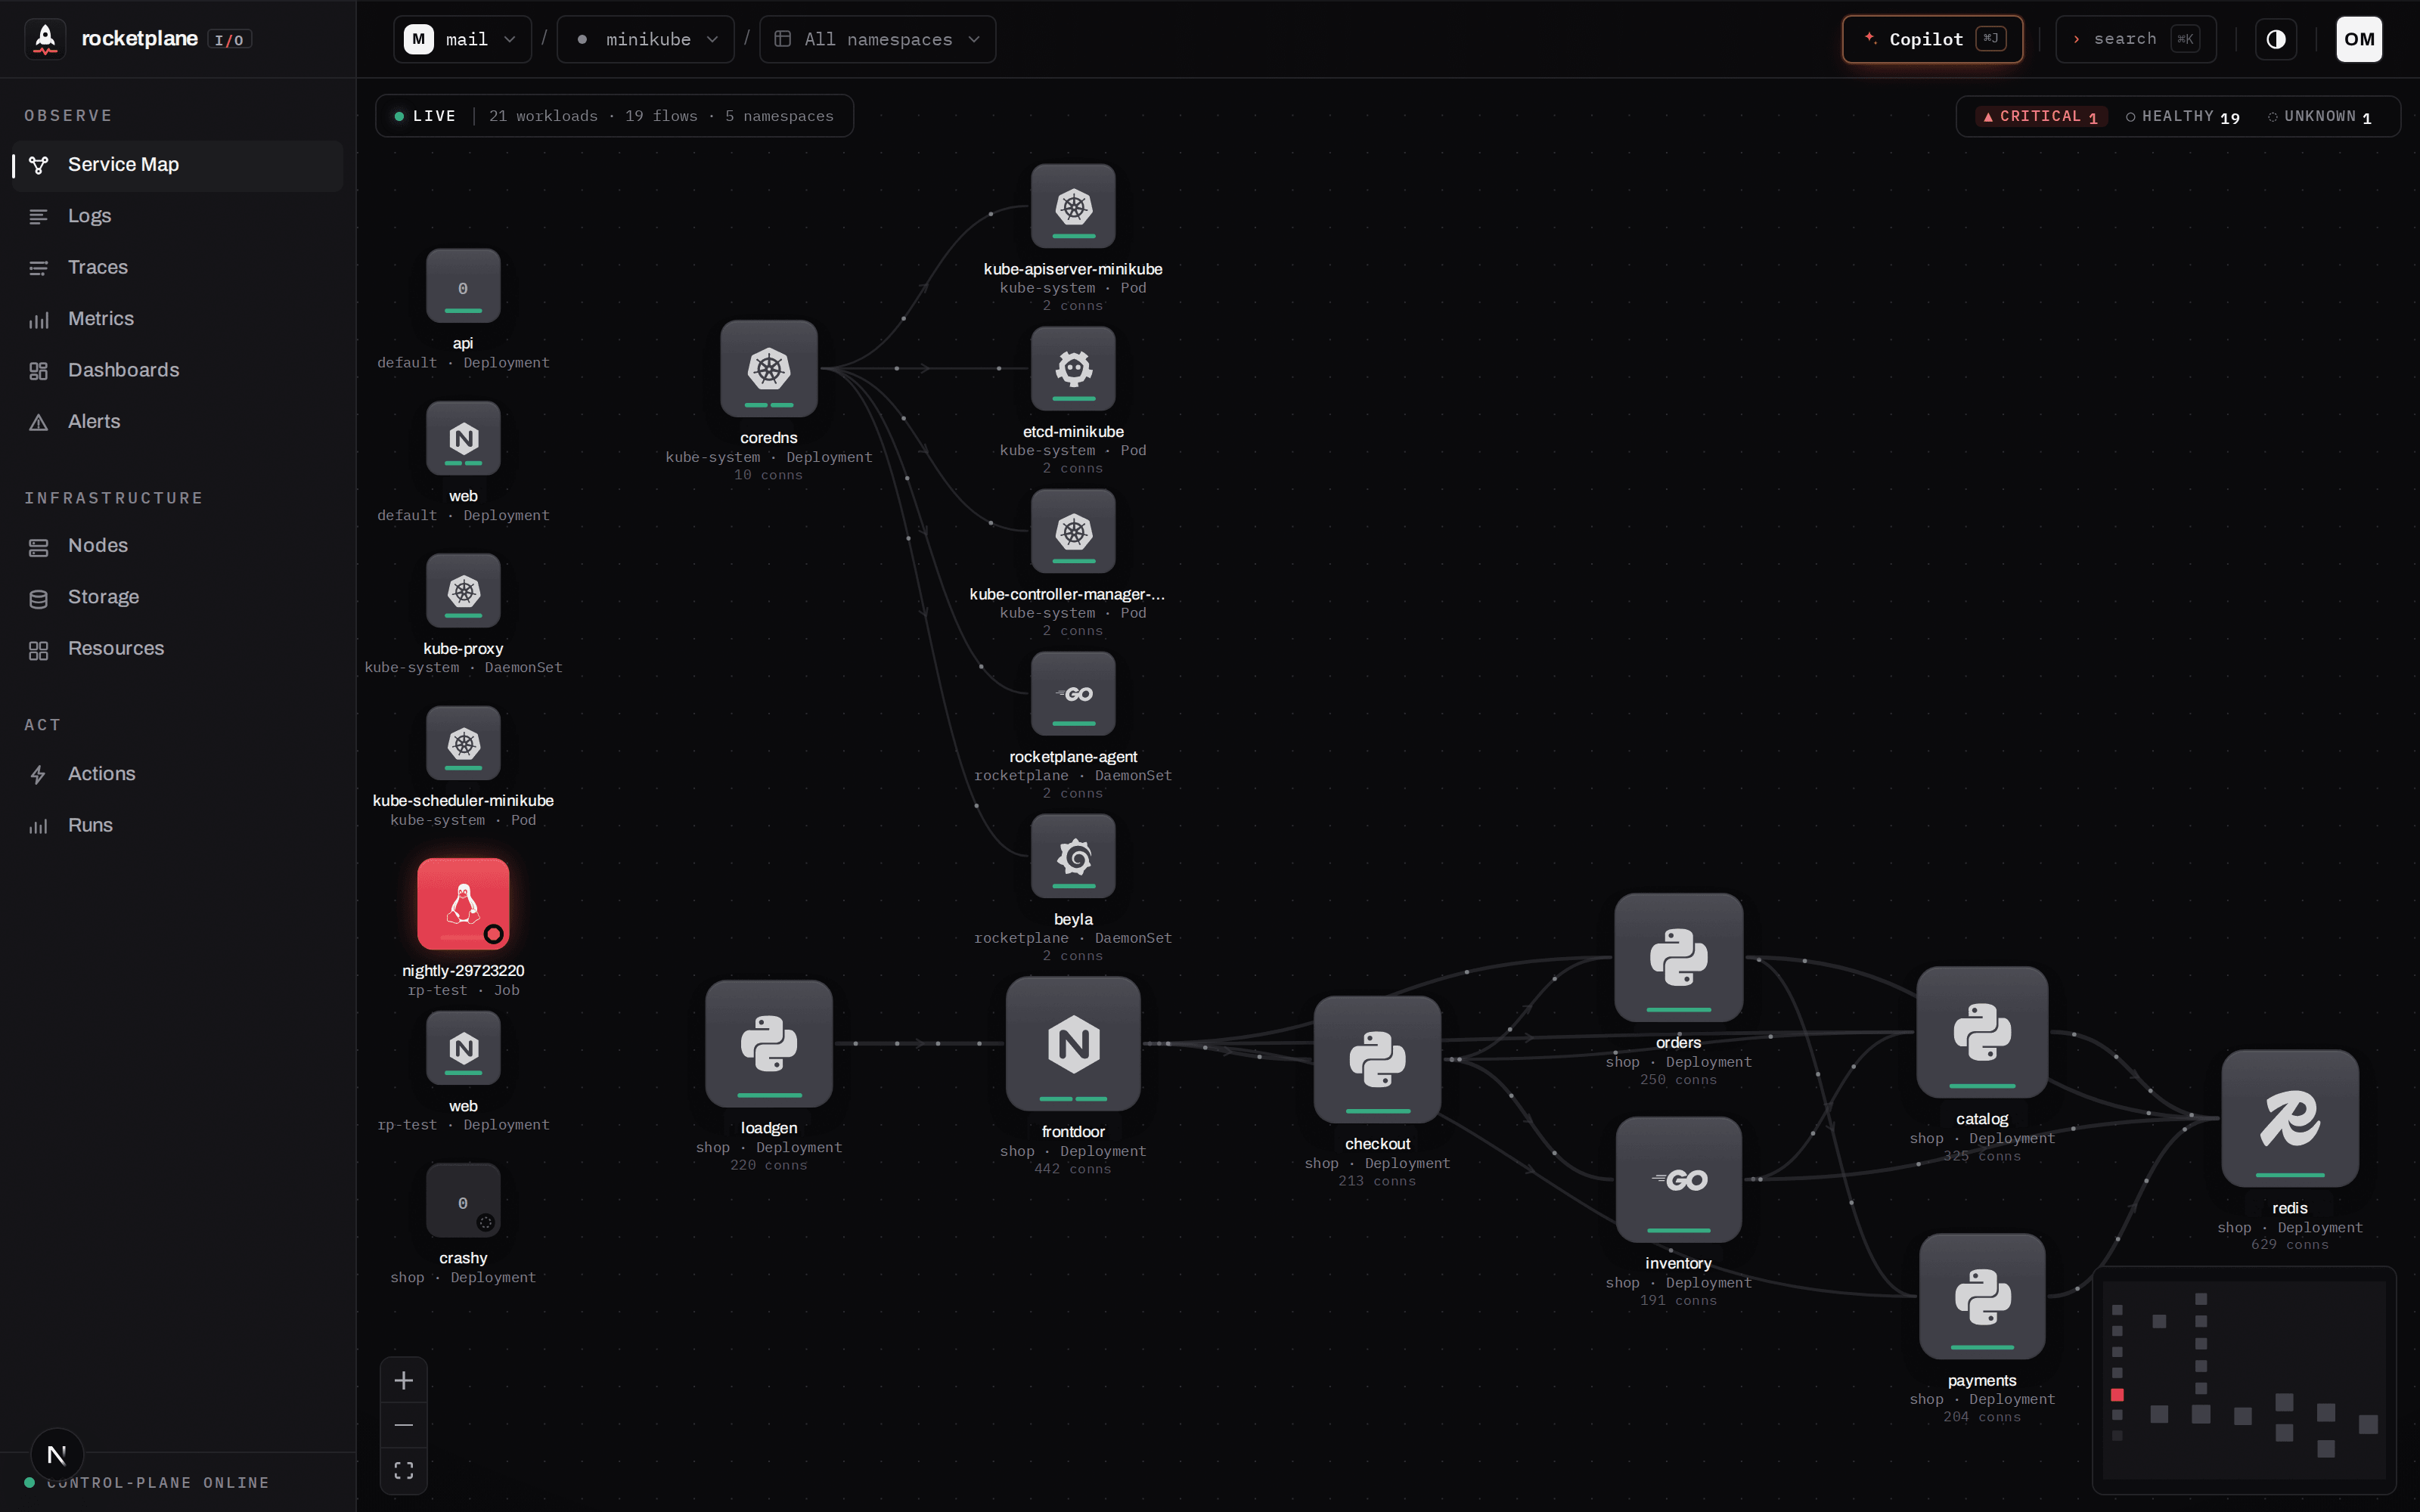 Service map — topology from real eBPF traffic flows; tech logos matched from container
images; live-updating.
Service map — topology from real eBPF traffic flows; tech logos matched from container
images; live-updating.
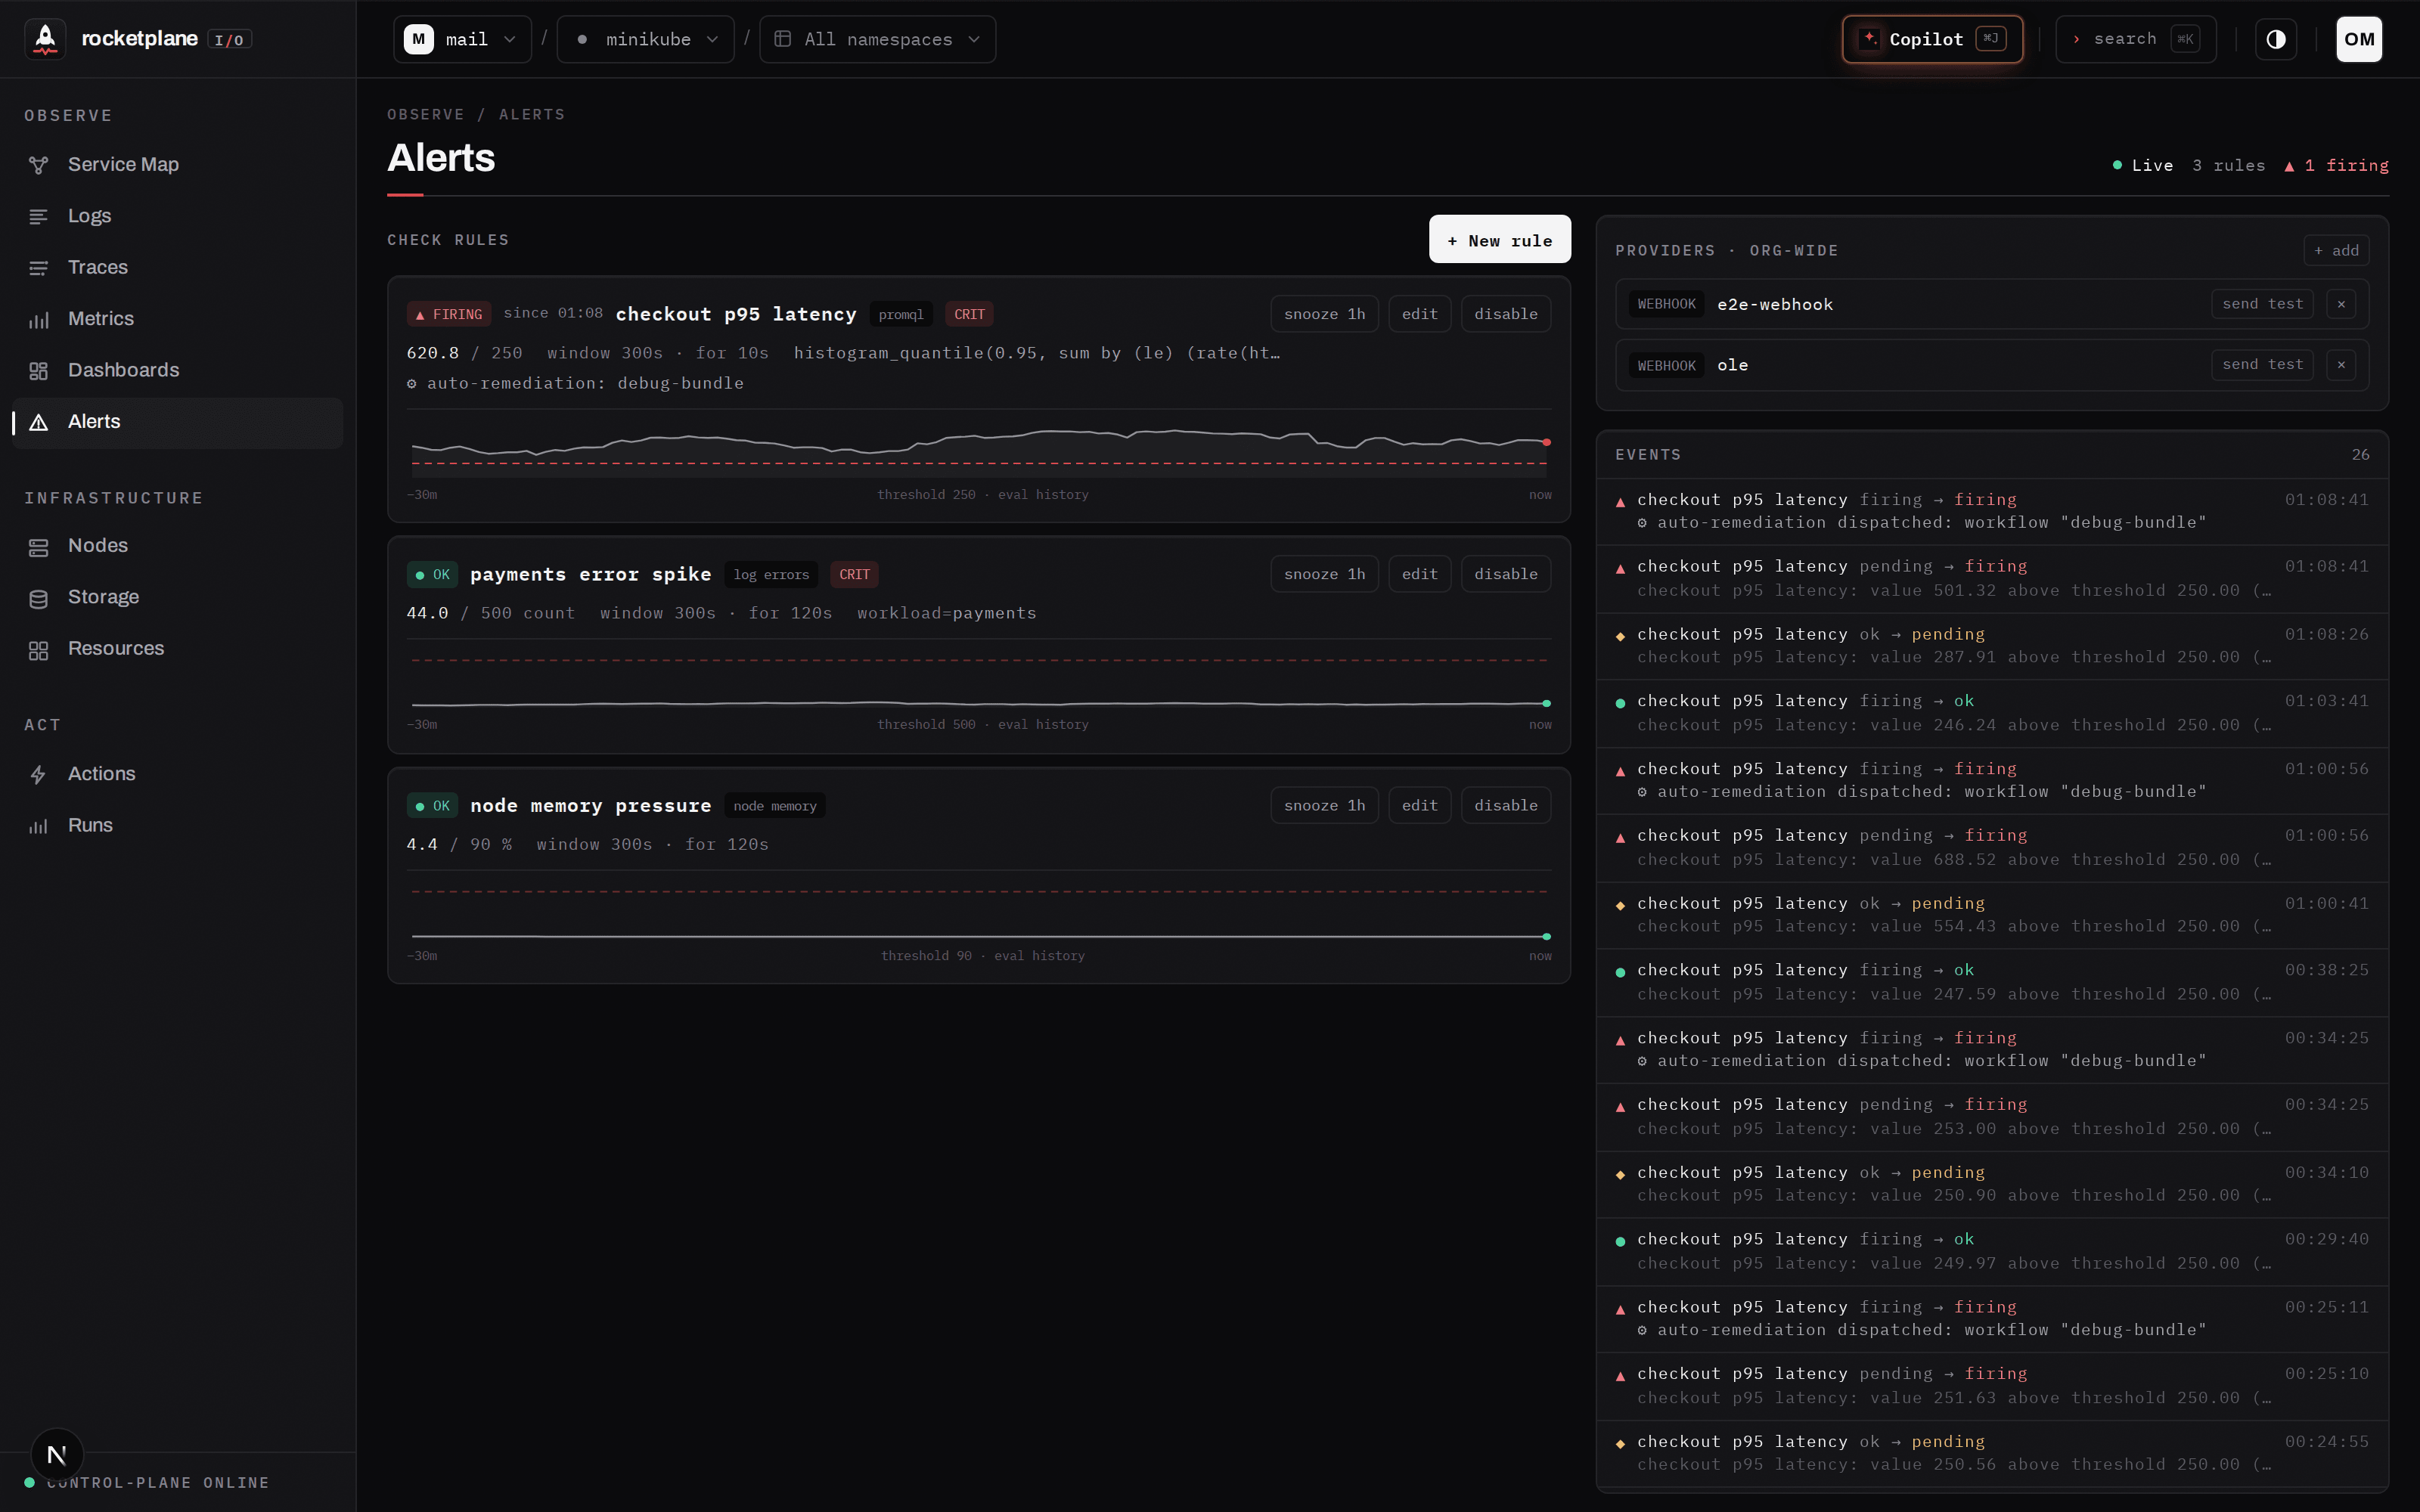 Alerts — typed checks or PromQL conditions with
 for-durations and
sparklines. A firing rule can dispatch a remediation workflow: once per transition, fully audited,
still subject to verify-or-rollback.
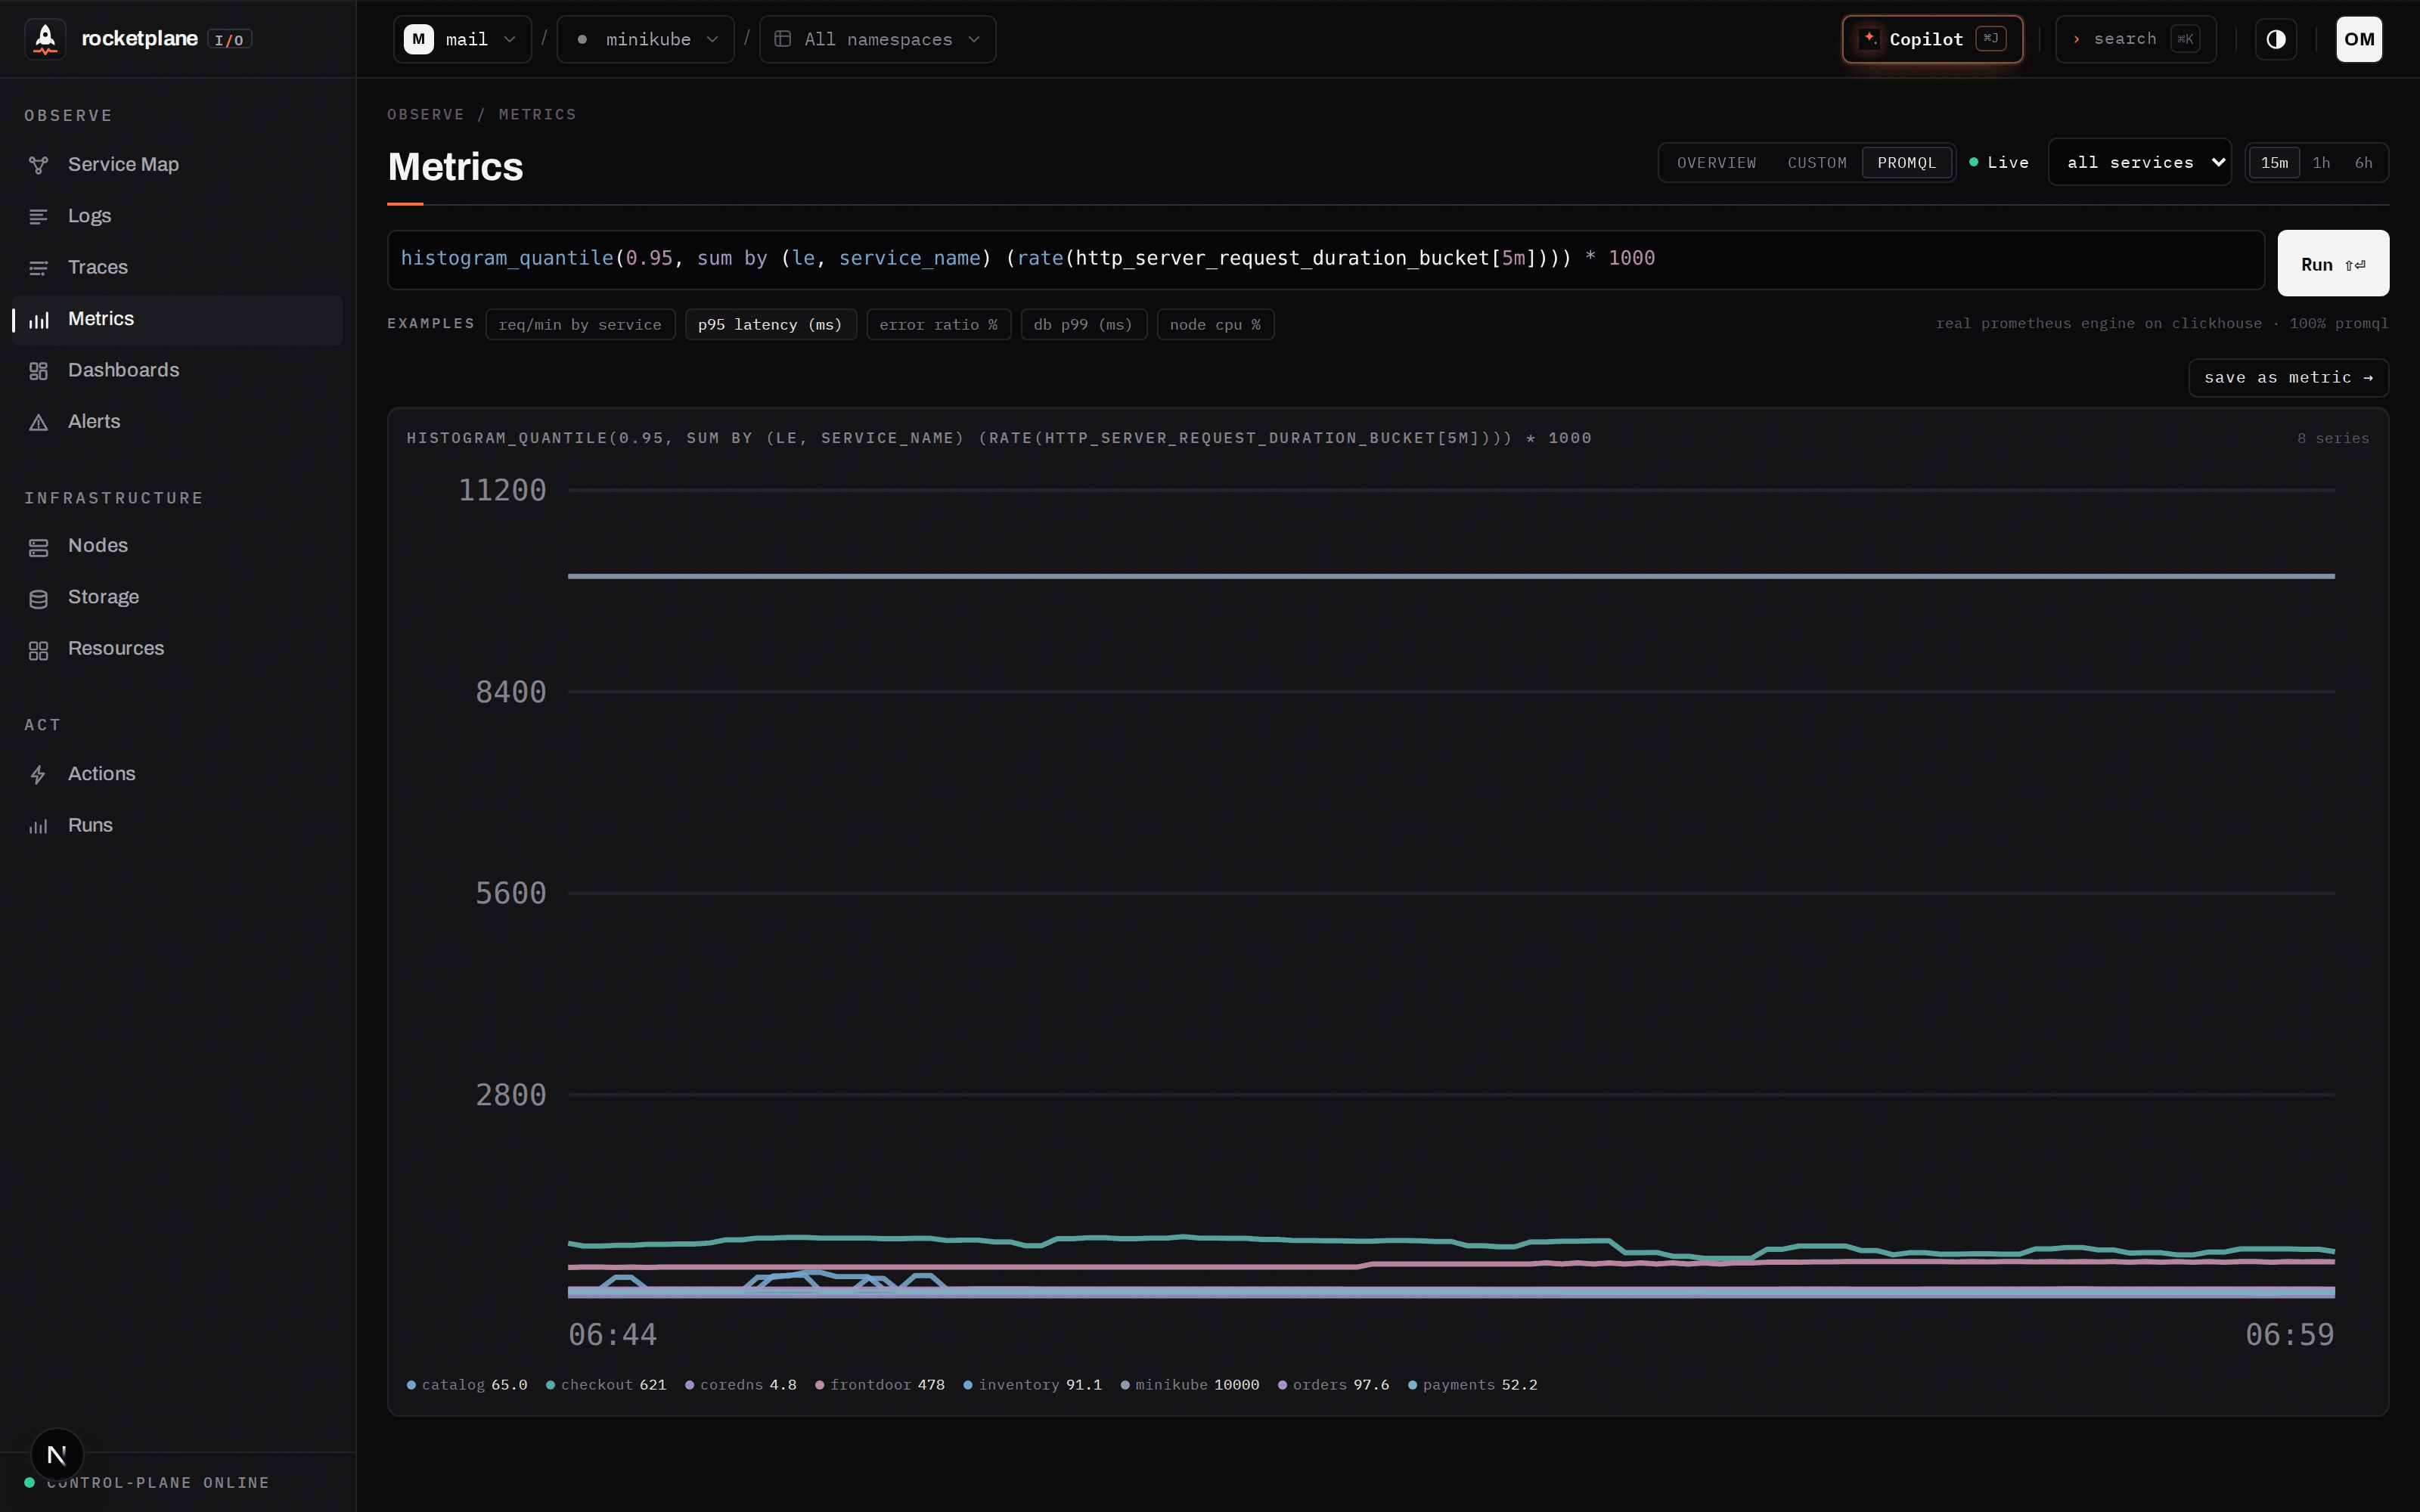 PromQL — the actual Prometheus evaluation engine, embedded and pointed at ClickHouse
(internal/promqlx); editor built on
codemirror-promql. Custom metrics are named PromQL expressions, validated at save.
PromQL — the actual Prometheus evaluation engine, embedded and pointed at ClickHouse
(internal/promqlx); editor built on
codemirror-promql. Custom metrics are named PromQL expressions, validated at save.
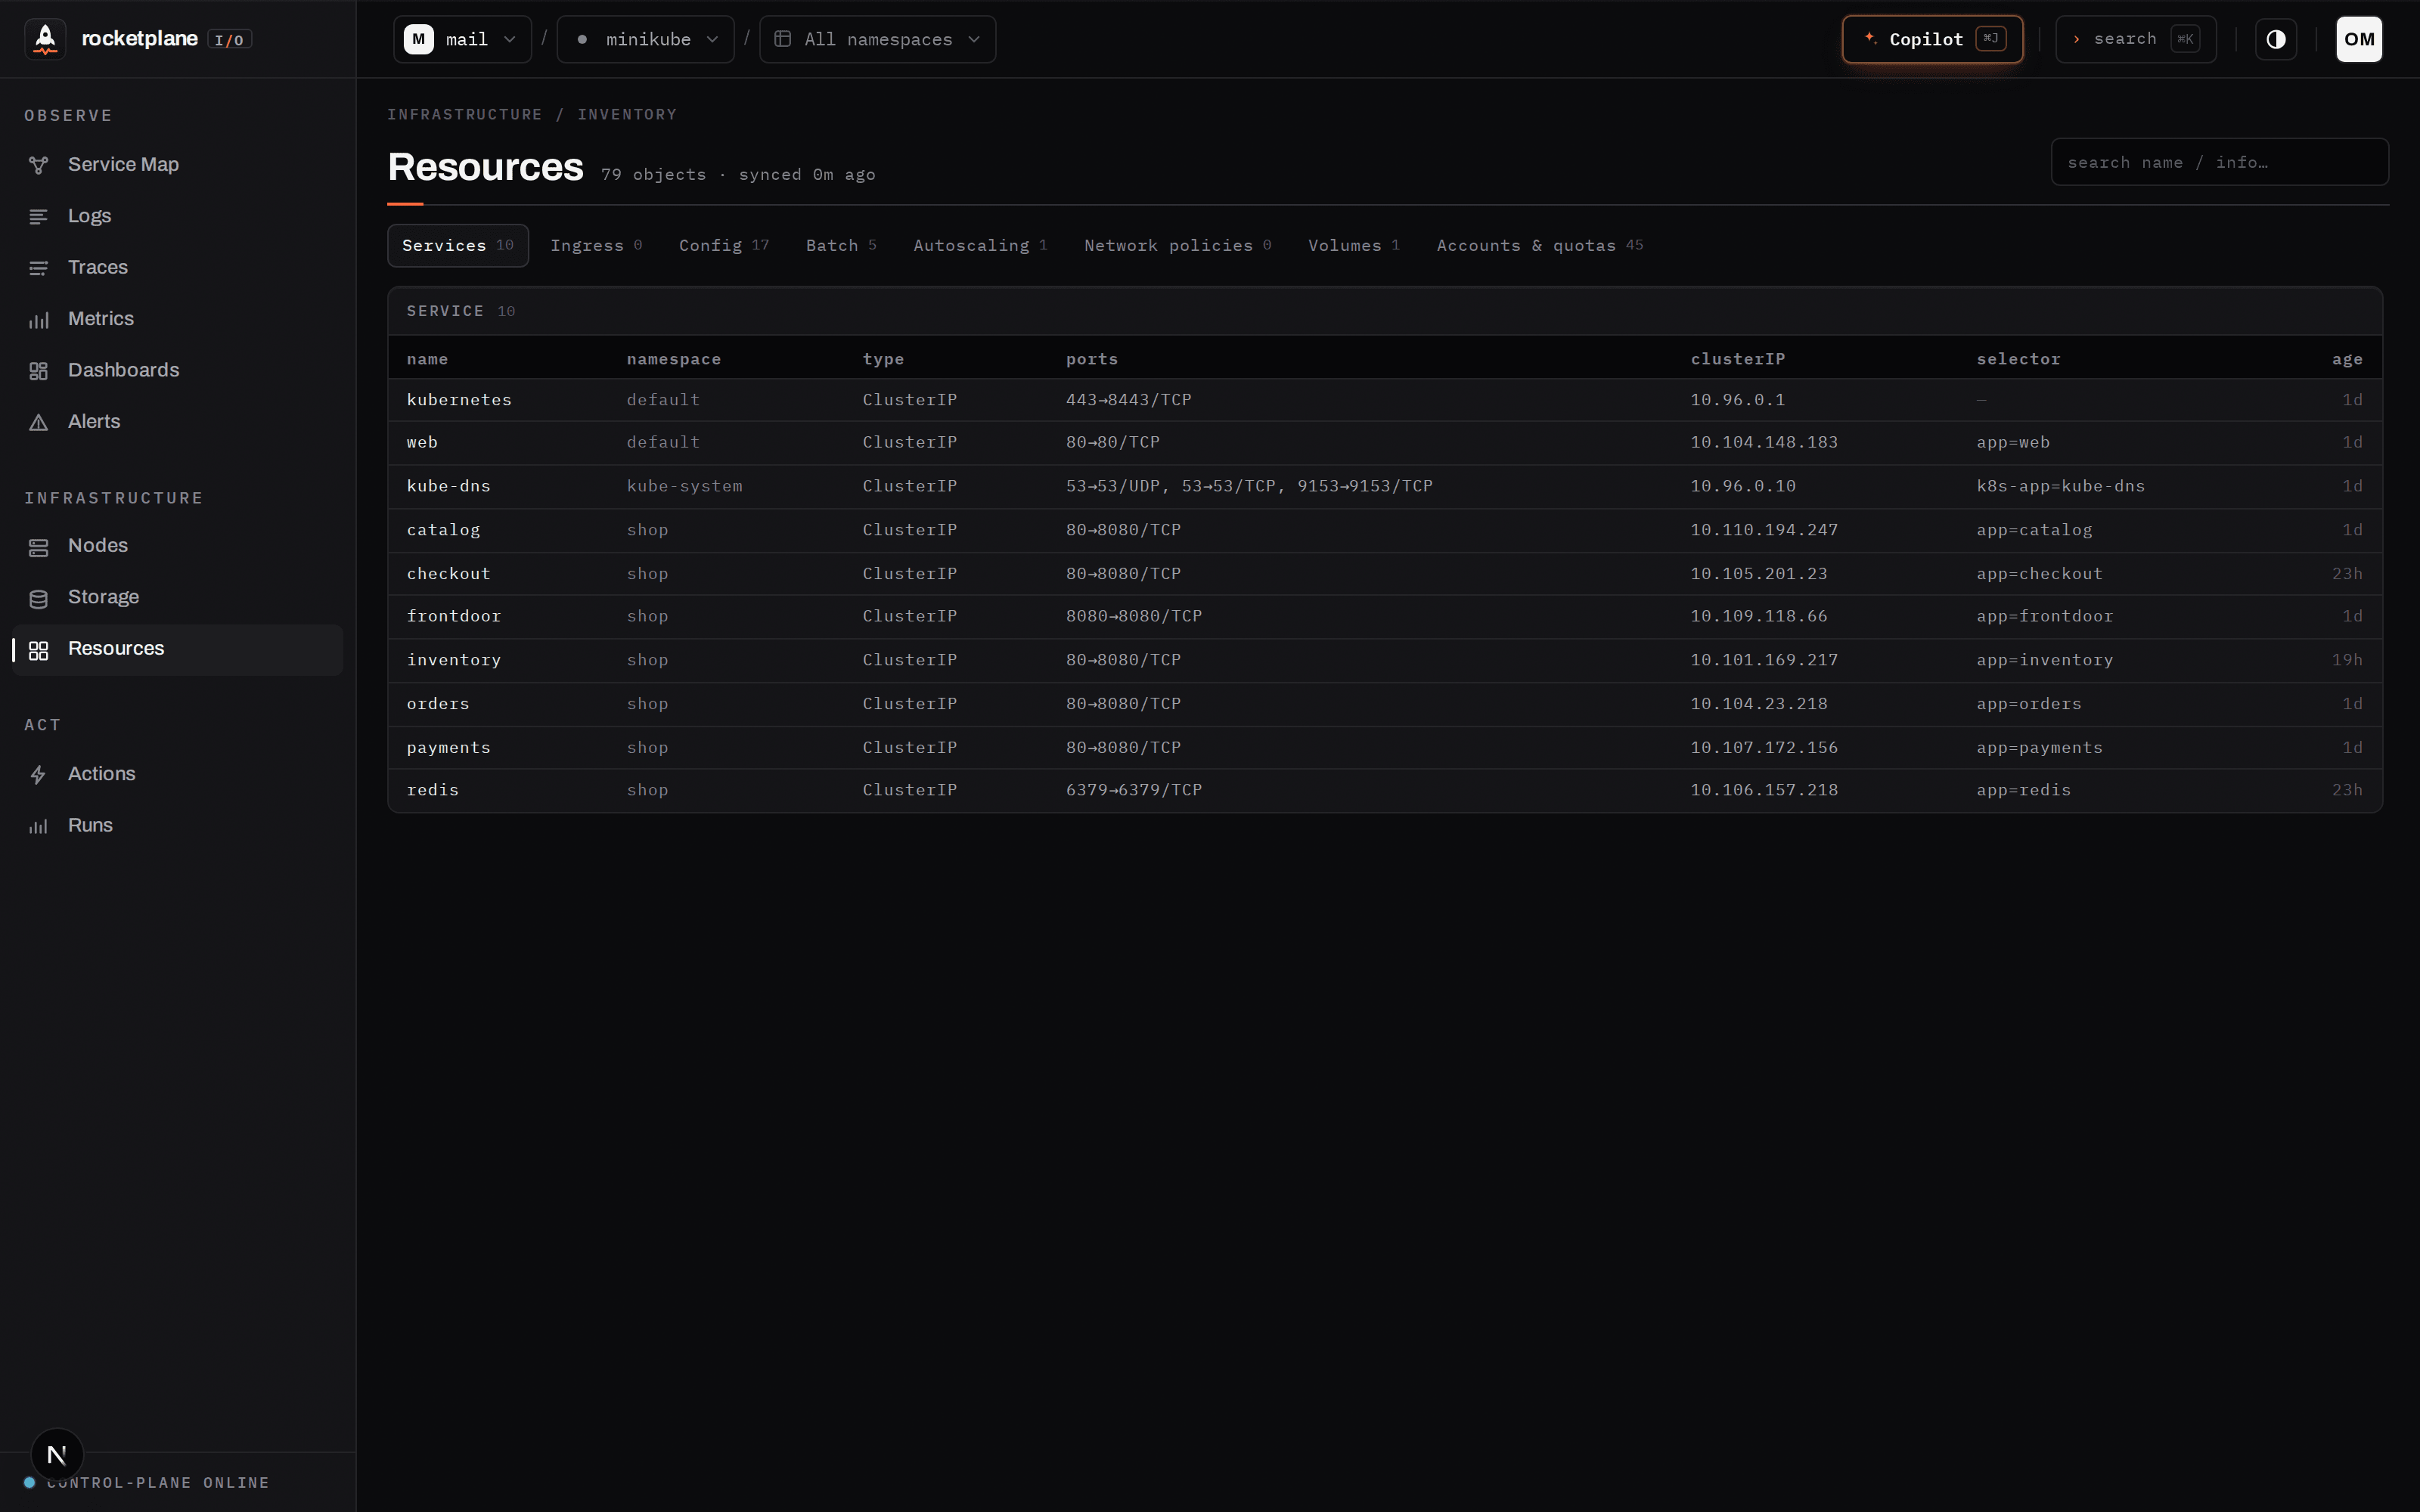 Resources — the complete cluster inventory (Services, Ingress, ConfigMaps, batch,
policies, volumes, quotas), synced every 60s. The same data the Copilot reads via
Resources — the complete cluster inventory (Services, Ingress, ConfigMaps, batch,
policies, volumes, quotas), synced every 60s. The same data the Copilot reads via
list_resources.
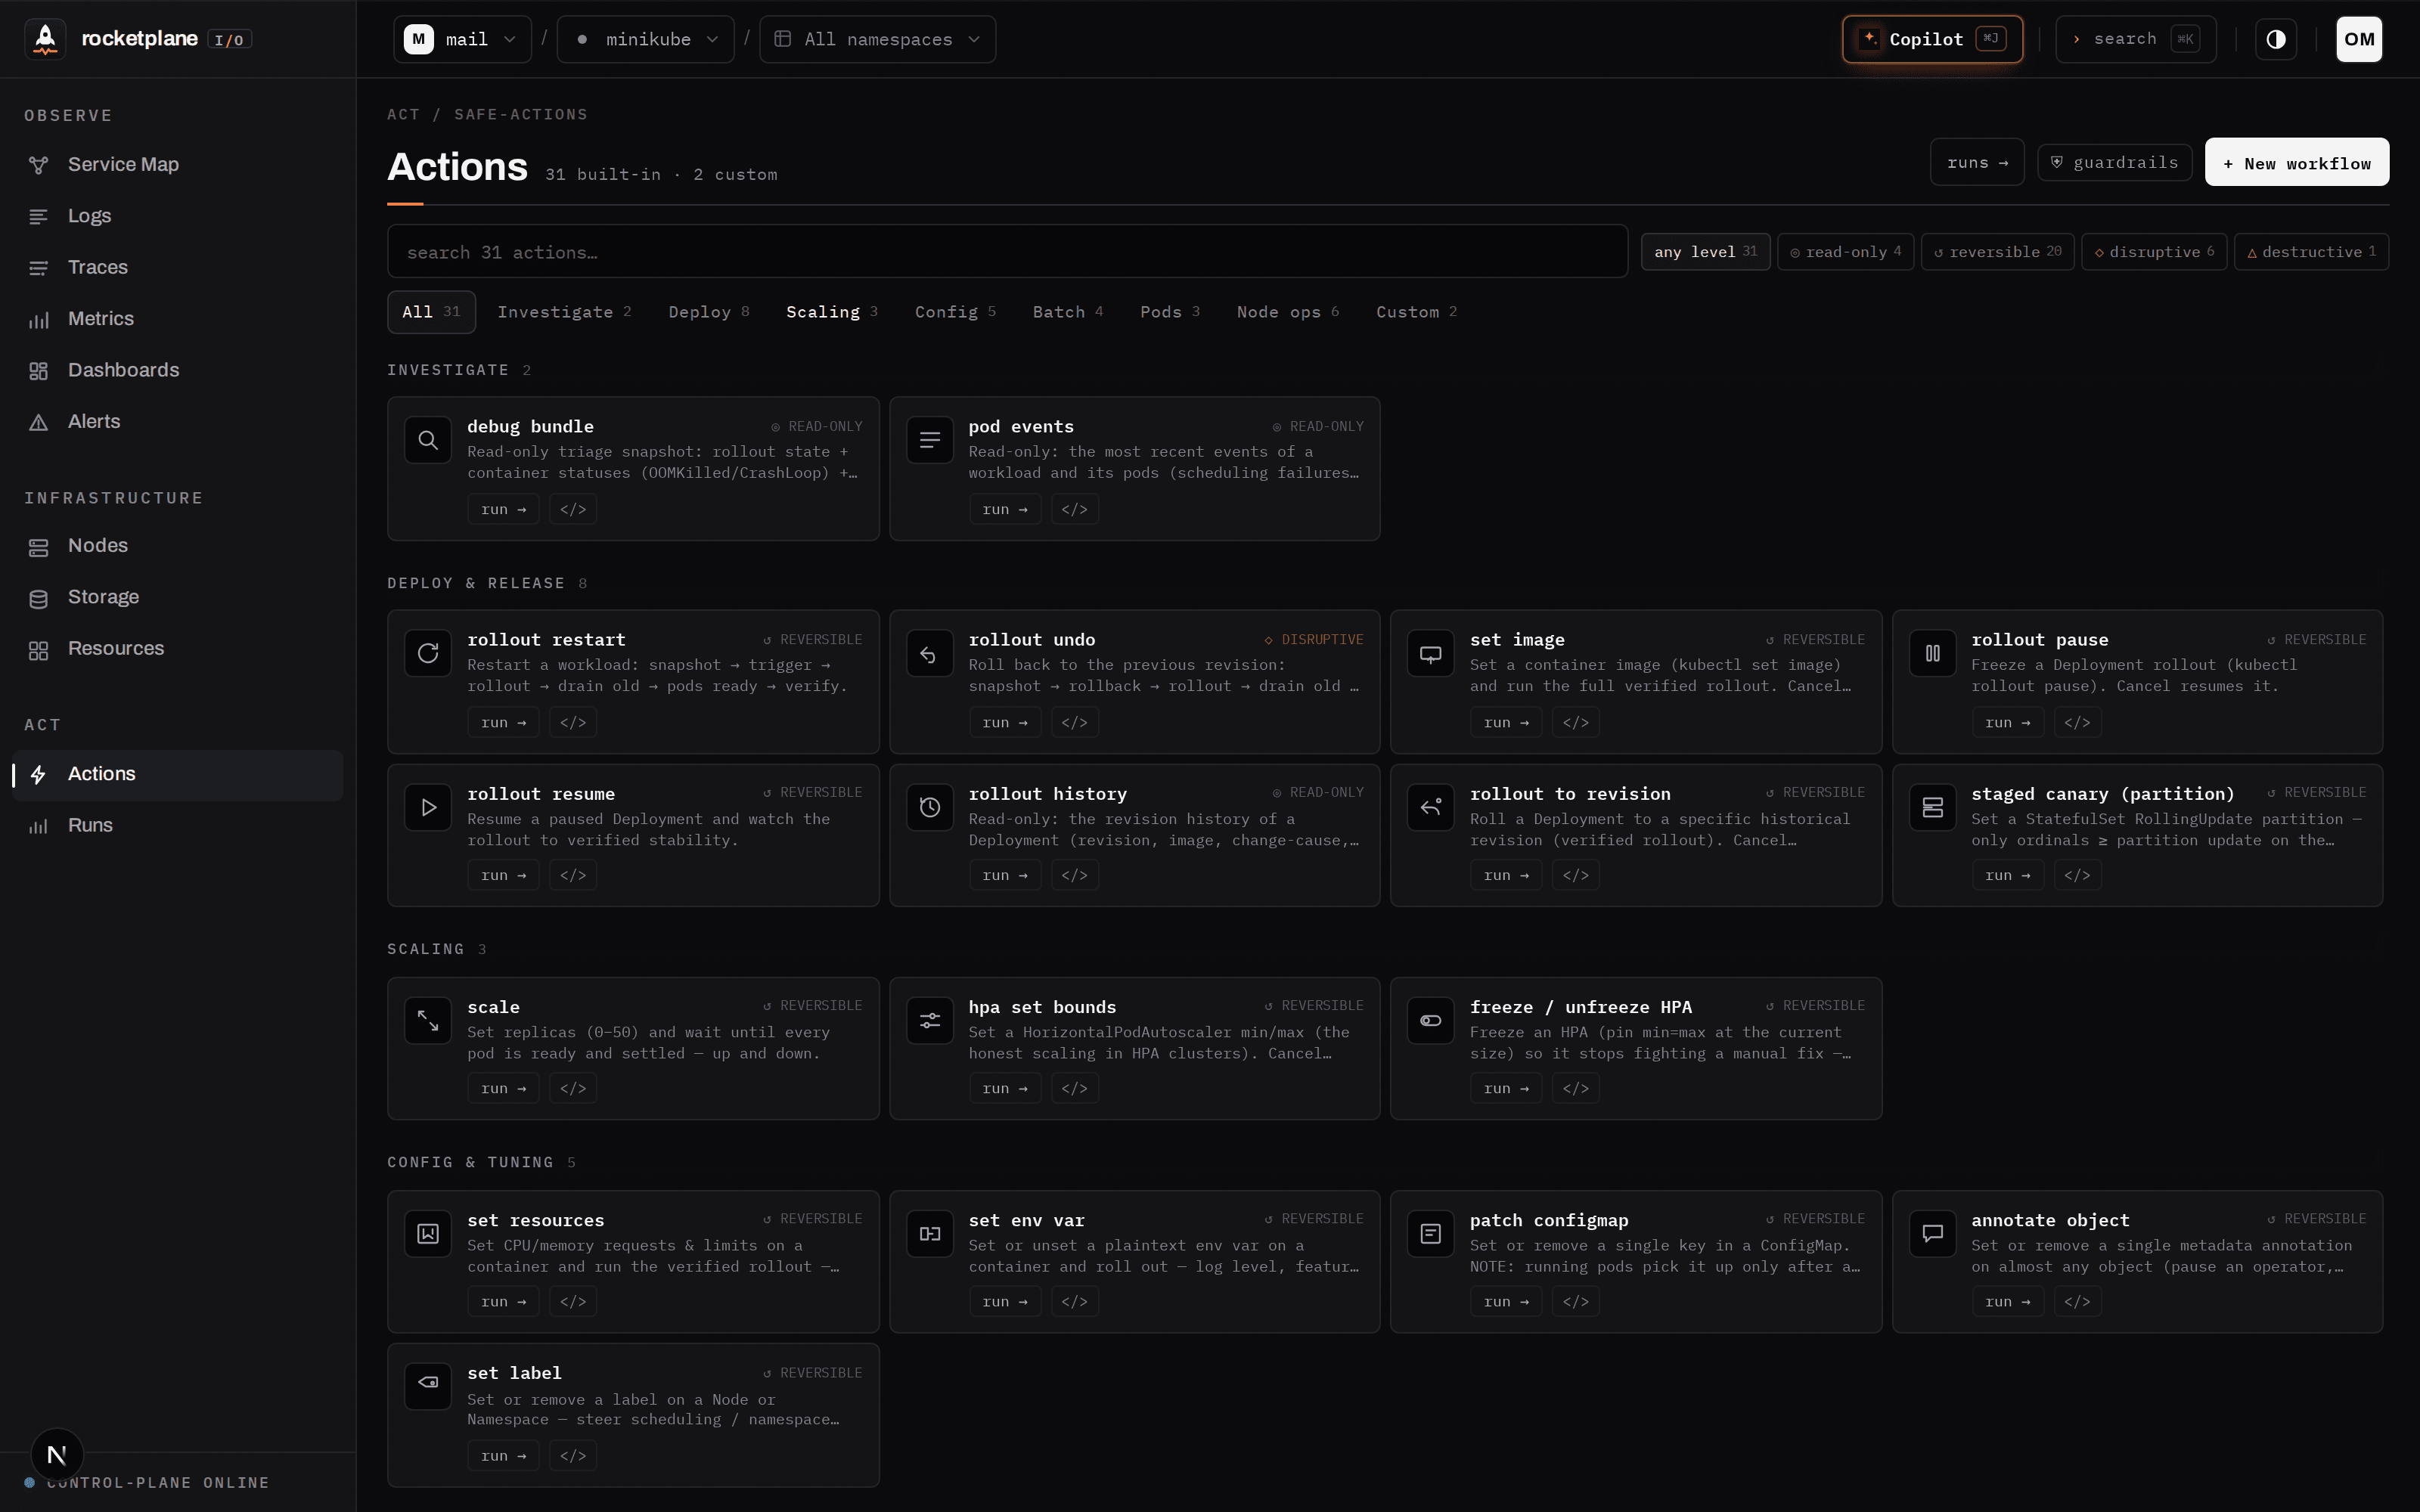 Actions — the catalog, searchable and risk-graded. Every built-in is also readable,
forkable Starlark: automate what an operator does by hand, with typed parameters that
render as forms. Deterministic, compiled at save.
Actions — the catalog, searchable and risk-graded. Every built-in is also readable,
forkable Starlark: automate what an operator does by hand, with typed parameters that
render as forms. Deterministic, compiled at save.
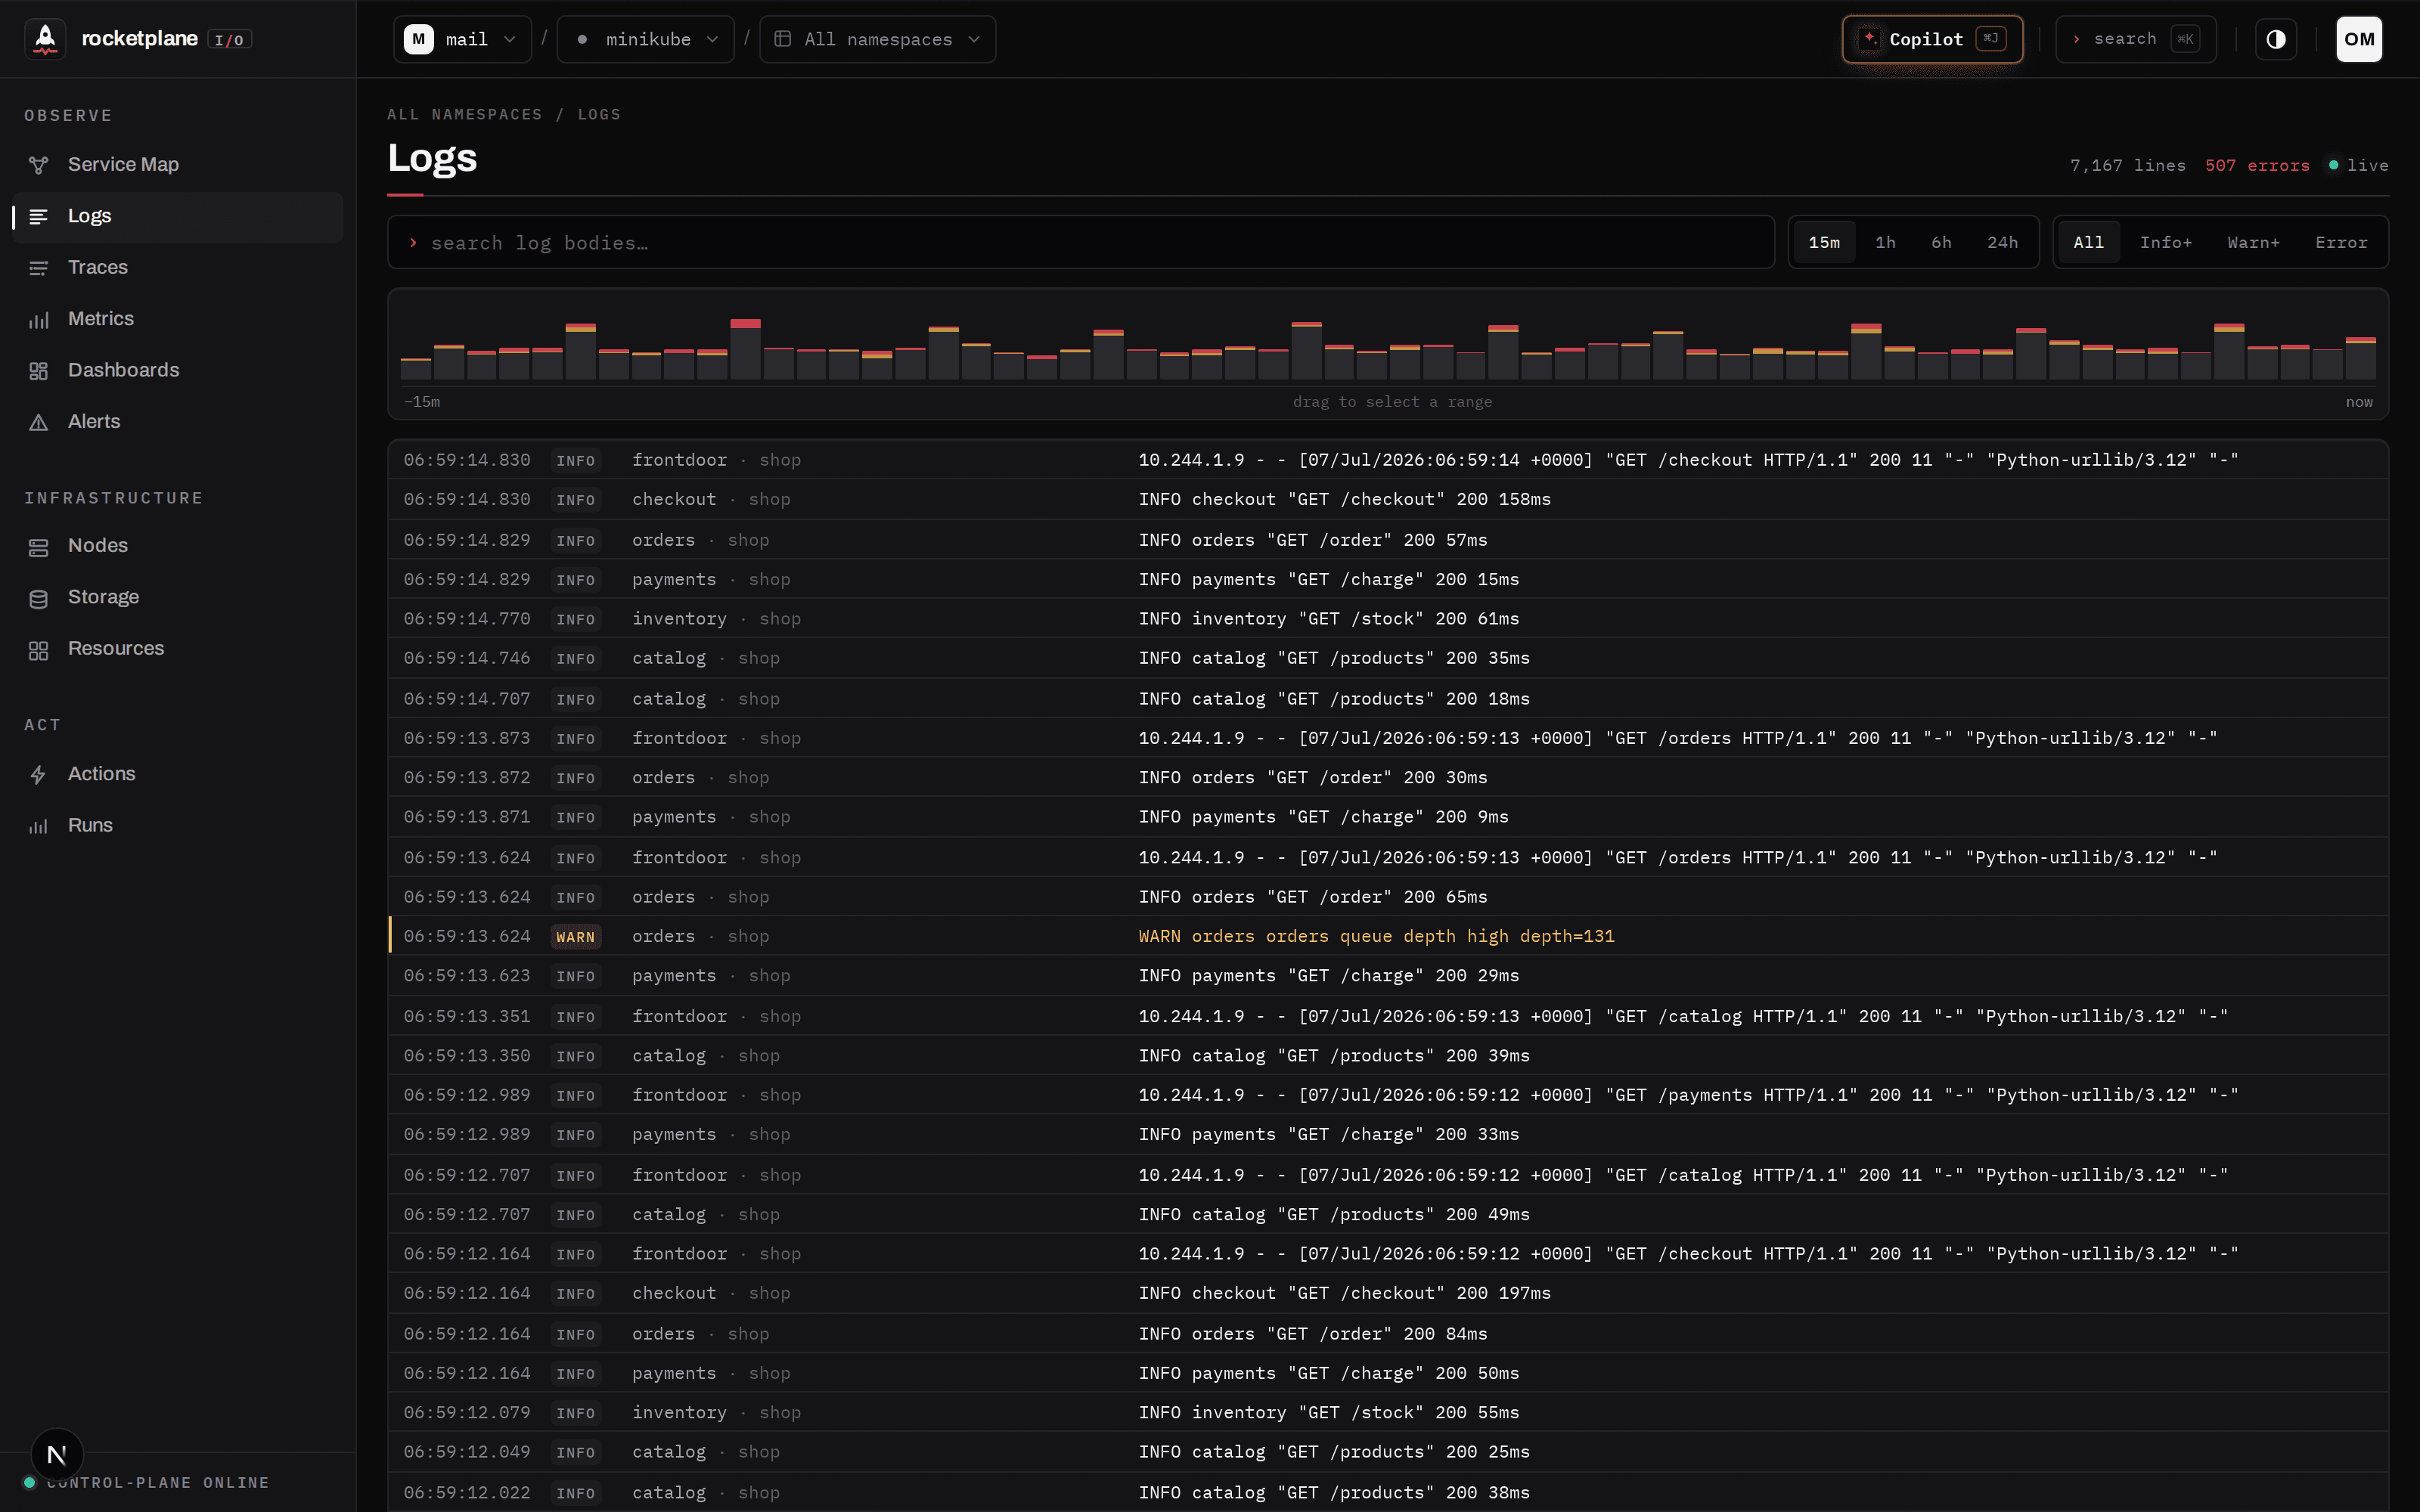 Logs — severity histogram, brushing, and the two-click path to the distributed
trace.
Logs — severity histogram, brushing, and the two-click path to the distributed
trace.
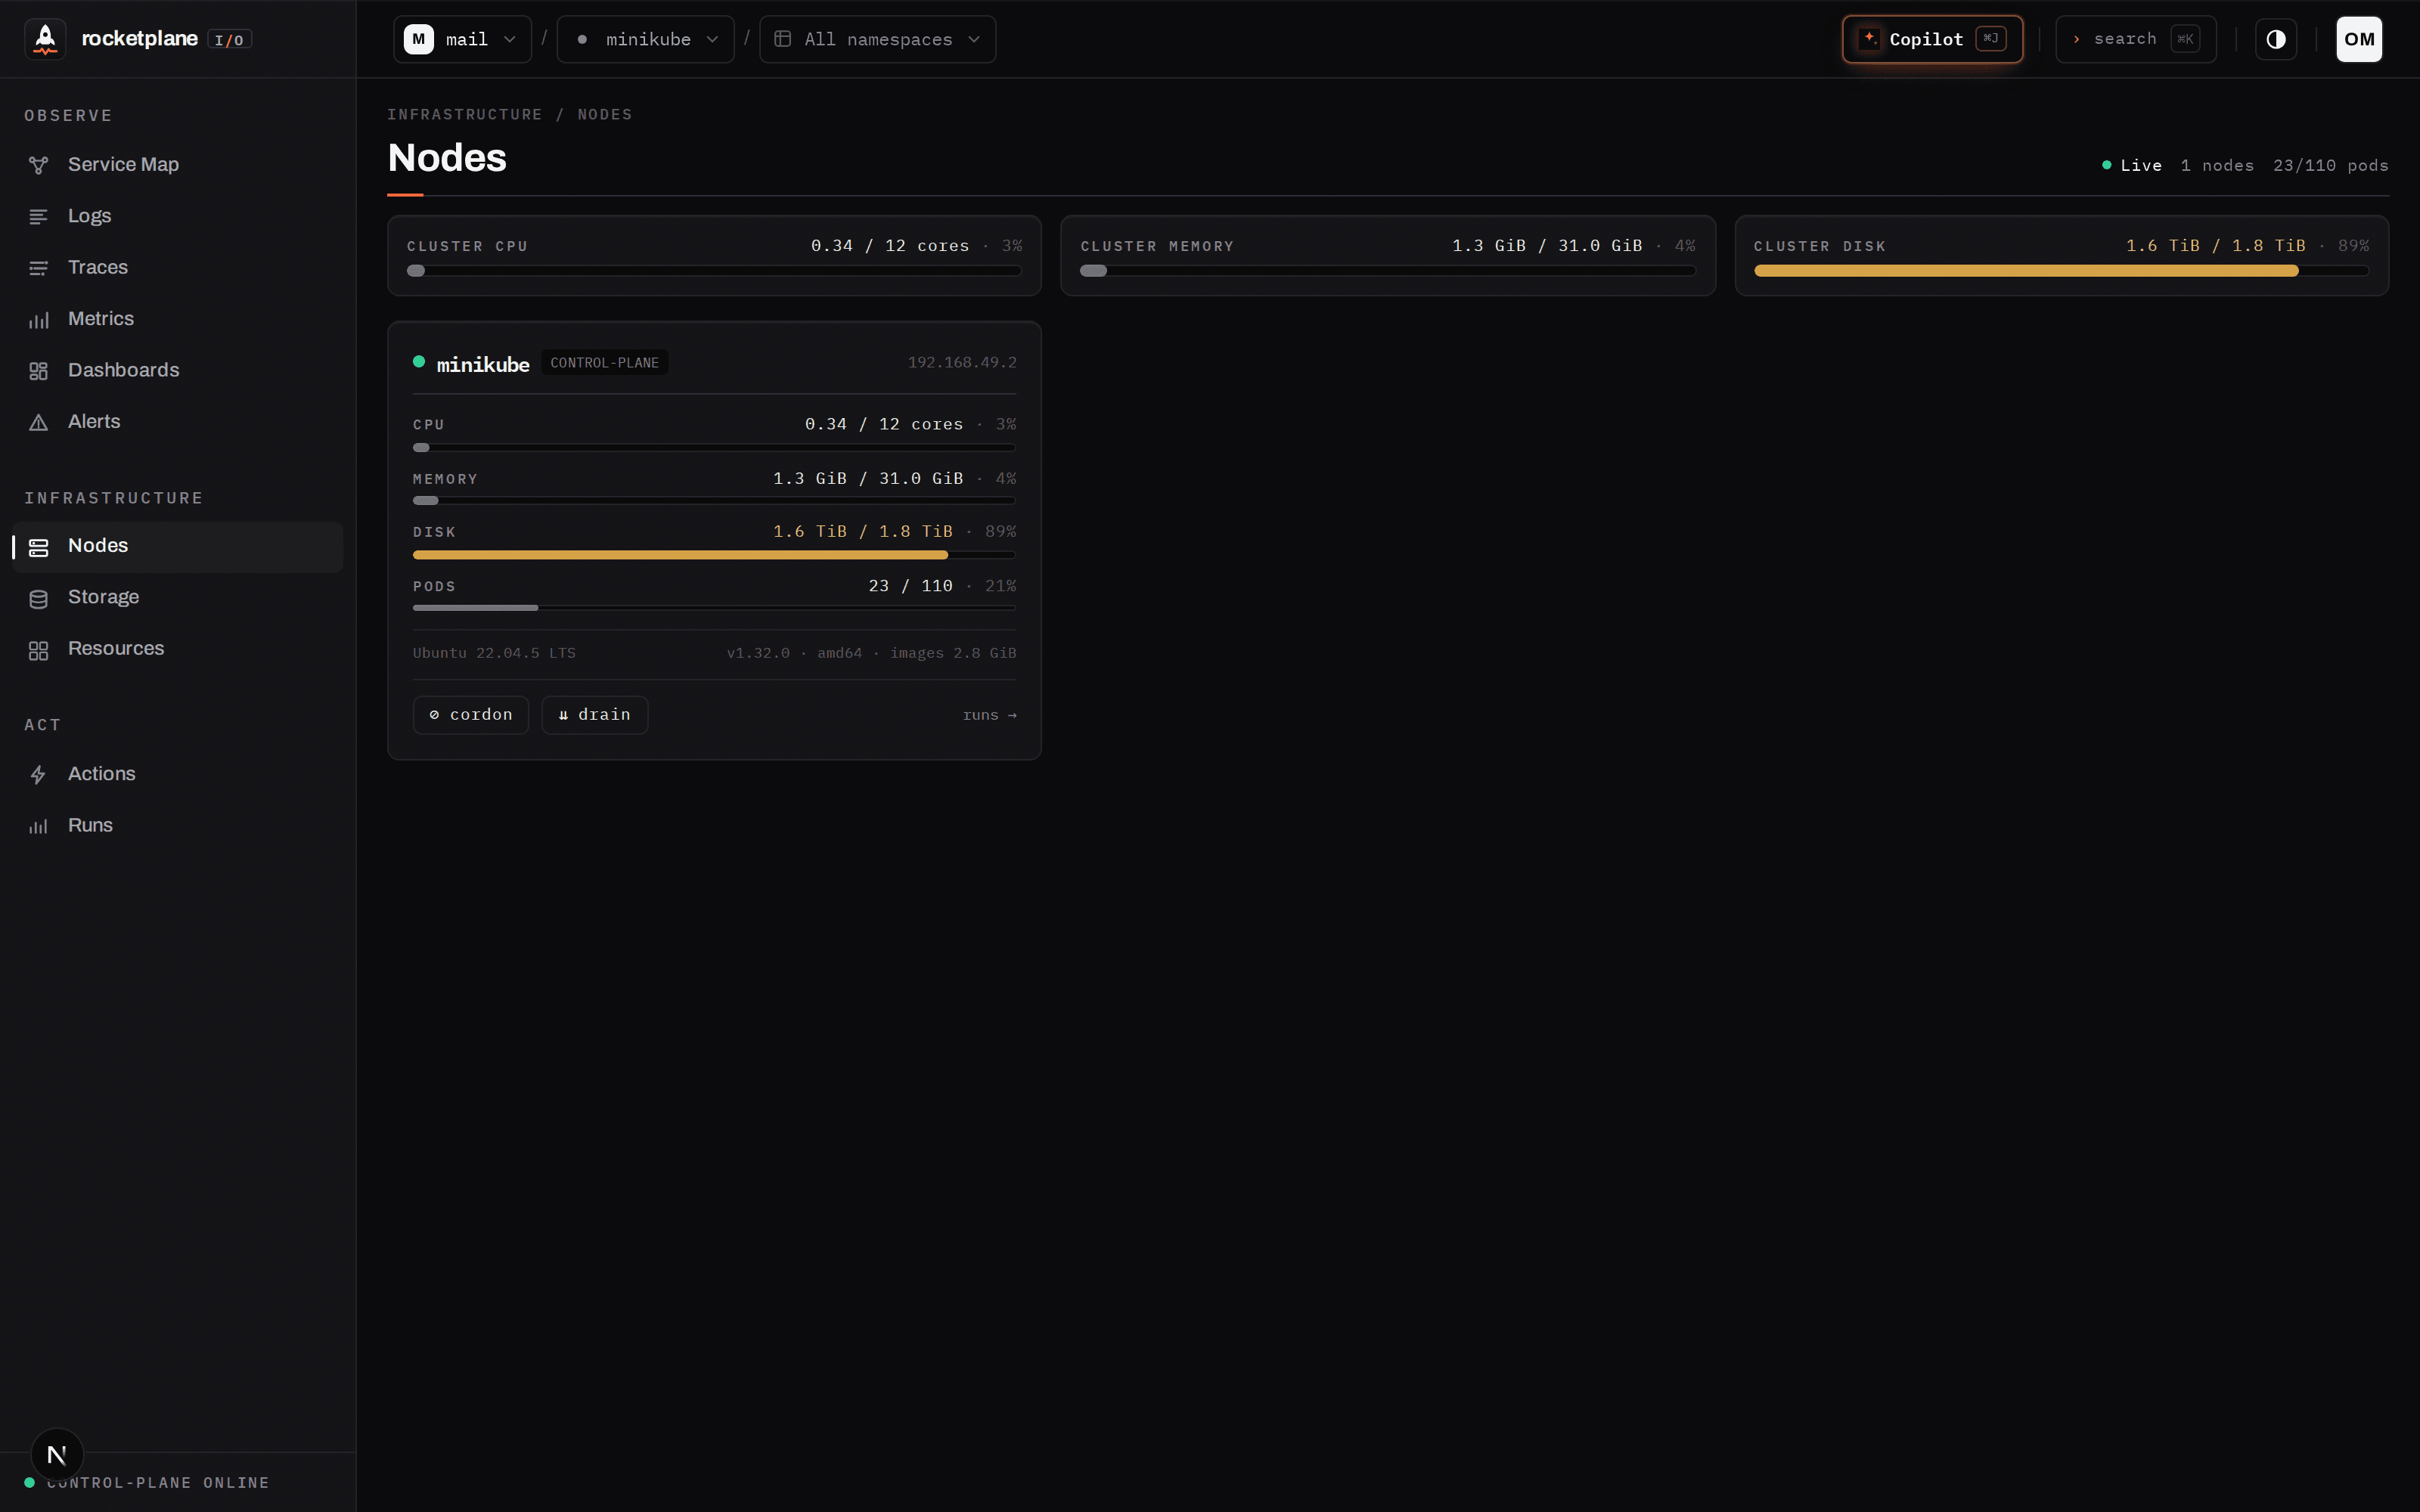 Nodes — kubelet-level stats; cordon/drain are verified actions, with a read-only
drain preview that shows the blast radius first.
The UI follows a strict instrument-panel design system (RETICLE) — healthy is calm, only
anomalies speak.
Under the hood
 YOUR CLUSTER   agent (Go, outbound-only, enumerated RBAC)      beyla eBPF DaemonSet
                topology · logs · inventory · action pipelines   HTTP/gRPC/Go · SQL/Redis/Kafka
                        │ HTTPS                                          │ OTLP
                        ▼                                                ▼
 CONTROL PLANE  control plane (Go, single binary)                OTel collector → ClickHouse
                API · auth/orgs · alert evaluator · action queue · Copilot loop
                embedded Prometheus engine (PromQL → ClickHouse) · SSE broker
                        │
 DATA           PostgreSQL (state, rules, runs, chats)  ·  ClickHouse (logs, traces, metrics)
 ACCESS         web (Next.js) — service map · copilot · logs · traces · metrics · alerts · actions · runs
The Copilot is a tool-calling loop inside the control plane: 16 read tools (logs, traces —
including single-trace waterfalls and trace↔log correlation — PromQL, service map, inventory,
debug bundles) plus exactly one mutating tool, run_safe_action, which pauses the stream for
human approval. The same toolbox is exposed as an MCP server,
so Claude Code or Cursor can operate your cluster through the identical guardrails.
├── agent/                      # in-cluster agent (Go): sync, logs, inventory, action pipelines + revert snapshots
├── services/controlplane/      # control plane (Go): API, auth, alerts, Copilot loop, PromQL engine
│   └── internal/
│       ├── api/                #   REST + SSE + copilot_* (loop, guardrails, approval gate)
│       ├── promqlx/            #   embedded Prometheus engine on ClickHouse
│       ├── alerts/ · telemetry/ · events/ · store/ · migrations/
│       └── ../cmd/mcp/         #   MCP server — same tools for external agents
├── apps/web/                   # Next.js UI (RETICLE design system)
└── deploy/                     # compose (dev stores), helm chart, install.yaml, demo shop
Status
| Works end-to-end today | Not yet |
|---|---|
| Copilot: BYO-LLM investigation → guardrailed fixes | Published container images |
| eBPF traces incl. compiled Go, log→trace correlation | Hosted demo |
| ~30 safe actions with verify, rollback and revert | Measured overhead numbers |
| Runs audit trail, guaranteed-terminating cancel | Multi-user RBAC hardening |
| Alerts with auto-remediation dispatch | Server-side LLM key vault |
| PromQL + custom metrics on ClickHouse, full K8s inventory |
Contributing
Reports from real clusters are the contribution we want most —
open an issue. See
CONTRIBUTING.md. If this resonates, a star helps others find it.
License
Reviews (0)
Sign in to leave a review.
Leave a reviewNo results found