pandev-cli
Health Pass
- License — License: NOASSERTION
- Description — Repository has a description
- Active repo — Last push 0 days ago
- Community trust — 10 GitHub stars
Code Pass
- Code scan — Scanned 3 files during light audit, no dangerous patterns found
Permissions Pass
- Permissions — No dangerous permissions requested
No AI report is available for this listing yet.
What your AI coding agents actually cost — by task, branch, model and file. Runs locally, sends nothing.
pandev
What your AI coding agents actually cost — broken down by task, branch, model and file.
Runs on your machine. No account, no telemetry — your logs never leave your laptop.



npx pandev@beta
pandev-metrics.com/cli · npm · How to verify the privacy claim · Changelog
Beta is live
npx pandev@betaruns the current beta on macOS (Apple Silicon and Intel) and Linux x64 —
no install step, nothing else to set up. The Windows npm package is not published yet;
on Windows use the beta installer from PowerShell:iwr https://raw.githubusercontent.com/pandev-metriks/homebrew-pandev-cli-beta/main/install-experimental.ps1 -UseBasicParsing | iex
(the command there ispandev cost).Beta means the numbers are already trustworthy — the parsers are verified against live
logs — but command names and output may still change between releases.
The problem
Your agent bills you per token. Your work is organised in tasks. Nothing connects the two.
Every tool in this space reports sessions: "yesterday you spent $61." Useful once. It never
answers the question you actually have — which piece of work was expensive, and why.
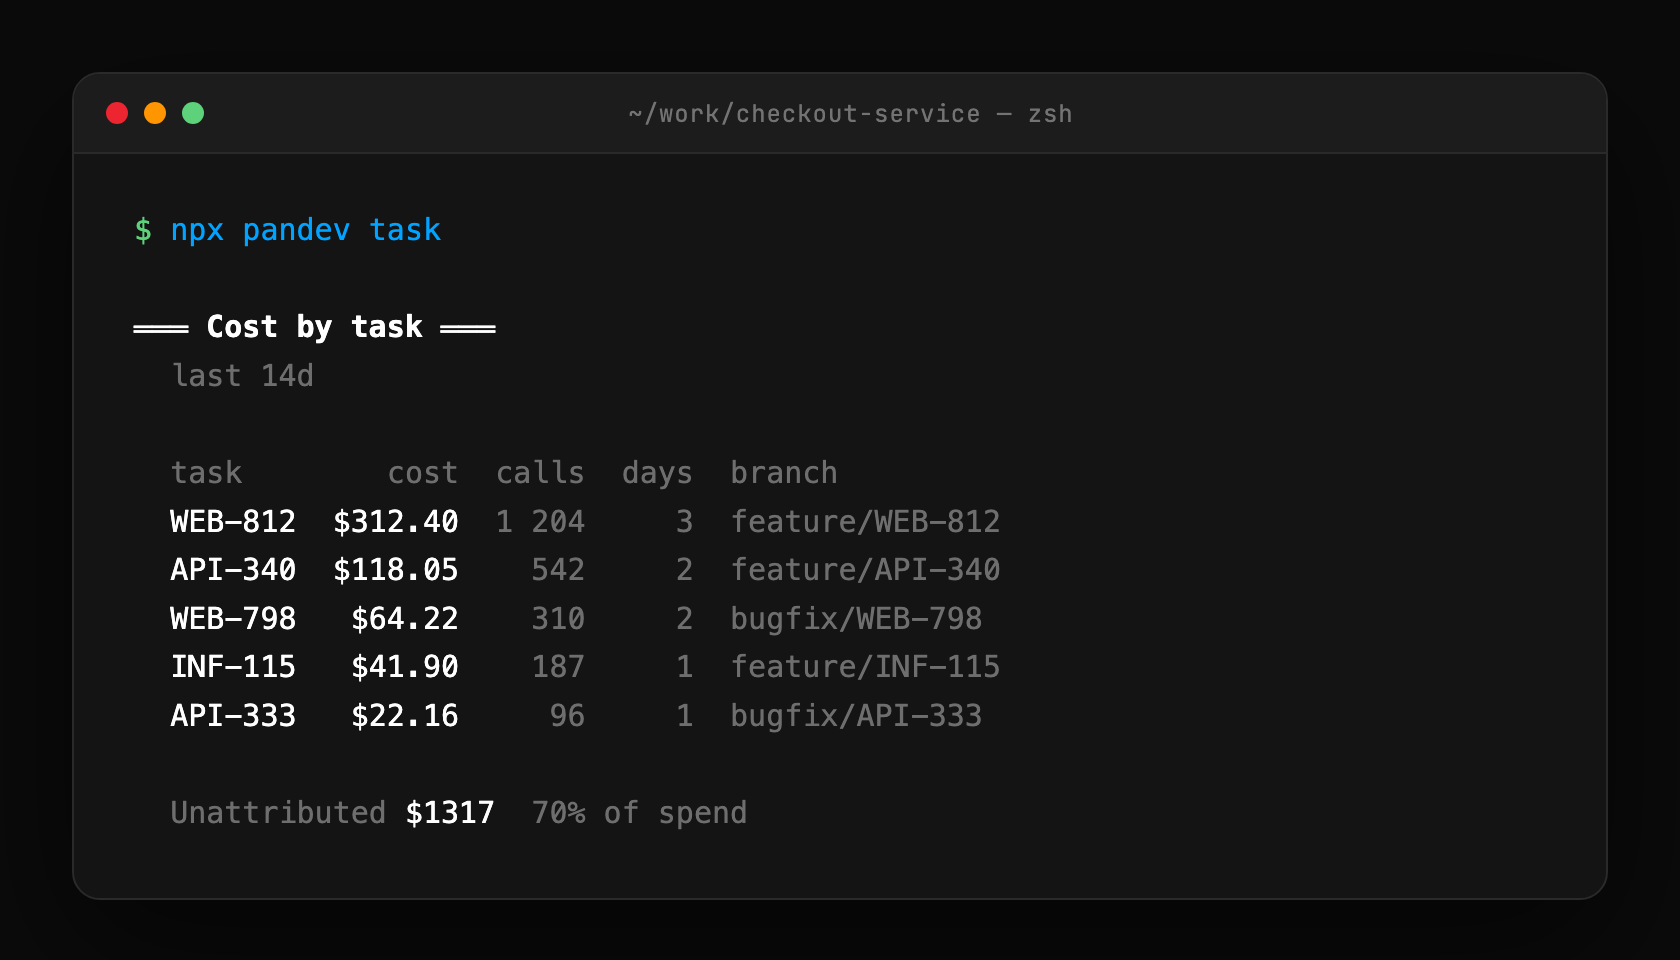
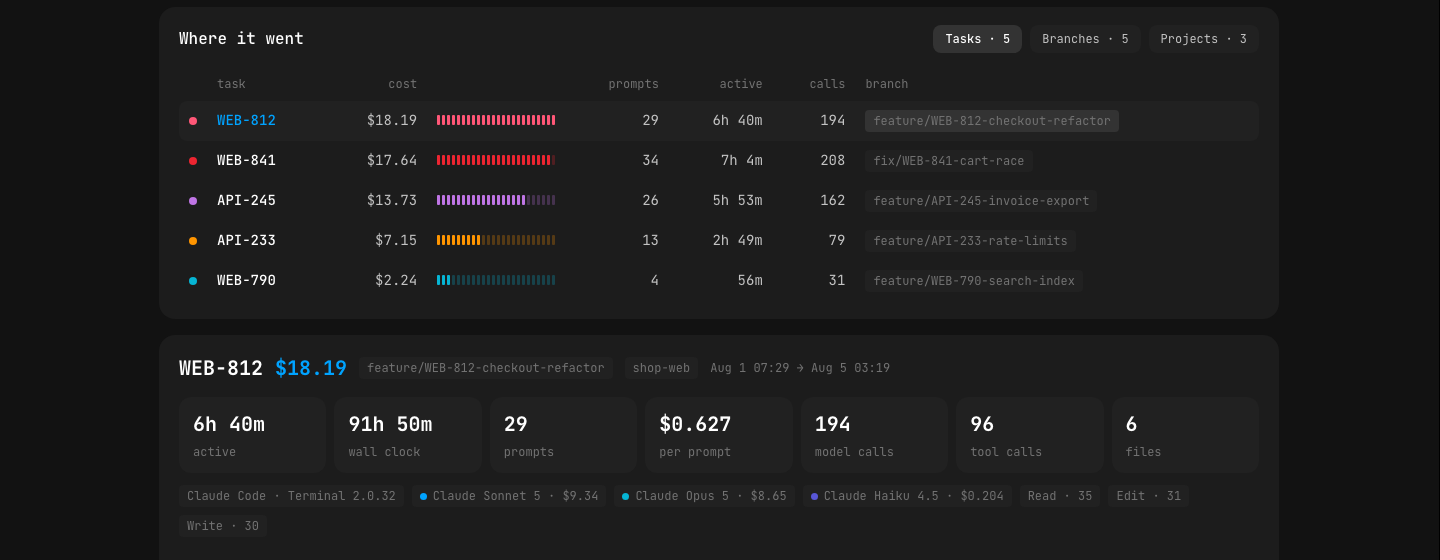
Which task cost what
That is the table above, and it is the whole point of this tool.
Note its last line. Work that happened outside a repository, or on a branch with no ticket key
in its name, cannot be attributed — so it is reported as its own number instead of being
spread across the tasks to make the table look complete. pandev task breaks that remainder
down by project, so you can see what it consists of rather than guessing.
Getting this right is harder than it looks. Claude Code writes HEAD into its logs instead
of a branch name — every single event, no exceptions. Per-task numbers built naively from those
logs are wrong, and wrong by a lot: on our own data a single task came out overstated 70×.pandev reconstructs the real branch at each timestamp from git reflog. That reconstruction
is what makes the number above worth reading.
Then: which prompt inside that task
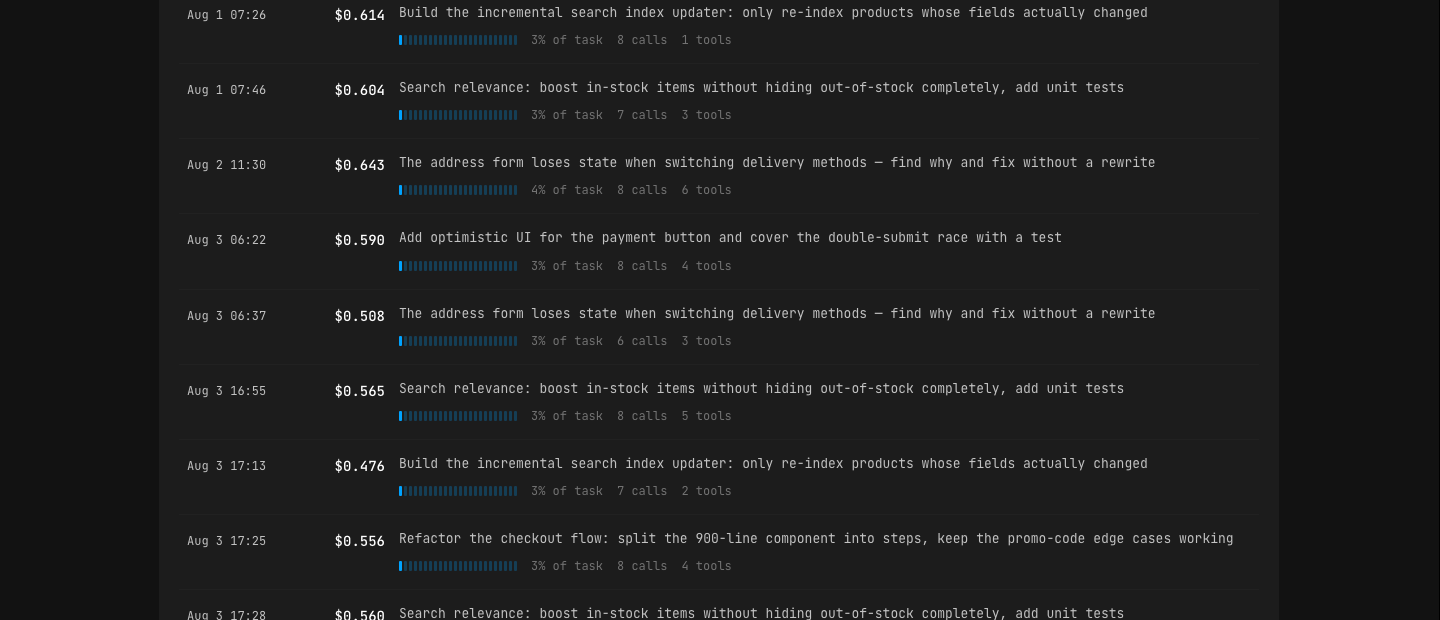
Pick the expensive one and look inside it.
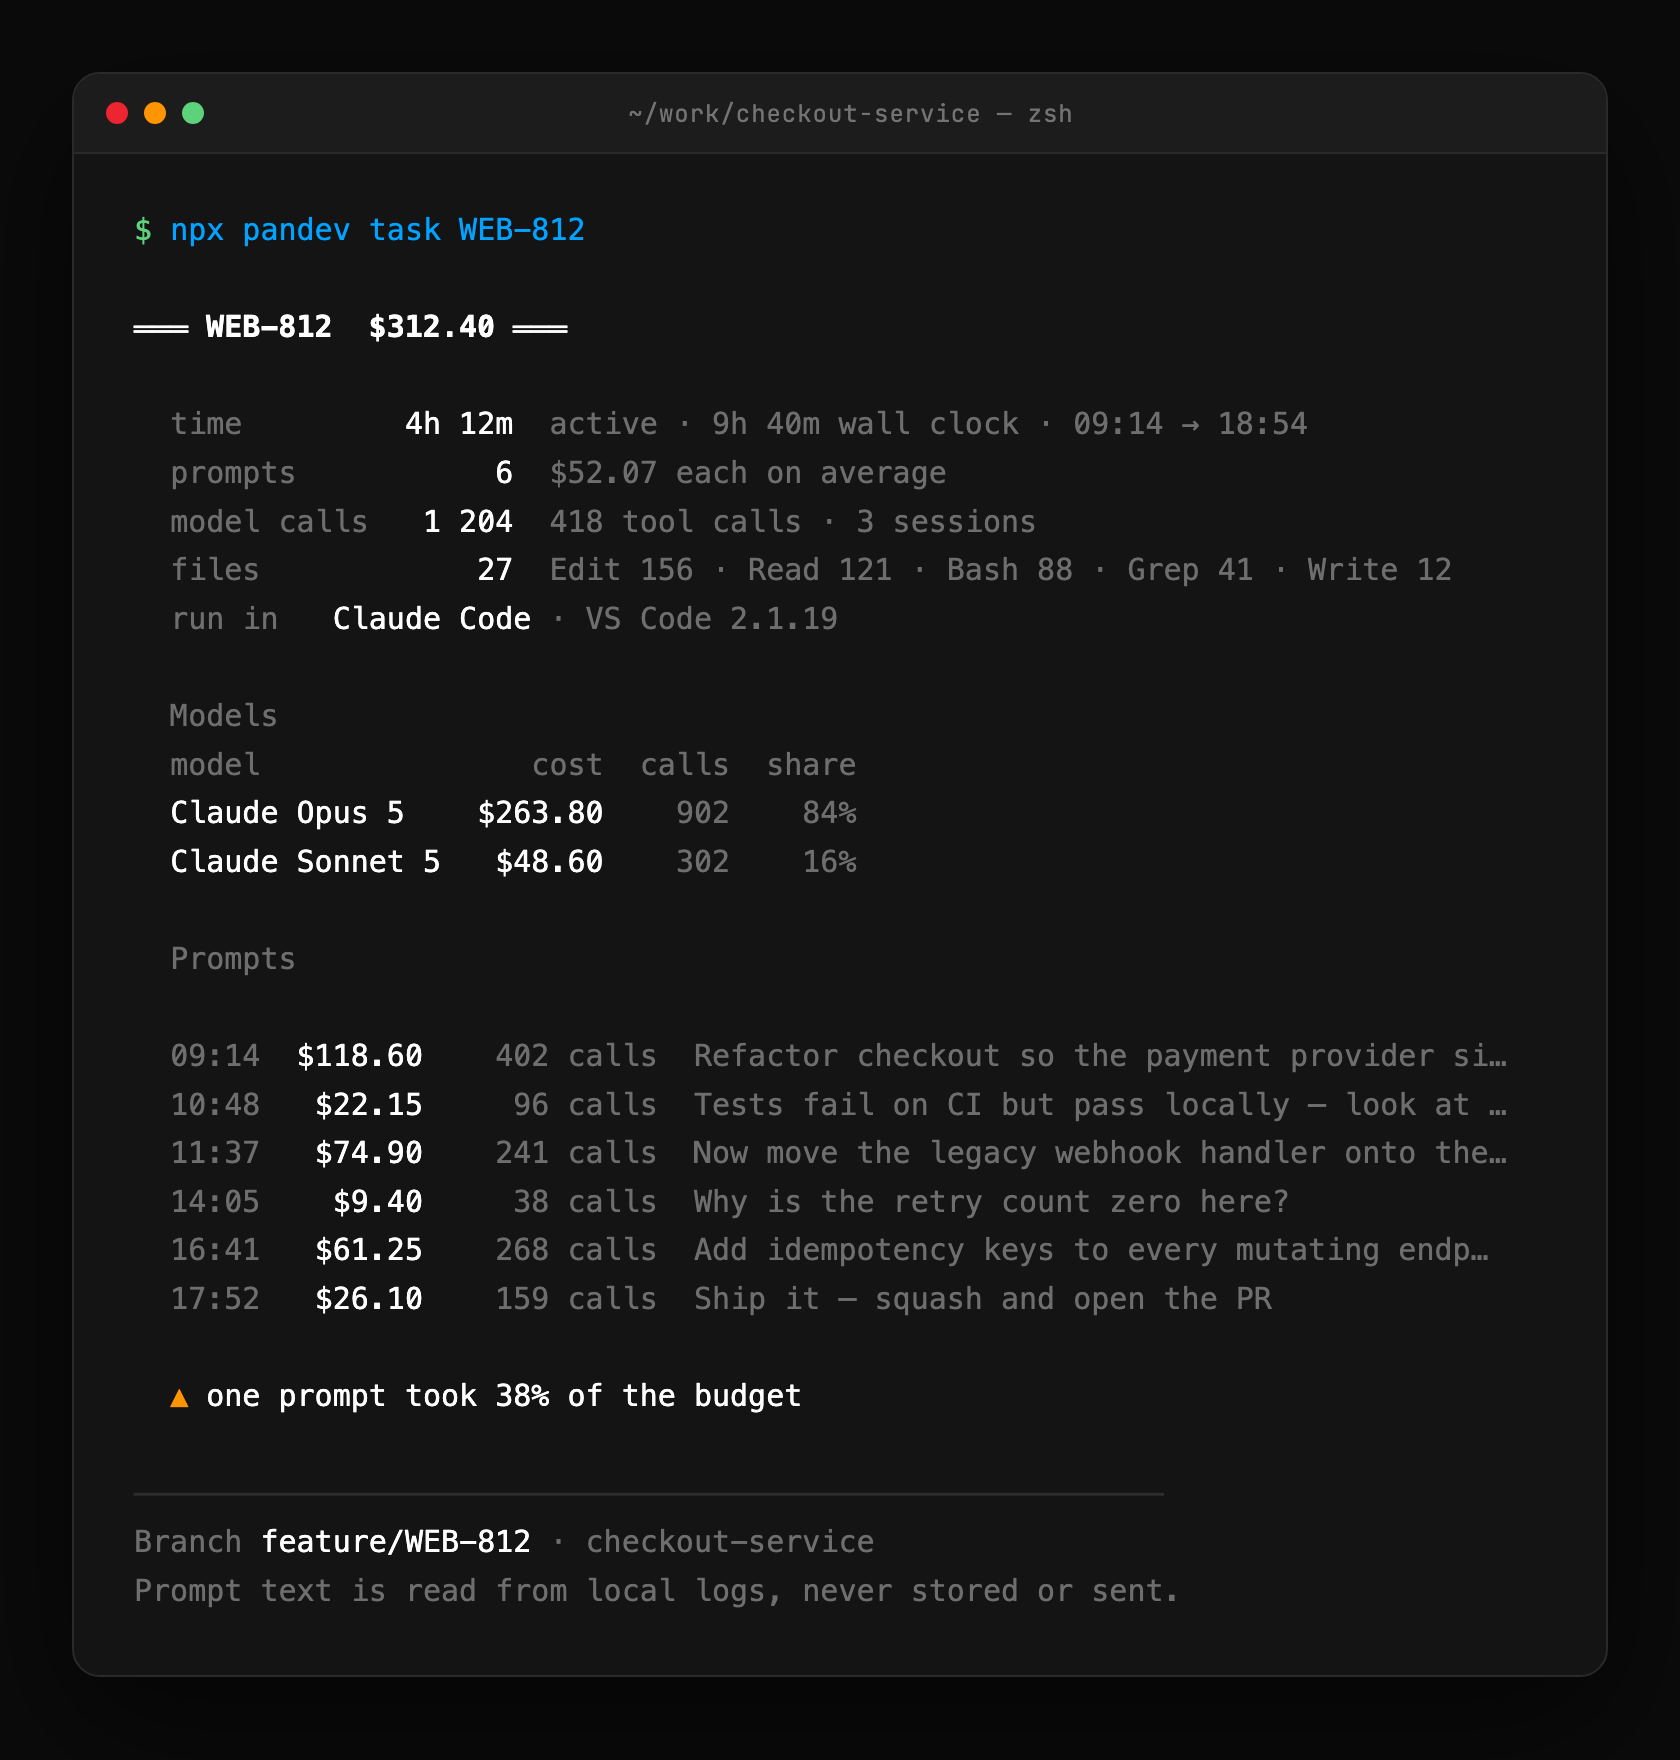
One prompt took 38% of the whole task. That is the actionable unit — not the day, not the
session, but the specific thing you asked for and what it cost to answer.
You also get what the totals hide: active time against wall-clock, which model actually did
the work, which editor it ran in, and how many rounds each file went through.
Prompt text is read straight from your local logs to print this. It is never stored and never
sent — see Privacy.
And underneath: where the volume goes
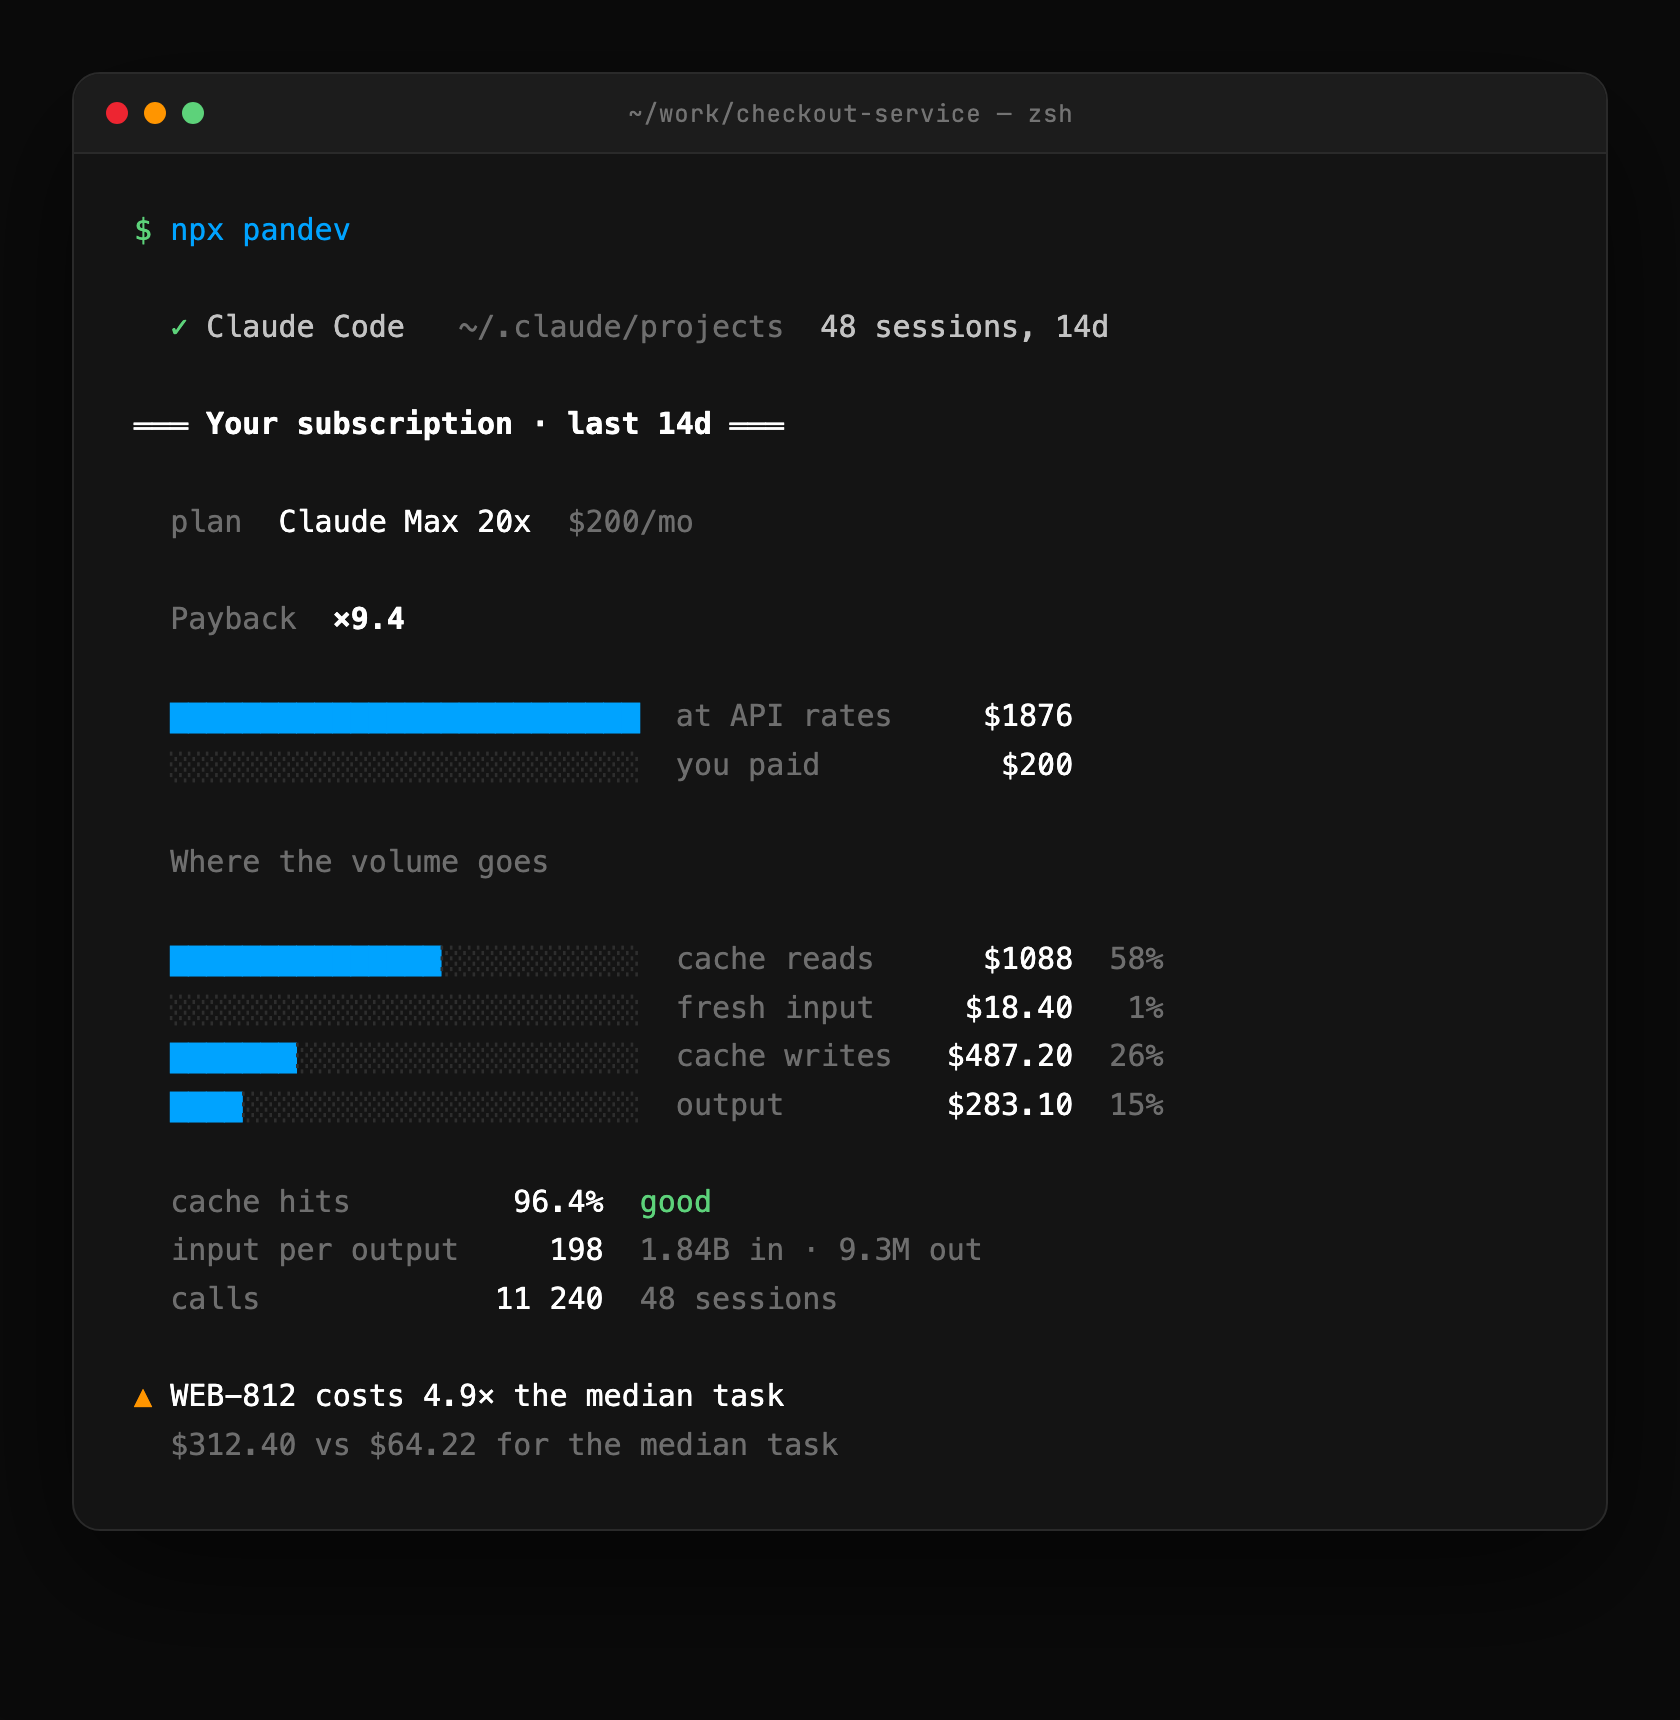
Cache reads, cache writes, fresh input and output are four different prices. A bill that looks
alarming is usually cache reads — and the fix for that is a prompt change, not less work. You
cannot see any of that from a single total.
If you are on a subscription rather than API billing, the same view tells you what your usage
would have cost at API rates, which is the only honest way to know whether the plan pays for
itself.
The dashboard: your numbers, on a bookmark
pandev web serves all of the above as a live dashboard at http://127.0.0.1:4976
(loopback only — invisible from outside your machine; if the port is busy it walks up to 4985)
and opens it in your browser. Numbers refresh from your logs on every visit.
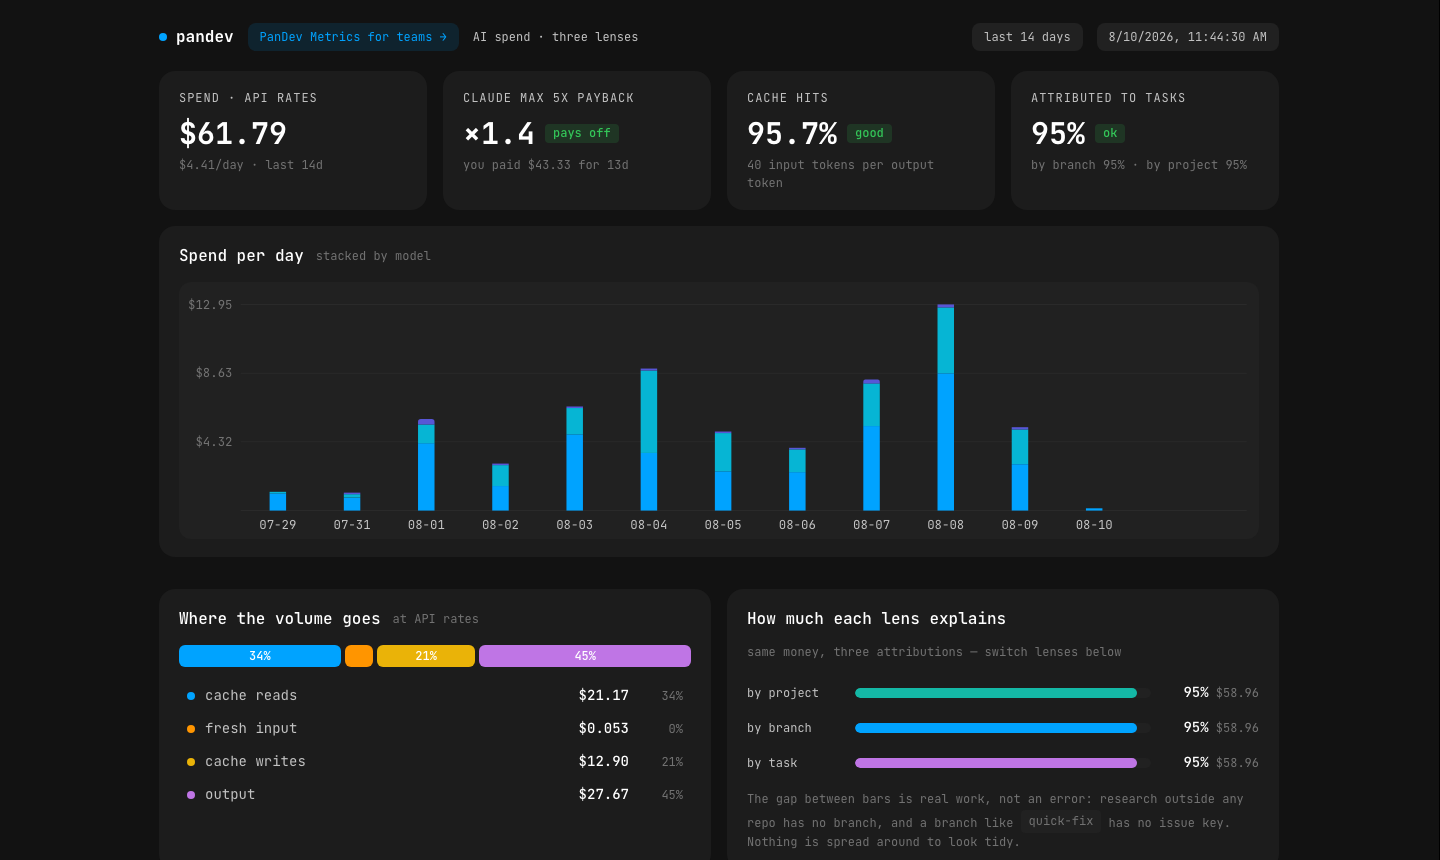
The same three lenses as the terminal — tasks, branches, projects — with every prompt priced
inside each task:
Two things worth knowing:
- It can meet you at login.
pandev autostart onregisters a user-level login item
(launchd on macOS, systemd user unit on Linux) that starts the dashboard server and opens
it once when you log in. The first interactive run offers this automatically — and tells
you so;pandev autostart offremoves every trace with one command. Bookmark the page
(⌘D / Ctrl+D) and your spend is one keystroke away. - There is also a fully offline copy —
~/pandev-cost.html, a single self-contained
file (0600, owner-only) that makes zero network requests. It contains your prompt text,
so treat it like the logs it came from.
Commands
npx pandev@beta |
summary for the last 14 days |
npx pandev@beta today |
today only |
npx pandev@beta task |
cost per task |
npx pandev@beta task WEB-812 |
one task: every prompt, time spent, files touched, tools used |
npx pandev@beta files |
cost by file, with edit rounds |
npx pandev@beta models |
cost and cache behaviour per model |
npx pandev@beta why cache |
how prompt caching actually played out |
npx pandev@beta why ratio |
context read per unit of output |
npx pandev@beta web |
dashboard at http://127.0.0.1:4976 + offline copy (alias: dashboard) |
npx pandev@beta autostart on|off |
dashboard at login — on or off with one command |
npx pandev@beta team |
team plans: book a live demo |
npx pandev@beta privacy |
what is read, and what leaves this machine |
Add --json to any command for machine-readable output, --days N to change the window,--no-open to serve the dashboard without touching your browser.
Privacy
This tool reads your agent logs. Those logs contain your prompts, fragments of your code and
sometimes your secrets. You should not take anyone's word about what happens to them —
including ours.
So, plainly:
- No outbound network calls from the binary. No telemetry, no analytics, no accounts —
there is nothing to sign into and nothing that phones home. - The dashboard server is loopback-only.
pandev weblistens on127.0.0.1:4976and
answers your own browser. It is not reachable from the network, and it sends nothing out. - One anonymous version check — from your browser, not the binary. The served dashboard
page asksregistry.npmjs.orgfor the latest version number so it can tell you when the
beta moved on. No data goes with it, and the offline file copy never does even that. - The login item is opt-out and transparent. The first interactive run enables the
dashboard-at-login service and says so in plain text;pandev autostart offremoves it
completely. Pipes,--jsonand CI never trigger it. - Nothing is written except the dashboard file (
~/pandev-cost.html,0600, owner-only)
and — if autostart is on — the login item itself.
npx pandev@beta privacy prints the full list of what is read and what is taken from it.
And here is how to check that for yourself, without trusting us — network activity is
observable from outside the process, so the claim is verifiable even though this is not open
source: docs/VERIFY.md.
Requirements
Node 20 or newer for npx. Optional but recommended: git on your PATH — without it,
per-task attribution is switched off and you get totals only. The dashboard wants port4976 free on localhost (it walks up to 4985 by itself if not).
Reads logs from:
- Claude Code —
~/.claude/projects - Codex CLI —
~/.codex/sessions - opencode —
~/.local/share/opencode/opencode.db, read-only via your localsqlite3 - ZCode —
~/.zcode/cli/db/db.sqlite, read-only via your localsqlite3
Nothing else is scanned.
Working in a team?
This tool is deliberately single-player. It reads what is on your machine and answers
questions about your work.
If the question turned into "how does this compare across the team", "which projects burn the
most", or "what does AI actually cost us per delivered ticket" — that is
PanDev Metrics, and it is a different product.
Book a live demo — or just run npx pandev@beta team.
License
Proprietary — see LICENSE. Free to install and run on machines you own or control,
including at work. Redistribution, modification and derivative works are not permitted.
Cost figures are estimates computed from published provider rate tables. They are not an
invoice. Reconcile against your provider's own billing.
Reviews (0)
Sign in to leave a review.
Leave a reviewNo results found