trail
Health Warn
- License — License: MIT
- Description — Repository has a description
- Active repo — Last push 0 days ago
- Low visibility — Only 6 GitHub stars
Code Fail
- rm -rf — Recursive force deletion command in install.sh
Permissions Pass
- Permissions — No dangerous permissions requested
No AI report is available for this listing yet.
Capture process logs and serve them to AI coding agents over MCP.
trail
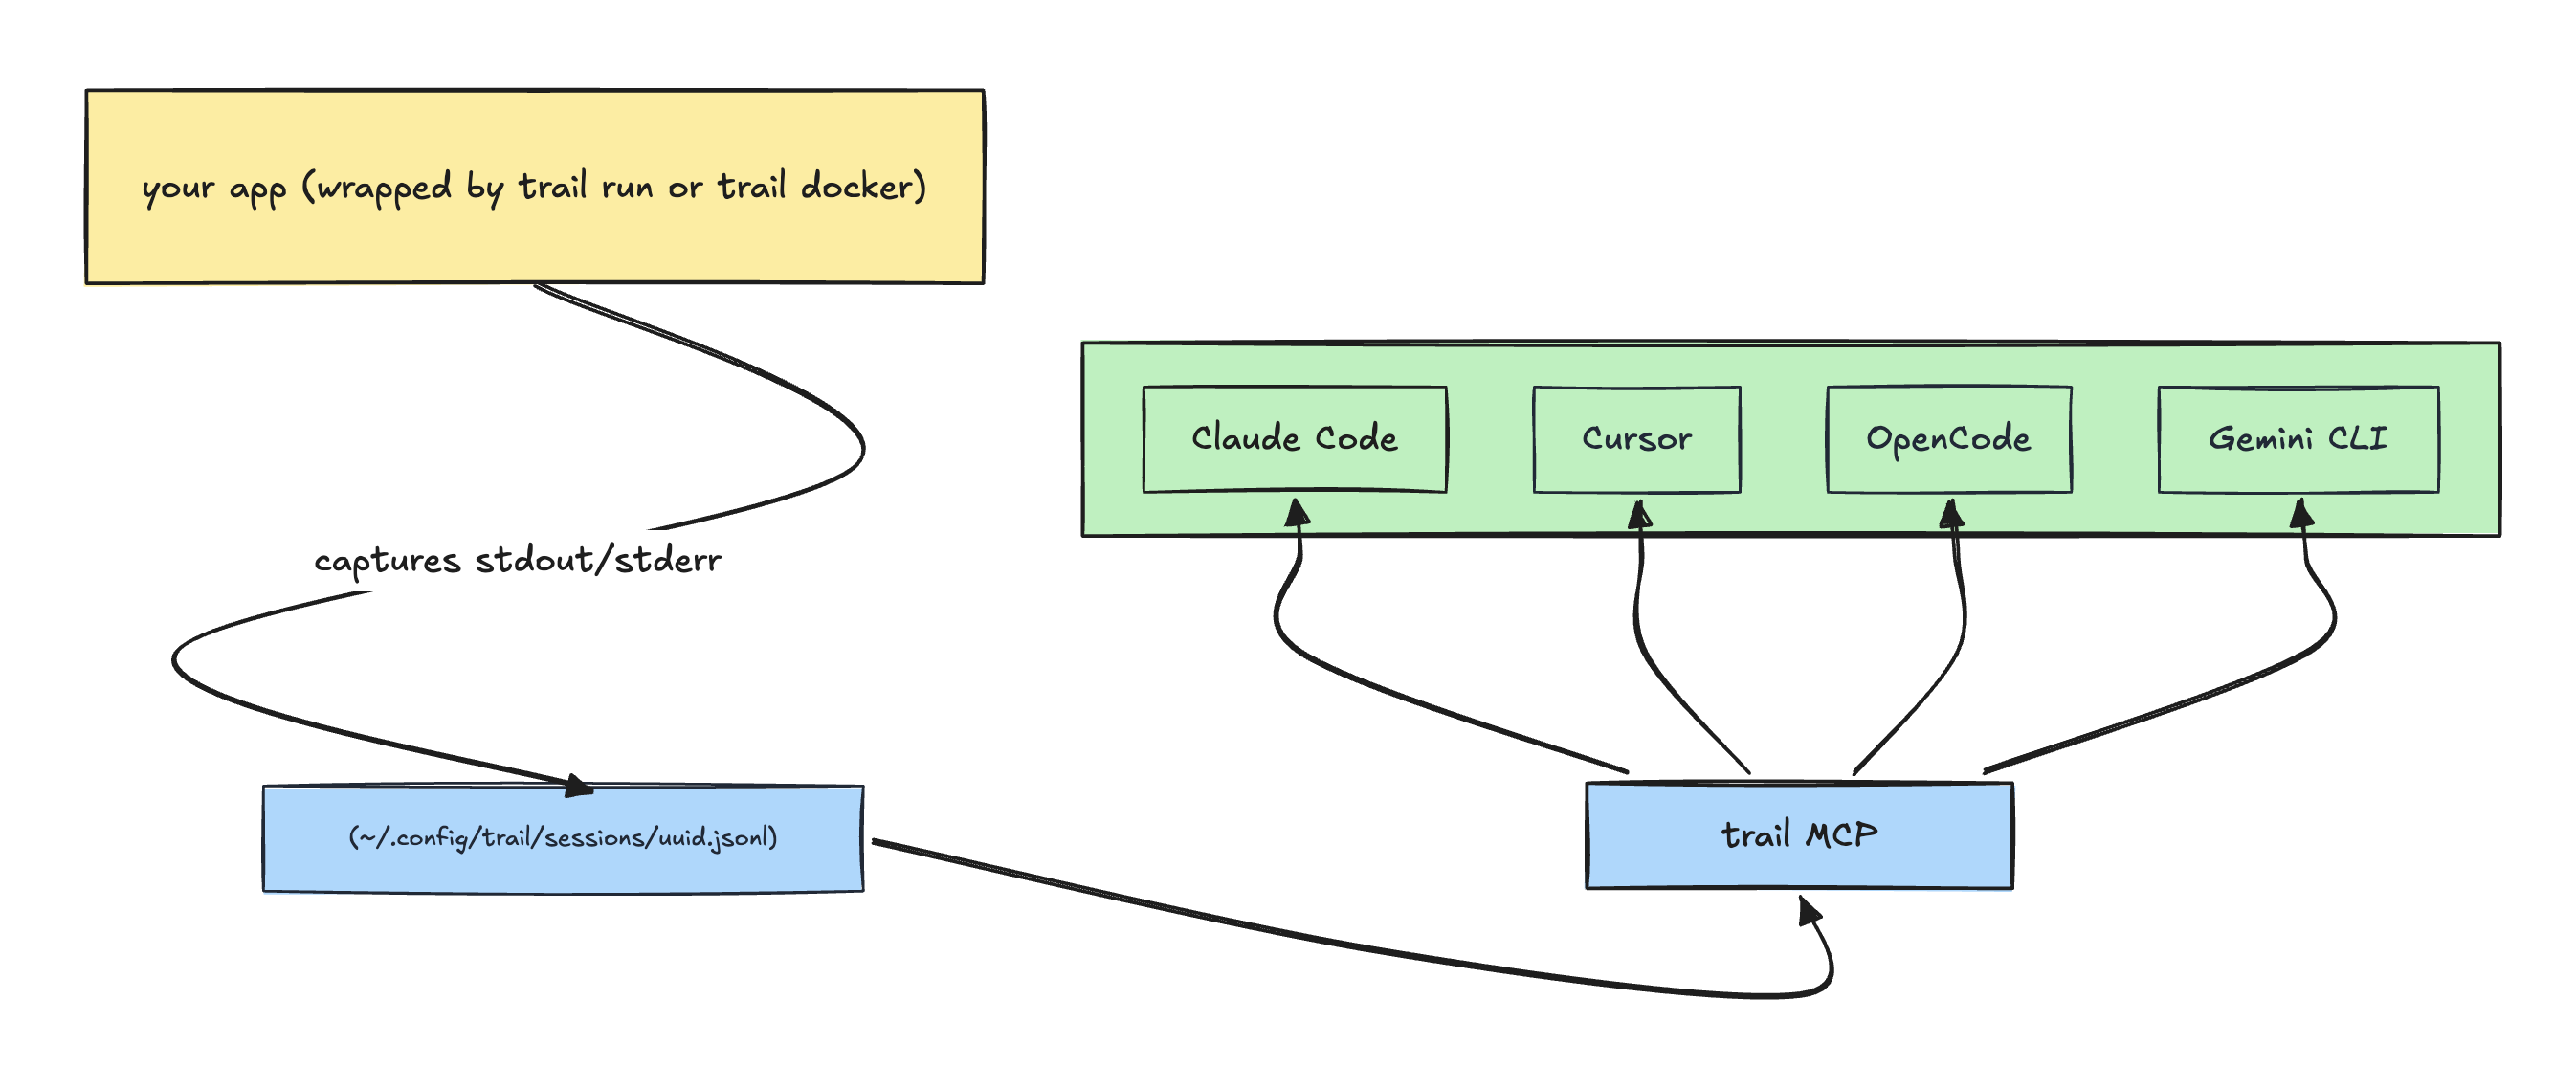
Capture stdout/stderr from any process into per-session JSONL files on disk, and expose those logs to AI coding agents over a stdio MCP server. Single static binary. No daemon, no database, no cloud.
Run your app under trail, ask your AI agent what went wrong.
What it actually does
trail run -- <cmd>— wraps any command, captures both stdout and stderr to a session file, forwards signals, mirrors the child's exit code. Works fornpm run dev,python -m http.server,cargo run, anything.trail docker <container>— same, but for an already-running Docker container (wrapsdocker logs -f).trail mcp— runs a stdio MCP server (list_sessions,get_logs) so any MCP-capable agent can query the captured logs without having to read raw files into its context.trail logs --session <id>— same query surface as the MCP tools, but in the terminal for humans.trail sessions— list / inspect / delete captured sessions.
Captured logs are plain JSONL on disk. Any tool that can read a text file can read them — cat, jq, grep, your editor, your scripting language. The MCP server is just one way to query them.
Install
One-liner (recommended)
curl -fsSL https://raw.githubusercontent.com/Pratham-Mishra04/trail/main/install.sh | sh
Detects your OS/arch, downloads the matching prebuilt binary from the latest GitHub Release, verifies its SHA-256 checksum, and drops it in ~/.local/bin/trail. If ~/.local/bin isn't on your $PATH, the script prints the exact export line to add it. Override the destination with BIN_DIR=/usr/local/bin (you'll need write access to that path) or pin a version with VERSION=v0.1.0.
wget works too:
wget -qO- https://raw.githubusercontent.com/Pratham-Mishra04/trail/main/install.sh | sh
Manual download
If you'd rather not pipe a script into your shell, grab the archive directly:
# pick the right archive for your platform
ARCHIVE=trail_darwin_arm64.tar.gz
BASE=https://github.com/Pratham-Mishra04/trail/releases/latest/download

# 1. download the archive and the checksums file
wget "$BASE/$ARCHIVE"
wget "$BASE/checksums.txt"

# 2. verify SHA-256 (use sha256sum on Linux, shasum -a 256 on macOS)
grep " $ARCHIVE\$" checksums.txt | shasum -a 256 -c -

# 3. only extract and install after verification succeeds
tar xzf "$ARCHIVE"
sudo mv trail /usr/local/bin/
Available archives: trail_darwin_arm64.tar.gz, trail_darwin_amd64.tar.gz, trail_linux_arm64.tar.gz, trail_linux_amd64.tar.gz.
Via go install
go install github.com/Pratham-Mishra04/trail@latest
Build from source
git clone https://github.com/Pratham-Mishra04/trail
cd trail
make install
This runs go install with version metadata baked in. The binary lands at $(go env GOPATH)/bin/trail — make sure that's on your $PATH.
Verify
trail version
# trail 0.1.3 (commit 531e588..., built 2026-05-05T21:17:04Z)
If you installed via go install, version metadata isn't injected (Go's stdlib go install doesn't pass -ldflags), and you'll see trail dev (commit none, built unknown) instead. That's expected — the binary works the same; only the reported version string differs.
Supported platforms: macOS and Linux on amd64/arm64. Windows is not supported.
Claude Code plugin (recommended for Claude Code users)
If you use Claude Code, install the plugin in addition to the binary above. It auto-wires the MCP server and registers the debug-with-trail skill:
/plugin marketplace add Pratham-Mishra04/trail
/plugin install trail@pratham
/reload-plugins
Verify by asking "What skills are available?" — pratham:trail:debug-with-trail should appear. For other editors (Cursor, Windsurf, Claude Desktop) or for using Claude Code without the plugin, see Editor setup.
Quickstart
# 1. Wrap your app under trail.
trail run -- node server.js

# trail prints a startup banner with the session name, session id, and
# file path, then forwards your app's stdout/stderr through to the terminal
# while capturing every line to the session file.
In another terminal (or in your AI editor):
# 2a. Query from the CLI:
trail sessions
trail logs --session 9c5e1b7e-... --level error
trail logs --session 9c5e1b7e-... --query "ECONNREFUSED"
# 2b. Or just ask your AI agent:
"List my trail sessions, then show me the errors from the most recent one."
The agent calls list_sessions and get_logs over MCP and gets back structured results.
Use cases
The common thread: your terminal is producing more output than you want to copy-paste, and your agent's context window is precious. Capture the run with trail, hand the agent a session ID, and let it filter server-side.
- Debugging a running app. Wrap your dev server (
trail run -- npm run dev,trail run -- python manage.py runserver, …) and when something breaks, ask your agent to look at the latest session. The Claude Code plugin ships an opinionated workflow for this — see Agentic debug sessions below. - Investigating long test runs.
trail run -- go test -v ./...(orpytest -v,cargo test -- --nocapture,npm test) captures every line. When the suite finishes, hand the agent the session ID — "what failed in trail session 9c5e1b7e and why?" — instead of scrolling thousands of lines or pasting them into the chat. Add--ephemeralif you only need the capture for the duration of the run — the file is deleted when the capturer exits cleanly. - Build / lint / typecheck output. Long compiler runs, warning floods, mass-rename type errors. Capture once, then query by
level=erroror by a regex matching the symbol you care about. - Comparing flaky runs. Run the same test twice under trail, give the agent both session IDs, and ask what differs between the passing and failing run.
- Long-running scripts and migrations. Backfills, data migrations, deploy scripts — keep a permanent, queryable record instead of relying on terminal scrollback. You can ask later: "what did the migration on session X actually do?"
- Noisy Docker containers.
trail docker <name>attaches to an existing container's log stream without flooding your agent's context — same query surface, same workflow.
In every case the pattern is the same: attach a terminal session to your agent by handing it an ID, instead of piping the output through prompts.
Agentic debug sessions
The Claude Code plugin ships with a debugging skill (debug-with-trail) that turns your editor into a full debug-mode-style workflow — comparable to dedicated debug features in other AI editors, but built on the open MCP layer so it works with any agent that loads the skill.
You ask in plain English:
"my Express server is throwing 500s on POST /orders, debug it"
Claude (via the skill) walks through a four-phase workflow without further prompting:
Phase 1 — Prerequisites. Verifies trail is installed and that the right process is being captured. If your app isn't currently wrapped under trail, Claude tells you to restart it with trail run -- <your command> and waits.
Phase 2 — Read existing logs first. Calls get_logs(level="error") and get_logs(query="orders") on the active session. If the bug is already visible in the captured output, Claude diagnoses from there — no instrumentation, no restart, no waiting.
Phase 3 — Targeted instrumentation when existing logs aren't enough. Picks a unique marker (e.g. TRAIL-DEBUG-7K3F) and adds temporary log statements at suspect points: function entry, before/after risky calls, inside conditional branches, around error returns. Asks you to restart and reproduce. Captures the new run, queries with the marker, iterates until it has enough information.
Phase 4 — Mandatory cleanup. This is non-optional. Claude greps for the marker, removes every line that carries it, verifies a second grep returns zero results, and reports to you what was instrumented, what was found, and confirmation that nothing was left behind.
The whole flow is opinionated for safety: every added log line has a unique session-scoped marker so cleanup is surgical, the marker rule is "fresh ID per debug session" so parallel debugging efforts don't interfere, and the grep == 0 verification is a hard gate before Claude considers the task done. Read the full skill at integrations/claude-code/skills/debug-with-trail/SKILL.md — it's the exact instructions Claude follows.
Editor setup
For Claude Code, the plugin is the recommended path — see Claude Code plugin above. The configs below cover other editors and the no-plugin fallback for Claude Code.
Claude Code (without the plugin)
claude mcp add trail -s user -- trail mcp
You get the MCP tools without the bundled debug skill — Claude figures out how to use the tools from their descriptions.
Cursor
.cursor/mcp.json:
{
  "mcpServers": {
    "trail": {
      "command": "trail",
      "args": ["mcp"]
    }
  }
}
Windsurf
Settings → MCP, same shape:
{
  "mcpServers": {
    "trail": {
      "command": "trail",
      "args": ["mcp"]
    }
  }
}
Claude Desktop
claude_desktop_config.json:
{
  "mcpServers": {
    "trail": {
      "command": "trail",
      "args": ["mcp"]
    }
  }
}
In every case trail must be on the $PATH of the shell that launches the editor. macOS app launches don't always inherit your shell $PATH — if the MCP server fails to start, that's usually why; which trail from the editor's terminal is the fastest check.
Why server-side queries
When an agent reads raw log files into its own context to filter them, every query pays for re-loading the file's tokens through the LLM. Trail's MCP tools run the filter (level, regex, time window, line range, pagination) in the Go process and return only the matching entries. The agent sees a structured result, not a wall of text.
This means:
- The agent doesn't burn its context window on log lines that won't end up mattering.
- Filters are deterministic — a regex returns exactly what matches, not "what the model decided was interesting."
- Latency stays bounded by the filter (typically sub-100ms) rather than by token-generation speed.
What it captures
| Source | Command | Notes |
|---|---|---|
| Wrapped command | trail run -- <cmd> |
Wraps any binary; exec.Cmd with separate stdout/stderr pipes preserves stream attribution. |
| Docker container | trail docker <name> |
Wraps docker logs -f; passes --since through. |
Both commands accept --name <label> to override the auto-derived session name and --ephemeral to delete the session file when the capturer exits cleanly (the file survives a SIGKILL of the capturer — only graceful shutdown triggers cleanup).
What it does not capture:
- A bare PID you didn't start under trail (would require
ptrace/eBPF— out of scope). - Arbitrary log files written to disk by some other tool (use
tail,lnav, etc).
Querying captured logs
From an AI agent (via MCP)
The MCP server exposes two tools:
list_sessions(active_only?, limit?)— returns session metadata including the absolute file path of each session's JSONL file, ordered active-first.get_logs(session_id, filters?)— returns matching entries. Filters:limit,page,query(case-insensitive regex),level(error|warn|info|debug|unknown|all),start_time/end_time(RFC3339),duration(Go-style:"10m","2h"),start_line/end_line,order(newestdefault, oroldest). Time-window, duration, and line-range filters are mutually exclusive — combining them returns an error.
If the result looks incomplete, the response includes the absolute file_path and the agent can read the JSONL file directly with its file tools.
From the terminal
trail sessions                                       # table
trail sessions --json                                # JSON for scripting
trail sessions rm <id>                               # delete one
trail sessions rm --all                              # delete all

trail logs --session <id>                            # last 100, pretty
trail logs --session <id> -n 50                      # last 50
trail logs --session <id> --level error              # errors only
trail logs --session <id> --query "ECONNREFUSED"     # case-insensitive regex
trail logs --session <id> --format json              # raw JSON entries
trail logs --session is required (no implicit "most recent" default — the same rule the MCP tool enforces, on purpose).
How it works
- Two-process model. Capture processes (
trail run/trail docker) own session files. The MCP server is read-only and spawned by the editor on demand; it never starts, modifies, or stops captures. They share only the filesystem. - One JSONL file per session at
~/.config/trail/sessions/<uuid>.jsonl. First line is a meta header (session id, name, source, capturer pid, started_at, file path). Every subsequent line is one captured entry. - Append-only writes under
PIPE_BUFso kernel writes are atomic; no locking. Concurrent reads work without coordination. - Server-side filtering uses
gjsonfor cheap pre-filter peeks (level, time, line) andsonicfor full decode only on entries that pass. "Newest N" queries use a reverse scan: seek to file end, walk backwards in chunks, stop after N matches — constant time regardless of file size. - Conservative log-level detection. Only sets a non-
unknownlevel when there's clear evidence: a JSONlevelfield, a logfmtlevel=pair, or an anchored line-prefix pattern (ERROR:,INFO[...],WARN ...). Free-text matches like substring"info"are deliberately not supported to avoid false positives.
License
MIT
Reviews (0)
Sign in to leave a review.
Leave a reviewNo results found