ripwire
Health Warn
- License — License: Apache-2.0
- Description — Repository has a description
- Active repo — Last push 0 days ago
- Low visibility — Only 7 GitHub stars
Code Pass
- Code scan — Scanned 12 files during light audit, no dangerous patterns found
Permissions Pass
- Permissions — No dangerous permissions requested
No AI report is available for this listing yet.
The ripgrep of AI context: a zero-dependency C++23 CLI + MCP server giving coding agents a ranked, deterministic map of any repo, blast radius, tests-to-run and quality deltas. Signatures at 80% fewer bytes than bodies; ~5% of a grep-and-read pass's tokens.






Rip'n Fast. Less Tokens. Better Code.
Give your coding agent a map before it reads the repo.
ripwire is the ripgrep of AI context. Point it at any repository and your agent gets a ranked,
deterministic call graph — what to touch, what it breaks, which tests to run — instead of grepping
around and reading whole files.
Languages: Rust · C++ · Objective-C/C++ · C · Metal · CUDA · Python · Go · Swift · TypeScript ·
JavaScript · Java · Ruby · PHP · Lua · Bash · C# · JSON · TOML · YAML · Markdown — twenty-one
vendored grammars, and adding another is a vendored tree-sitter grammar plus one row in a
declarative table.
See the map — not just the numbers
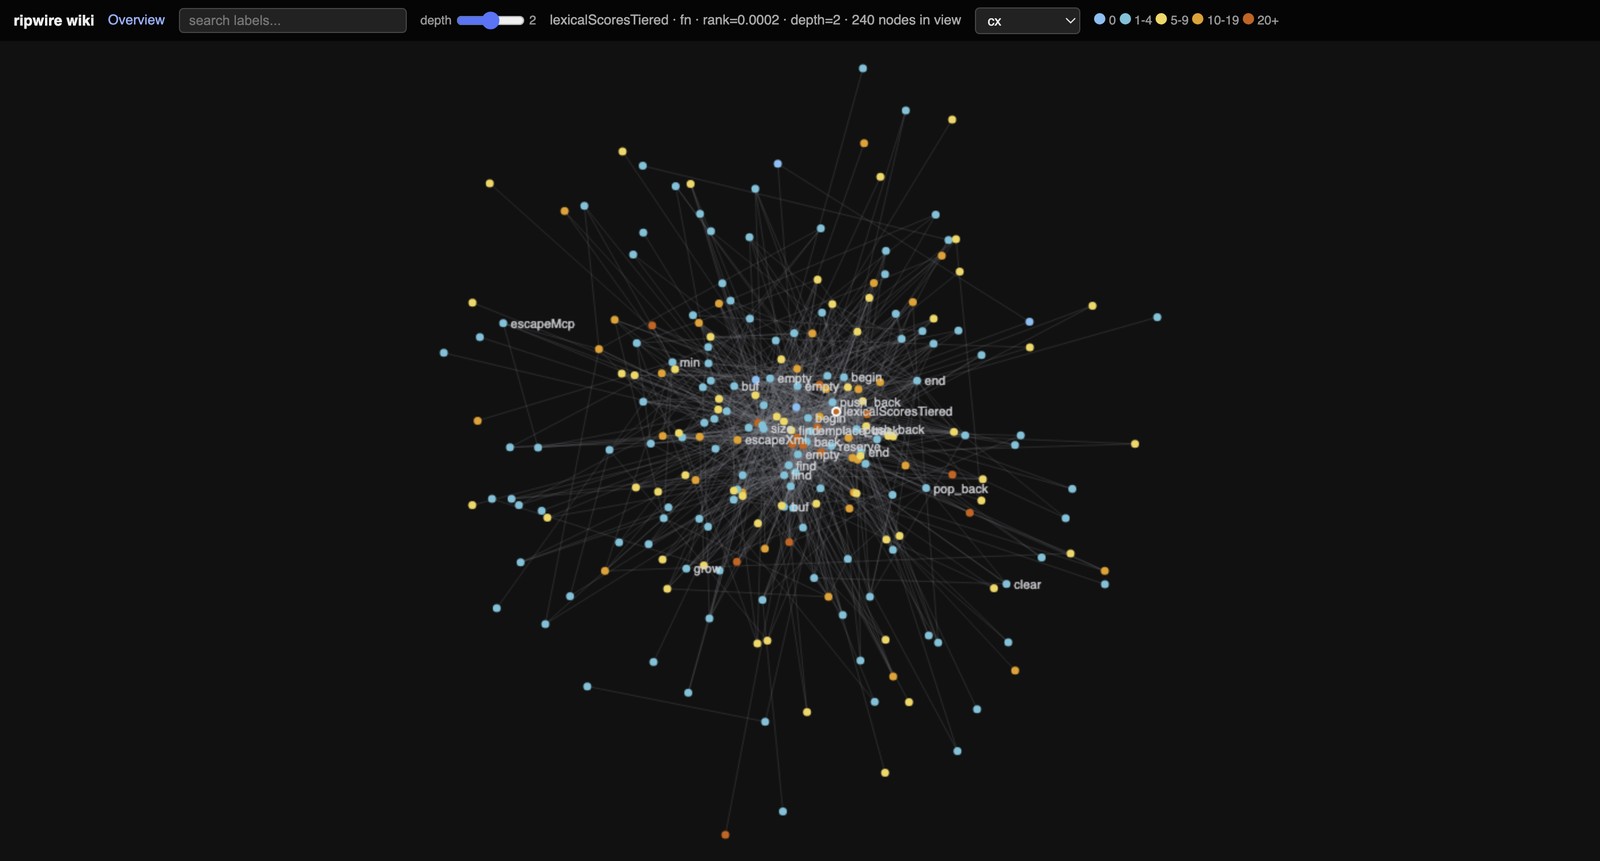
One self-contained HTML file (--html[=FILE]), no server, no CDN, click any node to recentre. --color-by=lang|community|cx|churn|tested sets the initial node colour; the page embeds all five and keeps a live selector. Shown here: cx — cyclomatic complexity — over the depth-2 neighbourhood of lexicalScoresTiered, 240 of this repository's own symbols; churn colours the same graph by git history instead. Both share one five-stop blue-to-orange scale rather than the usual green-to-red, so reading it never depends on telling red from green.
No API key. No embeddings. No index server. No daemon.
One self-contained binary on your own machine, offline, installed in one line — and the same line
installs and activates the task-shaped skills that teach your agent when to reach for it, not
just how, for every agent it finds on the machine. If your
agent can run shell commands — Claude Code, Codex, Cursor, Windsurf, Gemini, opencode, aider — it is
set up the moment the install finishes; the MCP server is the optional second
interface. Install it and ask it something before you finish
reading this page:
RIPWIRE_REPO=redhat-et/ripwire bash -c "$(curl -fsSL https://raw.githubusercontent.com/redhat-et/ripwire/main/scripts/install.sh)"
ripwire . --for="incremental cache invalidation"
One deterministic, token-budgeted answer: the relevant symbols, their callers, the change risks, and
the tests that reach them. Run on this repository (2026-08-30), that second line answers in about
4.3K tokens with:
- The ranked symbols, in rank order — the cache-header constant
kCacheMagicfirst (with its doc
comment quoted in place and the onenext=call that opens it), thenspanTierMemoPath(the
cache-path composer),ingestCommitTree, …ingest— each row with its file, line, and signature. - Risk, annotated in place — complexity, git churn (
ingestshows 128 recent edits),
change amplification (touchingestand 266 graph nodes feel it), purity and test coverage. The
fragile spots are visible before anything touches them. - One-hop call context —
spanTierMemoPathcallsshaKeyedCachePath,headSnapRepoHex,exclConfigHex; no second query needed to see the neighbourhood. - Its own confidence — this answer says
confidence="high"with the score margin attached; a
flat ranking sayslow, so it reads as a starting point instead of masquerading as an answer.
<ctx task="incremental cache invalidation" confidence="high" margin_pct="20"
     bundle="compact" bodies="0" reason="compact-route" est_tokens="3995">
  <sigs shown="23" total="40" capped="1">
    <d l="106" n="kCacheMagic" p="src/ingest_cache.h" cx="0" in="0" churn="11" amp="71" pure="1" r="1"
       next="--expand=src/ingest_cache.h:kCacheMagic">
      <doc>incremental cache (--cache): per-file content hash + raw facts so a
           re-run re-parses ONLY …</doc>constexpr std::uint32_t kCacheMagic = …</d>
    <d l="1307" n="spanTierMemoPath" p="src/ingest_astquery.h" cx="1" in="2" churn="5" amp="44" r="2"> … </d>
    <d l="247" n="ingestCommitTree" p="src/dmm.h" cx="6" in="1" churn="6" amp="27" r="3"> … </d>
    …
    <d l="191" n="ingest" p="src/ingest.cpp" cx="4" in="14" churn="128" amp="266" tested="1" r="13"> … </d>
    … </sigs>
  <hops shown="2" total="6" capped="1" noedge="2">
    <h l="1307" p="src/ingest_astquery.h" n="spanTierMemoPath">
      <calls total="3"><c n="shaKeyedCachePath" l="1621"/> … </calls></h> … </hops>
</ctx>
cx= complexity, churn= git edit frequency, amp= change amplification, r= rank; <hops> rows
carry the one-hop call context, caps disclosed. Every attribute is defined in the one legend at the
top of the real output, which also self-reports the bundle's cost — est_tokens="3995" here.
| The agent without a map | The agent with ripwire |
|---|---|
| greps a common word, gets hundreds of hits across dozens of files | one ranked answer — est_tokens="3995" on this repository (re-derived 2026-09-05, the run above) |
| reads whole files to find the symbols that matter | those symbols, with complexity, churn and test coverage inline |
| finds the callers only if it thinks to grep for them too | callers, blast radius and the tests to run, in the same bundle |
| pays for every line it read, right or wrong | measured at 5.0% of what that grep-and-read pass spends (re-derived 2026-08-23) |
And against five retrieval competitors on a held-out LocBench slice, it finds all gold files in
the top 10 on 58.3% of instances — the best alternative lands 40.0% — while indexing in 0.31 s.
The full leaderboard, losses included ↓
Same answer, a fraction of the tokens — read this table first if your agent is on a budget
Ten everyday moments, re-measured on this repository, 2026-08-08. Figures are ~tokens (≈ bytes/4);
every ratio comes from a real run, reproduced by the command in its row — raw byte counts and exact
commands indocs/EVALS.md §5.
Ordered understand → navigate → review-the-change:
| Ask it | Command | ripwire | naive read | token savings |
|---|---|---|---|---|
| "Orient me in this repo" | ripwire . |
~5.6K tok | ~20K–25K tok — read README.md (+docs/ARCHITECTURE.md) |
3.6×–4.5× |
| "Where is X handled?" | ripwire . --for="…" |
~2.1K tok | ~4.9K–20K tok — grep -rn <term> src/, then read the file it points at |
2.3×–9.3× |
| "What do I already know?" | ripwire . --recall="…" |
~15K tok | ~445K tok — read all 119 markdown docs this repo carries | 29.2× |
| "Set me up for this task" | ripwire . --pack-task="…" |
~2.1K tok | ~16K–80K tok — read every relevant file, whole | 7.7×–37.7× |
| "Show me this one function" | ripwire . --expand=SYM --top-k=0 |
~260–16.5K tok body (+~5.7K for the ranked-neighborhood bundle) | ~43K–174K tok — read the whole file it lives in | 2.6×–670× |
| "Who calls this function?" | ripwire . --callers=SYM |
~580 tok | ~40K–52K tok — grep -rn SYM src/ (mostly noise), then open 2–3 files to sort real calls from mentions |
69.2×–89.1× |
| "Is it safe to change this?" | ripwire . --impact=SYM + --uses=SYM |
~1.3K tok | ~18K tok — open every direct-use file, whole | 14.4× |
| "I have a stack trace" | ripwire . --from-trace=FILE |
~1.4K tok | ~124K–298K tok — grep all 7 frame names, then open the innermost file(s) | 86.9×–208.6× |
| "I changed these files — tests? blast radius?" | ripwire . --situ |
~410 tok | ~3K–132K tok — git diff + grep -rn <syms> test/, then open the candidates |
7.3×–324.2× |
| "Review this PR/diff" | ripwire . --pr-context=REF |
~1.9K tok | ~4.8K–51K tok — git diff REF, then open the touched files |
2.6×–27.5× |
These aren't summaries that gamble with information. Each row is scored
same-correct-answer-or-it-doesn't-count, and both sides were checked, not assumed: orient surfaces
this repo's own pipeline files (ingest.cpp, graph.h, serialize.h) in the first screen, the same
three docs/ARCHITECTURE.md names as central; the --for row lands mcpStale
(src/mcpindex.h:633), the actual staleness check, 5th-ranked; --recall lands the container-rule
doc (AGENTS.md) that states, verbatim, the same "no std::map" rule CONTRIBUTING.md explains in
full; --pack-task names the same three touch points a human would — cachelint.h, mergeCachePack
(src/main.cpp:1787), the lintrules.h helpers it reuses; --expand --top-k=0 hands back the
requested function's complete, unmodified body — the ranked-neighborhood addition costs the same
~22.6 KB regardless of which function you ask for, confirmed on two (a fixed floor, not per-function
variance); --callers on langOfPath names its 2 real callers, the same ones a grep hit-list
buries under 5 files of comment-only mentions; --impact+--uses on coversOrEquals names the same
2 direct call sites --uses alone would, plus (disclosed) a transitive reach --uses doesn't cover
at all; --from-trace resolves all 7 frames of a real call chain by name to the same definitions a
per-frame grep would eventually find, mixed with call sites and comments; --situ on a 2-file diff
names the same 6 real test harnesses, 2 of which a filename grep across test/ cannot find even
after opening every one of its 41 candidates — a completeness gap, not just a byte one; --pr-context
surfaces co-change partners (test/regression.sh, src/main.cpp) a raw git diff has no way to
know were usually touched and weren't this time. The map ranks and discloses — it never paraphrases
your code — and every truncation is disclosed in the header.
The honesty line, made concrete: the same auto-selection behind the --expand row also runs the
other way. On a small file (pageRankDouble in src/pagerank.cpp, 5,559 B) the ranked bundle would
cost 27,916 B — nearly 5× more than the file — so ripwire serves the file itself instead, disclosed
as mode="whole-file" on the response, not silently.docs/EVALS.md §7 lists that and the other counterexamples
this project publishes against itself.
Against the leading graph-database code-context MCP server
Won 27 · lost 7 · tied 14 on 48 matched questions across django, webpack and this repository,
spending ~77K tokens against its ~486K for the whole sweep.
The 48 questions span symbol lookup, conceptual search, blast radius, and one-call task orientation.
ripwire indexes the same three repositories in 0.25–0.45 s and 6.6–16.5 MB, against that server's
23–52 s and 391–623 MB, and answers a warm query in a median 197 ms against its 1,082 ms. Its seven
wins are real and named one by one in the method.
Both arms warm with a pre-built index, median of 3 timed calls, stdout to a file rather than a pipe.
The competitor ran in its stronger retrieval configuration; its numbers were recorded once and then
frozen, and ripwire's side was re-run after the fixes the first pass produced. Per class, as a share
of the competitor's bytes on totals: symbol lookup 1.35×, conceptual search 1.23×, blast
radius 0.39×, task orientation 0.06×.
Where it loses: on a plain one-symbol lookup the competitor answers in about a kilobyte carrying
callers and callees, and ripwire spends roughly three times that to also hand back the body. It
ranks a chunk-id plugin first on one webpack query where ripwire never surfaces the directory at
all — a ranking miss, and a fix for it was built, met its pre-registered band, and was reverted
anyway for failing a separate standing requirement. Its depth-labelled blast radius and its import
edges are both better presentations than ripwire's flat reaching-set.
Full method, pins, per-class tables, the carried-versus-re-judged ledger, and the complete list of
what the competitor does better:docs/EVALS.md §2.
Nothing it is unsure about reaches your agent unlabelled — and nothing it could not see goes
unnamed. Every guess is marked in the output, and every mark has a next step — up to handing it a
compiler-grade index. Point it at a repository whose main language it has no grammar for and the
map's first line says so (unindexed="ml:793,mli:607,…" on a facebook/infer clone); a file it
indexed but cannot vouch for carries a parse-health row; every file the crawl passed over is
itemized with its reason. A confident-looking map that lies by omission is the failure mode this
tool refuses.
What it misses, and what to run next →
Saves Tokens: It answers for a fraction of the context
On mid-task questions it had never seen, ripwire answers at 5.0% of what a grep-and-read pass
spends — 5.2% on the questions both arms fully answered. --pack-signatures returns 81% fewer
bytes than full bodies at top-50. The output is already dense enough that running a dedicated
context compressor over it saved exactly 0 tokens.
Both of those first two figures moved when they were re-derived on 2026-08-23, and they moved in
opposite directions — 7.3% → 5.0% overall, but 1.7% → 5.2% on the both-answered subset. Same
frozen questions, same frozen verb ladders, same corpus pin, same tokenizer; the naive arm reproduced
to the token. What changed is where ripwire spends: the compact conceptual route made its misses
much cheaper, while richer default bundles made the questions it answers dearer. Both numbers are
printed because printing only the one that improved would be the failure this project exists to not
commit. The full per-question re-derivation is in the Round 3 note under Measured.
It is also cheap enough to call on reflex: this repository parses in ~0.15 s cold and ~0.10 s
warm (time ./build/ripwire . --no-cache), so the agent asks instead of guessing.
Graph-Ranked Retrieval: It finds the right files more often than the alternatives
58.3% against 40.0% for the best tool tested — and it answers before they finish indexing. Every
arm below was re-run in full on 2026-08-08 — one ripwire binary (the profile-guided release build
that now ships), one evaluator, one 60-instance held-out LocBench slice: paired, zero exclusions,
same gold set, and the metric code imported unmodified into every arm. Strict file@10 = all gold files inside the top 10, which is whether
your agent starts in the right place at all.
| Round 4 — LocBench, Python-dominant | strict file@10 | any@10 | index (median) | query (median) |
|---|---|---|---|---|
ripwire --for |
58.3% | 85.0% | 0.31 s | 0.108 s |
| codebase-memory-mcp 0.9.0 | 40.0% | 63.3% | 1.24 s | 0.075 s |
| repowise 0.37.0 | 33.3% | 53.3% | 34.0 s | 1.159 s |
| graphify 0.9.34 | 31.7% | 46.7% | 7.82 s | 0.614 s |
| Aider repo-map 0.86.2 | 20.0% | 35.0% | (inside query) | 2.920 s |
| codeseek 0.1.31 (better of its two arms) | 15.0% | 20.0% | 3.37 s | 0.040 s |
Ripwire leads every arm on both accuracy metrics and in both strata. Paired, the losses are small and
they are published: 2 instances to codebase-memory-mcp, 2 to repowise, 1 each to graphify
and aider. Cold from nothing to an answer — parse, rank, reply, no cache — ripwire takes 0.213 s,
against a ~35 s index-then-query for repowise; its worst single index in this run was 352 s.
Three things this table costs us, said plainly. codebase-memory-mcp is the real runner-up at 40.0%,
not repowise — an earlier round credited it with 26.7%, and re-running it fairly raised it. The
margin over the best competitor is therefore 1.46×, not the 1.75× two separately-dated tables used
to imply. And multi-file gold is hard for everyone: ripwire leads the stratum at 21.4% strict, but
its own any@10 there is 78.6% — it finds a gold file and misses the siblings, and no arm in this
table solves that.
Held out wider — 243 instances across 78 repositories — ripwire lands 60.9% against 27.6%
for its own pre-routing baseline: +33.3pp paired, clustered-bootstrap 95% lower bound +25.0pp,
bought for +3.4% warm latency and −39.4% tokens. Full provenance, the losing instances one by one,
and a third round against a compression-layer competitor: Measured andbench/headtohead/r4-2026-08-06/, whose harness is committed so
anyone can re-run the whole comparison.
Test scaffolding does not pollute the ranking from inside source files either: #[cfg(test)] mod tests, describe() blocks, Test* classes and [Fact] attributes are detected syntactically,
wherever they live — not by file path alone. On an astral-sh/ruff clone (5,945 files),--ignore-tests removes 23,907 test symbols where path rules alone caught 18,532
(ripwire <ruff> --ignore-tests, 2026-08-14; the per-language fixtures are pinned bytest/testscopecheck.sh).
The table above, read two other ways. Every figure in both is one of its measured numbers; only the
manners and the cynicism are editorial.
A Survey of the Neighbourhood's Eligible Instruments — being an account of five gentlemen of
retrieval, and one lady of no pretension whatsoever.
It is a truth universally acknowledged, that an engineer in possession of a large repository must be
in want of a map.
Mrs. Codebase-Memory must be named first, for she has risen a great deal in the estimation of the
neighbourhood — two-fifths of her answers entirely correct, which is more than any other caller can
say, and she is ready in a second and a quarter. It must nevertheless be recorded that her card
announces accomplishments in the semantic line; that upon enquiry the semantic line is not at home;
and that the household denies all knowledge of it. One is left with the impression of a capable woman
ill-served by whoever prints her cards.
Mr. Repowise is by common consent the most substantial of the party, and no one who has waited
upon him would dispute it. He is possessed of a handsome index and a manner of great thoroughness;
but he must be seen to. One does not simply address Mr. Repowise. One sends word, and dresses, and
waits — three-and-thirty seconds on an ordinary morning, and upon one memorable occasion in the
country, seven minutes and four seconds — during which interval a less consequential neighbour has
answered the question, taken her leave, and thought no more about it. He answers creditably when at
last he arrives, one time in three; whether that is worth the toilette, each family must determine
for itself.
Mr. Graphify enjoys a great many admirers. He does not rank his acquaintances; he calls upon them
in whatever order his walk happens to take him, and reports the order of the walk as though it were
an opinion. He has been known to arrive carrying a hundred and thirty megabytes of correspondence.
Pressed once for any answer at all, he replied that no matching nodes were found, and considered the
matter closed.
Mr. Aider is the most gentlemanly of the company and by far the most difficult to consult. He
cannot be asked a question — the thing is simply not done. One may mention names in his hearing and
hope he takes the hint; he does take it, and is fully ten points the better for it, which says more
about the hint than about Mr. Aider. But he forms his view of the neighbourhood before you speak and
retains it after, and one cannot escape the feeling that the conversation was never truly with you.
Mr. Codeseek is a young gentleman of quick habits who suffers from an affliction of address.
Speak to him plainly, in the language of ordinary complaint, and he will regard you with perfect
composure and say nothing whatever — nothing, upon sixty occasions out of sixty. Name a person
precisely as that person is named, and he grows animated directly. It is not stupidity; it is a want
of imagination in the matter of introductions.
And there is ripwire, of whom nothing is said in the drawing rooms, because she has already gone
home. She was asked; she answered, in thirteen hundredths of a second; every gold file within the
first ten, in eight-and-fifty cases of the hundred. She keeps no establishment, corresponds with no
distant authority, and has never once been indexed at a party. Mr. Repowise finds her abrupt.
She is.
Every figure above is a measured number from the round-4 table on this page: the index medians
(1.24 s, 34.0 s, 3.37 s) and repowise's 352 s worst case, the 40.0% and 33.3% strict file@10, the
0-results-on-60/60 fallback arm, the absent semantic_query tool, graphify's 129 MB
largest graph and its 1-of-60 empty ranking, aider's +10 pp personalization delta, and ripwire's
0.108 s / 58.3%. Provenance in bench/headtohead/r4-2026-08-06/
and docs/EVALS.md; only the manners are editorial. These are other
people's real work, and the joke is aimed at the trade-offs, never at the authors.
The Long Index — in which a man asks six informants one simple question, and only one of them has
the decency to answer it.
It was a million lines of somebody else's mistakes, and I needed one file out of it before the coffee
went cold. So I did what you do. I went and talked to the people who say they know the neighborhood.
Codebase-Memory had the best record in the room and she knew it — two answers right out of every
five, handed over in a second and a quarter, which in this business is practically a kindness.
Trouble was the card. Right under her name it said semantic query, real classy, real
expensive-looking. I asked to see it. She said it wasn't in. I asked the house. The house had never
heard of it. I've known a lot of good people ruined by whoever printed their cards.
Repowise was the heavyweight — everybody told me so before I got through the door. Big index,
good tailoring, thorough as a tax man. Only you don't just ask Repowise a question. You send word.
You wait. Thirty-three seconds on a good day, and one bad morning out in the country, seven minutes
and four seconds — long enough to get the same answer somewhere else, drive home, and forget his
name. He came through one time in three. For some outfits that's worth the wait. I've got a
metabolism.
Graphify never met a fact he wouldn't hand you. Ask him one thing and he turns up with a hundred
and twenty-nine megabytes of everything, unsorted, in whatever order he tripped over it — and he'll
report that order like it's a considered opinion. It isn't. Leaned on him once for anything at all;
he looked me dead in the eye, said no matching nodes, and figured we were square.
Aider was a gentleman, which is another way of saying you couldn't file a straight question into
him in triplicate. Wouldn't be asked. You mention things, loud, and hope — and sure enough, drop the
right names and he's ten points sharper, which tells you everything about the names and nothing about
Aider. He'd made up his mind about the place before I opened mine, and kept it after. You never did
feel the conversation was with you.
Codeseek was young and had a condition. Talk to him like a human being — plain, tired, the way a
man actually asks for help — and he'll look clean through you and say nothing. Sixty times out of
sixty, nothing. But name the thing exactly, badge number and all, and the kid lights right up. It
isn't that he's slow. He just never learned how people knock on a door.
And ripwire. Nobody at the table brought her up, on account of she'd already left. Took the
question, answered it in thirteen hundredths of a second — every file I needed inside the first ten,
fifty-eight times out of a hundred — keeps no office, wires no head branch, never once got herself
indexed at a party. Repowise says she's abrupt.
She is. That's why I hired her.
Every figure above is a measured number from the round-4 table on this page: the index medians
(1.24 s, 3.37 s, 34.0 s), repowise's 352 s / six-minute worst case, the 40.0% and 33.3% strict
file@10, codeseek's 0-of-60 plain-language arm, codebase-memory's advertised-but-absent semantic
tool, graphify's 129 MB largest graph and its 1-in-60 empty return, aider's +10 pp name-drop delta,
and ripwire's 0.108 s / 58.3%. Provenance in
bench/headtohead/r4-2026-08-06/ and
docs/EVALS.md; only the cynicism is editorial. These are other people's
real work, and the joke is aimed at the trade-offs, never the authors.
Name a symbol and it is the first hit — and it is never a mystery which ranker answered. Every--for query is served by one of three lanes; a confidence-gated router picks by reading the
query's shape, discloses its choice on the output (route=), and --no-route overrides it.
Routing lifts recall@1 on name-shaped queries 61.1% → 91.3% in src/, 59.2% → 85.5% at the
repository root — and the gate is load-bearing in both directions: route everything to the name
lane and prose queries collapse from 0.967 MRR to 0.016. Both numbers ship together. Reproduce
with ripwire <dir> --eval-retrieval, which grades EVERY doc-commented symbol in the corpus and
prints its own population=/scored=/rule=; the full per-ranker tables are inbench/ANSWERQUALITY.md.
| Lane | Built for | Why it wins there | Where it loses |
|---|---|---|---|
| name-exact | identifier-shaped queries (chooseForRanker, pack task) |
whole-name match ignores body noise: 91.3% recall@1, 0.960 MRR in src/ |
scores zero on any word that is not literally a name — forced onto prose it dies (0.016 MRR) |
| subtoken+body | prose and task queries ("where is the content hash computed") | the only lane that matches vocabulary living in doc comments and bodies | exact names drown in shared subtokens (61.1% recall@1 on name queries) |
| mention anchor | a pasted path, Type.method, or issue URL |
a literal mention is lifted above any score — paste the ticket, don't paraphrase it | adds nothing when the query names no artifact |
How the conceptual lane finds what you didn't name. The subtoken+body lane is why a query with
no symbol name in it still lands:
- Both sides are split into subtokens.
SplitChunksPluginbecomessplit+chunks+plugin, and
so does your query — so words match pieces of names you never typed. - Three evidence fields, not one. A symbol is scored on its name subtokens, its doc comment, and
its body — vocabulary that only exists in a comment or an implementation still finds its symbol. - BM25 with per-query IDF. Rare, discriminating words dominate the score; words the whole corpus
shares contribute almost nothing. Type the three words only the right function uses and they carry
the query. - Lookalikes are down-weighted, not hidden. Fixture, test-data, and generated paths score at a
fraction, so a test vocabulary-twin cannot outrank the real source (adversarial-class pollution@5:
28% → 0%,docs/EVALS.md§4) — but they stay in the index and are still found when asked for. - The list ends at a cliff, not a quota. The cut is adaptive: output stops where the scores drop
off, so a sharp answer is a short list and a diffuse one is disclosed as such, instead of a fixed
top-k padding both.
How the router picks. The gate is built on cheap, corpus-derived evidence, and its bias reflects
an asymmetry the table above makes plain: a missed name-route costs a few ranks; a false one is
catastrophic (0.016 MRR).
- Identifier shape is trusted outright. A camelCase/snake token — or a short query carrying
one — routes name-exact. Someone who typeschooseForRankeris naming, not describing. - The all-words test. If every content word equals some symbol's whole name (
pack task
where bothpackandtaskare real symbols), that is strong evidence of a name query. - The plausibility test. Present is not enough — each matched name must be specific: few
definitions, and not a subtoken carried by half the corpus's symbol names (thresholds derived
from the index itself, not a hardcoded stdlib list). This is what catchessplit chunks:
every word names a symbol, butsplitnames a String method defined everywhere — so the route
is declined and the conceptual lane runs, which findsSplitChunksPlugineasily. - Every decision is disclosed.
route=states the lane that ran; a decline names the anchor
that failed and why.--no-routeforces the conceptual lane when you disagree.
The proof the gate earns its keep: the routed lane matches the best single lane on both query
modes simultaneously — 0.960 MRR on names (equal to forced name-exact) and 0.967 on prose (within
noise of pure subtoken+body, src/). No single lane does that.
The honest boundary: the router classifies the query's shape — it cannot rescue vocabulary that is
not in the index. A prose query whose concept lives only in a compound class name
(SplitChunksPlugin contains no splits subtoken) is correctly sent to the conceptual lane, which
then has little to grab; that gap is measured and recorded in
docs/EVALS.md §7, not hidden. Numbers re-derived 2026-08-08 on this tree;
per-lane table and history in docs/EVALS.md §4.
Better Code: It automates the review judgments nobody has time to make — every lens from published research
--quality-panel runs the calls a good reviewer makes by hand — is this function too tangled, is it
named badly, does it hide control flow inside an idiom, does its history say it keeps breaking, must
you read five other files to follow it, does it mutate state three hops away — as six independent
evidence families, and ranks by how many of them agree, never as one blended score. Each family
implements published work — McCabe on shape, Butler on naming, Gopstein's atoms of confusion on
idiom, Nagappan & Ball on churn, Beck & Diehl on colocation, Henry & Kafura on state — with the
lesson taken from each paper, and the rules measured and withdrawn, indocs/LINEAGE.md. Pooled over five corpora (n = 27,889) the largest correlation
between any two families is +0.168: they really are measuring different things, so two families
firing on the same function is corroboration rather than one metric counted twice.
That matters most for code an agent wrote. Empty-catch error masking is +47% more common in
AI-authored commits, a function rewritten again inside two weeks +15% more likely, and reuse is
declining as AI's share of commits grows (GitClear, AI Copilot Code Quality, 2026). Each of--quality-delta's 10 kinds targets one measured mode like those, and it reports only what your
change made worse — then --exemplar shows the pattern in your own repo to copy, and --test-gate
names the tests that must run before "done."
Tree-local numbers above are reproducible with the commands shown; the rest are dated, sourced
measurements in docs/EVALS.md — each with its instrument, its corpus, and its
counterexamples, because the losses ship beside the wins. Zero runtime dependencies, C++23, builds
with the network off.
Built for Codex, Claude Code, Cursor, Windsurf, Gemini, opencode, aider, and any agent that can
call a CLI.
<ctx task="incremental cache invalidation" route="routed: subtoken+body BM25 (--for's default) — no strong
name hit, multi-word conceptual query" confidence="high" margin_pct="20"
bundle="compact" bodies="0" reason="compact-route" est_tokens="3995">
<sigs shown="23" total="40" capped="1">
<d l="106" n="kCacheMagic" p="src/ingest_cache.h" cx="0" ccx="0" in="0" churn="11" amp="71" pure="1" r="1"
next="--expand=src/ingest_cache.h:kCacheMagic"><doc>incremental cache (--cache): per-file content hash + raw facts so a re-run re-parses ONLY c…</doc>constexpr std::uint32_t kCacheMagic = 0x4b505443</d>
<d l="1307" n="spanTierMemoPath" id="src/ingest_astquery.h::rw::spanTierMemoPath" p="src/ingest_astquery.h" cx="1" ccx="0" in="2" churn="5" amp="44" r="2"><doc>Composed exactly the way every OTHER blob family is (quality.h): one fixed-width identity hex pe…</doc>inline std::string spanTierMemoPath( const std::string& diskPath )</d>
<d l="247" n="ingestCommitTree" id="src/dmm.h::rw::dmm::ingestCommitTree" p="src/dmm.h" cx="6" ccx="5" in="1" churn="6" amp="27" r="3"><doc>Ingest the tree at `sha`, materialized out of `root`'s object store. …</doc>inline bool ingestCommitTree( const std::string& root, const std::string& sha, … )</d>
<d l="841" n="mcpRefreshedThisRequest" id="src/mcpindex.h::rw::mcpRefreshedThisRequest" p="src/mcpindex.h" cx="1" ccx="0" in="2" churn="20" amp="43" r="4"><doc>P1-15 — the `_reingest` envelope field for a response whose handling ran an INCREMENTAL pass, …</doc>inline bool mcpRefreshedThisRequest( std::uint64_t passesAtEntry )</d>
…
</sigs>
<hops shown="2" total="6" capped="1" noedge="2">
<h l="1307" p="src/ingest_astquery.h" n="spanTierMemoPath">
<calls total="3"><c n="shaKeyedCachePath" l="1621"/><c n="headSnapRepoHex" l="1359"/><c n="exclConfigHex" l="1554"/></calls>
</h>
<h l="247" p="src/dmm.h" n="ingestCommitTree">
<calls total="10" shown="7" capped="1">…</calls>
</h>
</hops>
</ctx>
The cache cluster, ranked and annotated in place: cx/ccx complexity, in reuse count, churn
recent commits, amp change amplification, tested coverage — the fragile spots are visible
before the agent touches them, in a few thousand tokens (est_tokens="3995", self-reported in the
header) instead of five whole files. This is a conceptual query, so the bundle is the compact
shape: the ranked map plus one-hop callee edges, no inline bodies, and the root says so rather than
leaving you to notice. Read the map, then --expand=SYM the one you want — or pass --auto-bodies
to get bodies inline as before.
$ ripwire . --quality-panel --limit=1
<quality_panel preset="default" families="6" enabled_n="6" cut="2" eligible="6497" ranked="524" …>
<s p="src/graph.h:723" n="buildGraph" fam="4" of="6" fired="structural,confusion,historical,colocation">
<e f="structural" counted="1" why="ccx=764 loc=1368 nest=8 humps=34 deep=315 ev=98 rrank=1"/>
<e f="confusion" counted="1" why="atom-embedded-crement*4"/>
<e f="historical" counted="1" why="hrank=12 churn=36"/>
<e f="colocation" counted="1" why="crank=32"/>
</s>
…
</quality_panel>
Four of six independent evidence families corroborate on buildGraph, each with its own reason
shown inline — never a single blended score. eligible="6497" narrows to ranked="524" (2-of-6
agreement): an 8.1% shortlist of this repository's own functions, not a guess (re-derived
2026-08-23 — the corpus grew, the shortlist share did not move). Full six-family breakdown, real
numbers per family → The quality panel below.
Full retrieval tables — including the MRR figures behind the router numbers above — inbench/ANSWERQUALITY.md and Measured.
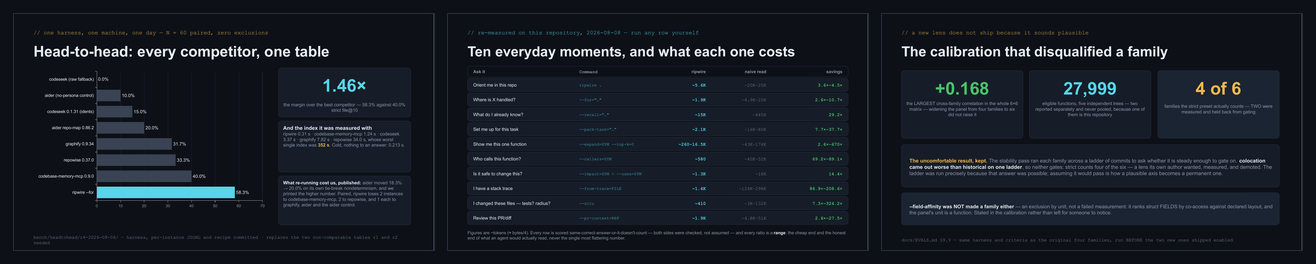
▶ The whole tool in 27 slides — every figure names the instrument that pins it
renders in your browser · pptx beside it · the numbers behind it
What it answers · Quickstart ·
The quality panel · Benchmarks ·
Honesty contract ·
Agent setup · Docs
What it answers
Around the core sit 179 long flags advertised in --help, across seven families — plus an MCP
server, so a coding agent can call any of them mid-task instead of grepping and reading whole files.
Not sure which of them fits the task in front of you? ripwire . --help-task="<task in words>"
recommends ONE executable command with the evidence behind the pick — advice only, it never runs
the recommendation — and abstains honestly when the evidence is too thin to name a winner.
--help vs docs/COMMANDS.md — and the four reflex verbs worth memorising
./build/ripwire --help is generated from the binary's own flag table and is always the authority;docs/COMMANDS.md documents every one of the 145 documented flags — 94 of them
with a real invocation and its recorded output (counts re-derived 2026-08-23; test/docscommandscheck.sh
fails if that documented set and the binary's own flag table ever disagree). Each family below links there.
Four reflexes worth wiring into muscle memory: --from-trace=FILE for an error you have in hand,--edit-check=SYM right after an edit (did the contract change, and which callers are now provably
incompatible), --merge-scout=REF1,REF2 before landing parallel branches, and --pack-task="…" for
ranking, bodies, callers and tests in one budgeted bundle.
| Family | The question | Representative flags |
|---|---|---|
| understand a codebase cold | "What is this repo, and what matters in it?" | --for · --help-task · --tree · --lego · --exemplar · --recall · --top-k · --token-budget · --max-tokens |
| navigate / answer a question | "Who calls this? Is it safe to change? Which tests?" | --callers · --callees · --uses · --impact · --path · --connect · --affected · --situ · --test-gate · --grep |
| zoom the detail ladder | "Show me more — but only where it pays." | --detail · --pack-signatures · --outline · --expand · --compress |
| assess quality / structure | "Where is the risk, and did I just add some?" | --quality-panel · --hotspots · --clones · --metrics · --deps · --lint · --quality-delta · --dmm · --edit-check · --pr-context · --merge-scout |
| self-diagnosis | "Is my setup actually working?" | --doctor |
| security | "Is this agent skill file safe to install?" | --scan-skill · --scan-skills |
| knobs / modes | shape, format, cache, budget | --json · --format · --mcp |
Quickstart
Prebuilt binary — macOS (arm64 / x86-64) and Linux (arm64 / x86-64, built for RHEL 8+;
every release is smoke-tested on a RHEL 9 userland before it publishes). Downloads the latest
GitHub Release, verifies its SHA-256, and installs
to ~/.local/bin. From v0.2.2 the release tarball also ships the seventeen agent skills, and the
installer stages them under ~/.local/share/ripwire/skills and activates them for every agent it
detects (Claude Code, Codex), printing one line per agent saying what it did. An agent that is not
installed is never given a skills directory, hooks are never registered without an explicit --hook,
and RIPWIRE_NO_ACTIVATE=1 stages without activating for image builds. When no agent is detected the
activation one-liner is printed instead:
RIPWIRE_REPO=redhat-et/ripwire bash -c "$(curl -fsSL https://raw.githubusercontent.com/redhat-et/ripwire/main/scripts/install.sh)"
Building it yourself needs CMake 3.24+ and a C++23 compiler, and nothing else installed first —
every dependency is vendored in-tree, so the build completes with the network off.
git clone https://github.com/redhat-et/ripwire.git
cd ripwire
cmake -S . -B build && cmake --build build -j
./build/ripwire .          # the ranked map — start here on an unfamiliar repo
PATH
Or build from source. Requirements: CMake 3.24+ and a C++23 compiler — that means clang 16+ /
AppleClang 15+ (Xcode 15) / gcc 13+ / MSVC 19.36+, and if your distro's CMake is older than 3.24,pip install cmake or brew install cmake gets a current one everywhere. Nothing else —
tree-sitter's core, all 21 grammars and the test framework are vendored under third_party/deps,
so there is no download step and no package manager to satisfy. Prove that with the network off:
add -DFETCHCONTENT_FULLY_DISCONNECTED=ON and the build still completes.
Two builds, two jobs — pick by what you are doing:
# building to USE it — the fast binary (Release implies LTO; scripts/pgobuild.sh adds PGO, what CI ships)
cmake -S . -B build-release -DCMAKE_BUILD_TYPE=Release && cmake --build build-release -j

# building to WORK ON it — plain configure, no build type (why that matters: the trap, under the fold below)
cmake -S . -B build && cmake --build build -j
Parses C/C++, Objective-C/C++, Python, TypeScript, JavaScript, Java, Ruby, PHP, Lua, Bash, Go,
Rust, Swift, C# — plus JSON/TOML/YAML config keys, markdown sections, Metal, and CUDA (<<<>>>
launches are call edges).
To put it on PATH, ./install.sh builds and atomically installs the binary plus the matchingskills/ and hooks/ assets into a detected prefix (Homebrew's if present, ~/.local otherwise;
override with RIPWIRE_INSTALL_PREFIX). Set RIPWIRE_ACTIVATE_CODEX=1 to also refresh Codex's skill
links and advisory hooks from that same staged version; activation is otherwise explicit.
Wiring it into your agent takes one more minute — wrap prints the recipe for your client, it
never edits your config:
ripwire wrap claude             # prints: claude mcp add ripwire -- ripwire --mcp
ripwire wrap --all              # detect every installed agent, print each one's recipe
skills/install.sh --codex       # Codex CLI: the task-shaped skills that say when to query — and when to stop
Four commands worth learning first:
ripwire .                                          # the ranked map — start here
ripwire . --for="incremental cache invalidation"   # the task lens: what to touch, ranked
ripwire . --callers=someFunction                   # who calls it
ripwire . --test-gate                              # before you commit: which tests must run
-DCMAKE_BUILD_TYPE=Release trap, and the honesty contract in one line
The CLI is the recommended baseline because it works in every shell-capable agent; the MCP server is
optional, for agents whose workflow benefits from persistent tool registration. Full walkthrough,
all six clients: Agent setup.
The trap, spelled out: never configure the dev tree (
build/) with-DCMAKE_BUILD_TYPE=Release. Release definesNDEBUG, which compiles the degrade-path alerts out
and blinds the gates that assert them — and every gate and bench number is measured againstbuild/, so changing that tree's flavour silently moves all of them at once. Release belongs in
its own tree (build-release/above;./install.shbuilds its ownbuild-install/the same way).
CI builds both flavours on purpose — seeCONTRIBUTING.md.
The honesty contract, in one line: every count ripwire cannot prove is a total ships labelled a
floor, every truncation is disclosed where it happens, and a zero means none found — never none
exists. Two runs over the same tree are byte-identical, and a warm run equals a cold one. That is a
contract, gated on every pull request and every push to main, not a tendency.
The full discipline — and the losses published next to the wins →
The quality panel
Six independent evidence families, ranked by how many of them agree — never one blended score.
Pointed at this repository's 4,956 eligible functions, 2-of-6 agreement leaves 401 worth a
second look: an 8.1% shortlist. Pooled over five corpora (n = 27,889) no two families correlate
above +0.168, which is what makes agreement corroboration rather than one metric counted twice.
What each family actually looks at — on this repository's own source, not a synthetic example:
| Family | Question | Backing verb | On this repo |
|---|---|---|---|
| structural | shape: complexity, size, nesting and how much of the body is deep, params, local-variable count — absolute bars, not a ranking | --metrics |
buildGraph (src/graph.h:462): ccx=698 loc=1244 nest=8 humps=30 deep=283 locals=114 — 114 local variables invisible to every quality lens until this session, because naming/size analysis has always stopped at a function's signature; locals= is a disclosed floor (locals_floor="1"), threaded through the same walk that already computes ccx/nest, at zero extra parsing cost |
| lexical | identifier text: the 10 naming-* lint rules (short, wordy, case-mixed, uninformative, …) |
--lint, --naming-consistency, --lint --naming-locals |
see below — the one family with a fix, not just evidence |
| confusion | syntactic idiom: the 7 atom-* rules (implicit predicates, nested ternaries, embedded ++/--, …) |
--lint |
corpus-wide finding counts, not a per-function claim to spotlight here |
| historical | git change frequency — score = churn × cognitive complexity |
--hotspots |
src/main.cpp: churn=42 ccx=3387 score=142254 — top of --hotspots' ranking, and its own worst function (main, ccx=387) is where developers keep working and the code is hardest. One caveat the panel's own legend states and this table must too: churn is measured per file, so every symbol in a file carries that file's churn=/hrank= verbatim — this family is file evidence inherited by the row, never the row's own history |
| colocation (local reasoning) | how much you must read that isn't in front of you | --context-ratio |
computeQualityDelta (src/mcpverbs.h:2031), ~50 lines, 87.0% of its distinct references resolve outside its own file — by the tokens a reader must actually read, 99.6%. A refinement of Beck & Diehl's per-class congruence (FSE 2011); Martin's instability I = Ce/(Ca+Ce) is its cruder ancestor |
| state (unintended side effects) | mutable state a change here can perturb, that --impact (who calls you) never asks about |
--nonlocal-state |
ensure_global_init (src/infra/profilePmc.h:288) reaches 3 distinct global/static cells through its own body and callees — a tiny, innocent-looking call site can still break state three hops away. Unsound by construction (no pointer aliasing, no indirect calls), so every count is a floor |
nest= profile deep-dive
--quality-panel joins six independent evidence families (structural shape, lexical naming,
syntactic-confusion idioms, git churn history, cross-file colocation, and non-local mutable state)
and ranks by the count of families agreeing, never a weighted composite — averaging correlated
metrics and calling it several is the Maintainability Index's well-known failure mode. On this
repository the panel measures 4,956 eligible functions and narrows them to 401 worth a
second look at 2-of-6 agreement — an 8.1% shortlist, not a guess — and the largest correlation
between any two families, pooled across five independent corpora (n = 27,889), is +0.168: the
families really are measuring different things. The six-family table above shows what each finds on
this repository's own source; the sections below are the parts that need more than a row.
nest= is a max, so it cannot tell a long function from a tangled one
The structural family's nest= reports the single deepest line in a function. One line at depth 9 and
a thousand lines at depth 9 produce the same number — which means a long blocked-sequential body (a
run of shallow scoped steps, its max set by one inner loop nobody has to hold in their head) is
indistinguishable from a tangled one that sustains depth for hundreds of lines. Every consumer ofnest= inherited that blindness: the panel's structural family, --readability's rank, the ensemble join.
--metrics now emits the profile beside the max — humps= (how many maximal regions reach the
nesting bar, CodeScene's "bumpy road": a rise above the threshold then a fall, so repeated missing
abstractions read differently from one deep tangle) and deep= (how many lines lie inside them, against
the loc= already on the row). Both come from the same fused walk that already computes ccx/nest, at
zero extra parsing cost; deep= is a disclosed floor (deep_floor="1"). Both are absent exactly whennest < the bar — not-deep, never a hidden 0. deep counts lines and humps counts regions,
and two regions can share a line — a one-line if(c){x;}else{y;} at the bar is two regions on one line —
so deep below humps is legal output rather than a defect. On this repository's own source:
| function | loc |
nest |
humps |
deep |
deep/loc | reading |
|---|---|---|---|---|---|---|
ingest (src/ingest.cpp) |
1632 | 8 | 25 | 467 | 29% | genuinely tangled |
buildGraph (src/graph.h) |
1244 | 9 | 30 | 308 | 25% | genuinely tangled |
main (src/main.cpp) |
1061 | 6 | 29 | 111 | 10% | long, mostly shallow steps |
dispatchMcpLine (src/mcp.h) |
1099 | 7 | 22 | 102 | 9% | a dispatch table, not a tangle |
runDefaultMap (src/main.cpp) |
650 | 4 | 7 | 15 | 2% | blocked-sequential |
ur_walkTree (src/ingest.cpp) |
87 | 7 | 1 | 43 | 49% | small and tangled |
loc and nest alone rank main and dispatchMcpLine beside ingest and buildGraph; the profile
separates them, and it promotes ur_walkTree — 87 lines, so no size bar fires, yet proportionally the
densest thing in the table. This changes no ranking: humps > 0 is exactly nest >= bar, which is
precisely when the nest bar already fired, so the family count and the panel's shortlist are untouched.
It is strictly more evidence on rows that already appear — a reader can tell the two shapes apart without
opening the file.
The panel also carries one join, and it is deliberately not a seventh family: a row whose structural
evidence includes deep= (a body that sustains depth at the nesting bar) and that no indexed test
reaches is annotated join="deep+untested" — the pair where a refactor is most wanted and least safe,
put side by side because both facts are already on the row. It changes nothing: not fam=, not of=,
not the order, not which rows appear (counting it would be the structural family wearing a second hat).
The root reports tested_scope= (symbols any indexed test reaches — the join's honest denominator) anddeep_untested= (rows carrying the annotation across the whole row set); at tested_scope="0" no
indexed test reaches anything here, so "untested" would be a fact about what was crawled rather than
about the code, and the annotation is emitted on no row.
Five lenses sit beside the six-family join — deliberately outside its vote. Each is out for a
stated reason, not an oversight:
| Lens | Asks | Why beside the join | On this repo |
|---|---|---|---|
--field-affinity |
which struct fields are read together but declared far apart; each loop's access shape (index vs pointer-chase) | its subject is a type, not a function — attributing a struct's finding to the functions touching it is a claim the lens never makes | MainDispatch: 12 findings at separation cost 92.88; 1,374 loops classified, 5 genuine pointer-chases |
cache-* lint rules + --with-profile |
cache-hostile access shapes (alloc-in-loop, p=p->next, a[b[i]], node containers, …), then which are measured hot |
rows are facts about sites, joined to per-scope hardware counters — not per-function evidence a family vote could count | aggressive rules: 0 hits in shipping src/; 327 findings adversarially triaged → 0 fix-worthy; the one open refactor settled by measurement (5.2 ms) |
--readability |
least-readable-first ordering (Halstead volume, Posnett sigmoid) | the fitted score saturates past 20 lines — only the ordering is meaningful, and an ordering cannot vote in a count | ordering only, never a grade |
--naming-consistency |
off-convention names, each with a computed propose= |
the one lens that emits advice — a fix is not evidence, so it does not vote | camelCase dominant at 93.0%; 136 names flagged with proposals |
--lint --naming-locals |
the naming rules pointed at local variables inside already-flagged functions | opt-in and unvalidated — stays outside any join until a real-corpus audit clears it (the withdrawn-rule lesson) | +973 findings that were structurally invisible before |
Two verbs sit beside the panel, not inside its six-family join — worth knowing the boundary
rather than blurring it:
--field-affinity(cache-friendly co-access) is explicitly not a panel family, by unit: it
measures which struct fields are read together but declared far apart, and its subject is a type,
not a function — attributing a struct's finding to the functions that touch it would be a claim the
lens itself never makes (docs/EVALS.md§9.9.2).MainDispatch(src/main.cpp:1335, the 144-byte
struct threaded through nearly every verb) still carries 12 real findings against a separation
cost of 92.88 — fields read together in the same call routinely cross cache-line boundaries.
Chilimbi, Davidson & Larus's cache-conscious structure definition (PLDI 1999), validated on real
hardware counters; the advice-not-transform posture (report a split, never auto-reorder a struct)
follows Hundt, Mannarswamy & Chakrabarti (CGO 2006). This is a genuinely rare kind of tool: code
review catches cache-unfriendly patterns constantly, but every adjacent tool that reasons about
memory-access shape (Intel Advisor's pattern classifier, DMon, PerfLint) does it by running the
program first — a two-round adversarial literature and patent search found no shipping tool and no
published work that does this statically, before a line executes (tier: RARE BUT REAL, the full
citation trail and hedged claim wording indocs/LINEAGE.md). The same verb now
also classifies each loop's access shape —index/handle-based (predictable, the hardware
prefetcher can hide the latency) vs. pointer-chase (data-dependent, no struct layout fixes an
unhideable per-hop stall) — and, for genuine chases, checks whether the pointer you dereference to
reach the next node sits next to the payload you're about to read, since that cache-line fetch is
unavoidable and colocating there is a strictly higher-value fix than generic field reordering. On
this repository: 1,374 loops classified, 5 genuine pointer-chases found in a codebase
deliberately built handle-based rather than pointer-linked (guardrail G2) — the lens staying quiet
on code written to avoid the problem is itself a check that it isn't firing at random. Ships
entirely report-only: an A/B benchmark against a real 64 MB shuffled linked list measured a
mostly-null result, so the ranking-affecting half of this feature is a provable no-op until a
blind real-corpus validation session clears it — reported here at the same honesty level as
everything else in this table, not oversold ahead of the evidence.- The
cache-*lint pack +--with-profile(cache-friendly access patterns — the other half
of the locality story, shipped 2026-08-07/08) covers what--field-affinitydeliberately does not:
eight AST shapes practitioners agree hurt — node-based containers,vector<T*>/vector-of-indirect
(the "matrix as vector of vectors"), heap allocation inside loops,p = p->nextchase advances,a[b[i]]gather subscripts, by-valueshared_ptrparameters, and existing manual prefetches
flagged for re-measurement — loop-fenced by span algebra, C-family only, facts never verdicts. The
honesty numbers, both directions: on this repository the aggressive rules fire only in benches
and test fixtures, zero in shippingsrc/(guardrail G2 holding is itself the check the rules
aren't firing at random), and a 13-agent adversarial triage of all 327 findings confirmed zero
as fix-worthy — every plausible refactor died on "win unmeasurable without a profile". That gap is
exactly what--lint --with-profile=FILEcloses: it joins aRIPWIRE_PROFILEbuild's own
per-scope hardware counters (#PROF_TSV) onto findings, so a row carriesheat_total_ms/heat_l1d_mpkifrom a real run — static shape × measured PMU weight, the two halves of SYZYGY's
advice mode (Hundt, CGO 2006) finally in one command. Worked example: the one surviving refactor
candidate (flattening the Louvain adjacency) was settled by its newPROFILE_SCOPEin a single
measured run — 5.2 ms, 5.9% of the verb — a wasted afternoon prevented by a number
(docs/CACHELINT.mdholds the full catalog, the wave-2 specs, and the
compiler-handled myths deliberately not checked). --readabilityis a sibling lens, not a panel family either — the one classic model in the tree
with a published closed form: Halstead volume (Halstead, Elements of Software Science, 1977) and
the Posnett/Hindle/Devanbu sigmoid fit (MSR 2011, doi:10.1145/1985441.1985454),
fitted on snippets of 20 lines or fewer — past that the fitted score saturates and only the
ordering stays meaningful, which is exactly how the verb is used: least-readable-first, never as a
grade. Halstead's volume specifically (not the later, less-trusted difficulty/effort derivatives) is
among the metrics shown to track measured cognitive load directly (Peitek, Apel, Parnin, Brechmann &
Siegmund, ICSE 2021, doi:10.1109/ICSE43902.2021.00056) —--readabilityemits volume and stops there; difficulty and effort are computed nowhere in this
tree.--naming-consistencyis the lexical family's one exception to "evidence, never advice": every
other lens in this panel tells you WHAT is wrong, never a computed fix. Case-style consistency is
the one property with a corpus-derivable answer — on this repository'ssrc/, camelCase is the
dominant convention at 1,677/1,803 (93.0%) agreement, and the verb flags 136 off-convention
names with a mechanically recombinedpropose=value for each (no dictionary, no synonym judgment —
see What it answers).--lint --naming-localspoints those same naming rules at local variable names — the thing a
human reviewer flags immediately in a sprawling function and no static tool measured until this
session. Opt-in, off by default: on this repository, a plain--lintfinds 2,225 findings;
adding--naming-localsfinds 3,198 — 973 findings that were structurally invisible
a moment ago, scoped tightly (only inside functions already flagged large/complex, only locals
nested two blocks deep for the short-name rule) so it doesn't just relabel every loop counter in
the tree. Ships disabled by default on purpose: this repository's own history includes a naming
rule that shipped on plausibility and was later measured to flag its best-named functions — see
the withdrawn-rule note below — so a rule this new stays opt-in until a real-corpus audit clears it.
Full citation table, evidence tiers, and what got measured and withdrawn (a naming rule that
flagged this repository's best-named functions, kept as the standing argument for measuring before
shipping) → docs/LINEAGE.md.
Real runs
Four real invocations against this repository, each printed as the binary actually prints it:--callers (and why its count is a floor), the default ranked map (and what amb= admits),--test-gate (exit 4 while obligations remain), and --from-trace (feed it the error itself, not a
paraphrase of one).
Output is minified — one line, no whitespace between tags — so the excerpts below are wrapped for
reading, and each one's leading legend comment is elided. Nothing else is edited, except that
corpus-size numbers (file/symbol/edge counts, the ranked-map header's token/ambiguity tallies,
PageRank k= values, and the test-gate example'sscript_gates_unmodelled= — a count of the script runners under test/, recursively) drift as this repository
grows: the ranked map elides those specifically, and says so again at the point of use, and the
test gate additionally trims its <u> rows down to 2 of the 25 the real run prints, behind a
trailing ….
--callers — a call graph built on the spot, and why count="6" ships labelled a floor
Ten seconds, no index server, no embeddings, no API key — a parse and a call graph, built on the
spot:
$ ripwire . --callers=rankGraphTeleport
<callers of="rankGraphTeleport" defs="1" count="6" root="." hop_tested="0" hop_untested="6" counts_floor="1">
<s t="fn" n="runEval" p="src/eval.h:169"/>
<s t="fn" n="rankGraph" p="src/graph.h:2542"/>
<s t="fn" n="anchoredLexicalRank" p="src/graph.h:3091"/>
<s t="fn" n="churnRankedGraph" p="src/main.cpp:983"/>
<s t="fn" n="runDefaultMap" p="src/main.cpp:1098"/>
<s t="fn" n="getIndex" p="src/mcpindex.h:1104"/>
</callers>
counts_floor="1" is the point. Call edges are extracted from source text by name, so dynamic
dispatch contributes no edge (a call through a function pointer or callback is an edge only when
ONE function is bound to that variable in scope and the variable never escapes — its address taken
or reference-bound — and a macro-generated call site — taggedrole="macro" — only when its function-like #define is indexed): count="6" is a floor,
and the element says so before you read a single row.
--top-k=3, and what amb="2" admits about a resolver guess
The ranked map — the default run, capped to three symbols so it fits here:
$ ripwire . --top-k=3
<!-- files=… symbols=… edges=… shown=3 est_tokens=… ambiguous=… unresolved=…
     precise=… skipped_oversize=… order=important-first -->
<r est_tokens="435">
<f p="./src/infra/svector.h" layer="infra">
<s t="method" n="size" id="./src/infra/svector.h::svector::size" k="…"></s>
<s t="method" n="push_back" id="./src/infra/svector.h::svector::push_back" amb="2" k="…">
<c n="buf"/><c n="buf"/><c n="grow"/></s>
</f>
<f p="./src/scipoverlay.h">
<s t="method" n="empty" id="./src/scipoverlay.h::ScipOverlay::empty" k="…"></s>
</f>
</r>
files=/symbols=/edges= and the k= rank values are elided: this repository is the corpus here,
so they move every time README.md itself gains or loses a line, which is not what the example
demonstrates. The rest of the header measures the whole corpus, not the excerpt — the ambiguous= tally is
the call-graph completeness gauge, and amb="2" on a row says two of that symbol's calls hit a name
with several definitions and the resolver guessed. Read the source when which-target matters.
--test-gate — exit 4 while obligations remain, and why script_gates_unmodelled="332" stays nonzero on a clean clone
The test gate — --test-gate names the obligations and exits 4 while any remain. Captured with an
uncommitted change in the tree: changed="1" and the rows below appear only because something was
actually pending. A clean clone exits 0 with every changed/impacted/test count at zero — exceptscript_gates_unmodelled=, which is structural (it counts script-to-binary test runners the call
graph cannot see, not git status) and stays nonzero even then:
$ ripwire . --test-gate          # exit code: 4
<test-gate changed="1" impacted="80" tests="2" untested="76" shown_tests="2" tests_capped="0"
           shown_untested="25" untested_capped="1" script_gates_unmodelled="332" at="9cf0b16f3+dirty">
<t p="./test/adaptivecutshapefix/adaptive_cut_shape_test.cpp" run="bash test/adaptivecutshapecheck.sh"/>
<t p="./test/verify_radix.cpp"/>
<u sym="buildGraph" p="./src/graph.h" ccx="712"/>
<u sym="dispatchMcpLine" p="./src/mcp.h" ccx="428"/>
…
</test-gate>
A run= attribute appears only when a runner is derivable from real evidence — a test-dir script
whose stem matches the harness, or whose text names it. No run= means not derivable, never a
guessed suite command. script_gates_unmodelled="332" is the same discipline: script-to-binary is not
a call edge, so those gates are invisible to this walk, and the number says so rather than lettingtests="2" read as complete. The <u> rows are the untested blast radius: impacted symbols that no
test in the corpus reaches.
--from-trace — hand it the stack trace, sanitizer report or compiler error itself, not a paraphrase
From an error, not a paraphrase of one — --from-trace takes a stack trace, sanitizer report or
compiler error on stdin or from a file, maps its frames onto indexed symbols innermost-first, and
returns the innermost in-corpus body with them:
./build/ripwire . --from-trace=asan_report.txt
cmake --build build 2>&1 | ./build/ripwire . --from-trace=-
What's new
New (2026-08-30) — each measured, dated, and re-derivable; the losses and caveats stated in place--slice-flow=back|fwd|both— cross-statement data-flow slicing (ARISE rung 2, arXiv:2605.03117).
A bounded BFS from one variable over line-granular reaching-definition edges — backward to the
statements whose values feed it, forward to the statements its value reaches — that stops at
function boundaries, exactly as the paper's own slicer does.--slice-depth=1..32bounds it
(default 8, always disclosed asdepth=); a bound that cuts a row saysflow_truncated="1";
without the new flags the v1 output is byte-identical. Measured on the registered fix-commit
protocol over this repository's own history (7 commits / 38 instances, cpp only — a thin corpus,
reported as thin): flow rows lift function-level added-line recall 0.163 → 0.198, at a mean
4,993 output bytes — 25% of the 20,034-byte--expandwhole-body baseline whose recall is 1.0
by construction. (bench/slice/run_slicerecall.py; protocol, per-instance ledger and caveats indocs/EVALS.md.)- The
--slicev1 contract got its first measured numbers (registered 2026-08-28, no numbers
until now): per-variable line-recall 0.726, hit-all rate 0.632, over-inclusion 3.77×. The
misses were inspected one by one and are dominated by the measurement's own relevance oracle — a
word-regex that matches short identifiers inside comments and string literals, occurrences the
slicer correctly refuses to call variable uses — so 0.726 is a floor under a noisy oracle; no
inspected instance showed a real occurrence the slice dropped. --expandno longer hangs on minified bundles: the secret-redaction sweep was quadratic in LINE
length. Invisible on ~100-byte source lines, fatal on a 2.9 KB-average-line minified bundle: one
selector in babel's 2.1 MB / 768-line yarn bundle never completed (killed at 1,343.9 s of user
CPU with an empty output file; 196.7 s is the only clean lower bound) and now answers in 0.46 s
warm; the self-contained 20 KB single-line fixture went 23.02 s → 0.017 s (~1350×). A pure
memoization, so an output no-op — 120/120 invocations byte-identical across 24 corpora × 5 verb
shapes — gated on behaviour only (test/redactfixcheck.sh), with the timings a ledger row inbench/PROFILE.md, never a red-CI threshold.
--pattern— structural search written in CODE, not in node kinds.--pattern='foo($X, ...)'
where$NAMEbinds one node,$_binds nothing and...is an ellipsis over siblings; comments
are transparent, everything else is kind- and text-exact. Served across 13 grammar objects (11
languages), and it refuses rather than lying: a pattern no served grammar resolves, or that
collapses to a bare token, exits 1 naming the served and unserved families — neverhits=0.
(./build/ripwire . --pattern='VERIFY($X)'on this repo: 101 hits over 625 eligible files,
each row carrying its enclosing symbol;--pattern='$X'exits 1 with the refusal text.)--safe-delete=SYM— "can I delete this?" in ONE call. Composes the signals the tool already
computes for a resolved symbol: 1-hop callers, the transitive blast radius, every read/write/
import/call site, how much of that radius any test reaches, and--dead-code's own shape — then
reportsrisk=as a fact, never a go/no-go verdict. (--safe-delete=coversOrEquals:callers="2" impact_reaches="17" uses="2" radius_tested="0" radius_untested="17" dead_code_candidate="0" risk="untested-radius".)--impactgrew a disclosed import tier. A class whose consumers#includeorrequirethe
file that defines it used to look like it had no blast radius at all.importers=is now a second,
weaker reach besidereaches=— with its own cap pair and<f via="import">rows, and never
summed intoreaches=, because files and symbols are different units.
(--impact=IngestResulton this repo:reaches="0" importers="70" shown_importers="40" importers_capped="1"— a symbol that reads as unreachable by calls and is included by 70 files.)- Conceptual
--forqueries serve a compact map instead of inline bodies. Bodies were 52.7% of
every conceptual-query byte — the one class that missed the byte target — so the subtoken+body
route now ships the ranked map plus one-hop<hops>edge context and no body CDATA, disclosed on
the root asbundle="compact" bodies="0" reason="compact-route". Across the frozen 15-query class-B
set that is 184,857 B → 95,256 B, −48.5%, with all 11 judged-decisive markers still present
(better than either pre-existing lever's 10/11).--auto-bodiesis a permanent opt-out, not a
migration aid. (One pair on this repo, re-derived 2026-08-23:--for="incremental cache invalidation"8,487 B compact vs 12,044 B with--auto-bodies,
−29.5%; the 15-query total isdocs/EVALS.md§5.) --pack-taskorders callers by corroboration. A neighbour reached by several of the bundle's
top anchors is more likely to be the thing you must touch than one reached by exactly one, so rows
sort byshared=— the count of top-K anchors that reach them — omitted at 1 because that is what
every 1-hop row satisfies by construction. (--pack-task="emit the minified xml map"putsescapeXmlfirst atshared="4".)--lintrolls up per rule, so a capped view stops hiding whole rules. Every rule gets a<rule name= count= shown_rows= rows_capped=/>row, and a rule whose registered languages match
nothing in the corpus carriesapplicable="0"so its zero reads as structural inertness rather
than a measurement. On this repository the default view shows 692 of 3,332 findings — and 14 of
the 31 rules that fired contribute zero shown rows, 368 findings whose only evidence is theircount=. (./build/ripwire . --lint, counted from the<rule>rows.)- PHP and Lua joined the language line, with their floors stated rather than implied: PHP's
dynamic dispatch ($fn(),call_user_func,__call) names its callee at run time and is a
declared floor; a Lua corpus reports no inheritance edges, because metatable inheritance is a
runtime call with no syntax to read.
--expandanswers "show me this function" in one call, −47.3% tokens — an exact-name ask now
skips the ranked-map preamble by default and the body arrives with its file's sibling symbols and
imports inline (sibs=/inc=), so the follow-up "what else is in this file?" call never happens.
(Re-derived 2026-08-15 fix-expand round:--expand=emitGrepReport— 47,252 B classic 200-row-map
bundle vs 24,911 B today's exact-name default, on this repo; the figure moves as the corpus grows
and is not itself CI-gated, so re-measure before citing it in a future round.)--grepgroups, deduplicates, and speaks boolean — per-file grouping, identical-line collapse
("this exact guard appears at 6 call sites" is the finding), and--and=/--not=/--grep-scope=:
a two-term ask returns the complete answer at −78% of the single-term dump. Default view now
runs at ~clean-grep cost while naming the enclosing symbol for every hit.- C++ maps got materially truer: out-of-line definitions past one qualifier
(Outer::Inner::method(){}— the house style of large C++ codebases) were silently invisible;
on one 6,600-file production tree that was ~15% of qualified definitions. Now indexed at any depth. - Compound
--graph-queryfilters run ~25× faster via predicate pushdown — an exact algebraic
identity, byte-identical output, gate-enforced.
Measured
Every published number lives in docs/EVALS.md with the instrument that produced
it, the corpus it ran on, and the in-tree file that pins it — alongside a counterexample section and a
list of the claims this project deliberately does not publish. Read those first if you are here to
check whether the tool is oversold.
Against other tools
Round 4 (re-run in full 2026-08-08): 58.3% strict file@10 against 40.0% for the best competitor —
a 1.46× margin, at a 0.31 s index. N = 60 paired instances, zero exclusions, one binary (the
profile-guided release build that now ships), one evaluator, all arms re-run on the same day.
Strict file@10 = all gold files inside the top 10.
| Arm | strict file@10 | any@10 | index (median) | query (median) |
|---|---|---|---|---|
ripwire --for |
58.3% | 85.0% | 0.31 s | 0.108 s |
| codebase-memory-mcp 0.9.0 | 40.0% | 63.3% | 1.24 s | 0.075 s |
repowise 0.37.0 (MCP search_codebase, LLM-free wiki) |
33.3% | 53.3% | 34.0 s¹ | 1.159 s¹ |
graphify 0.9.34 (--code-only --no-cluster, keyless) |
31.7% | 46.7% | 7.82 s | 0.614 s |
| Aider repo-map 0.86.2 (ident-personalized) | 20.0% | 35.0% | (inside query) | 2.920 s |
| Aider repo-map 0.86.2 (no-personalization control) | 10.0% | 25.0% | (inside query) | 0.818 s |
| codeseek 0.1.31 (ident-mention convention arm) | 15.0% | 20.0% | 3.37 s | 0.040 s |
| codeseek 0.1.31 (raw issue text, keyless fallback) | 0.0%² | 0.0% | 3.37 s | 0.024 s |
Round 4 (first run 2026-08-06; re-run in full 2026-08-08 on the profile-guided release build) —
N = 60 paired instances, zero exclusions, one binary, one evaluator. Every
competitor was re-run on the same day against the same ripwire binary
and the same evaluator, so the arms are directly comparable to each other. Earlier rounds could not
say that: r1 (2026-07-13/14) and r2 (2026-08-03) each scored a different subset against a different
binary, which is why this page used to print two tables and ask the reader not to compare them.
Strict file@10 = all gold files inside the top 10. Harness, per-instance JSONL, and a
reproduction recipe: bench/headtohead/r4-2026-08-06/.
Paired, ripwire's losses are 2 instances to codebase-memory-mcp, 2 to repowise, 1 each to
graphify and aider; codeseek never beat it. Cold from nothing to an answer — parse, rank, reply,
no cache — ripwire takes 0.213 s, against a ~34 s index-then-query for repowise, whose worst
single index in this run was 352 s. That comparison is only possible because ripwire's own index
was measured this round; r2 recorded competitor index walls and deliberately refused to tabulate
them, since a one-sided cost table is not evidence.
What re-running cost us, stated because it is the reason to re-run at all.
codebase-memory-mcp is the true runner-up at 40.0% — r1 credited it with 26.7%, and scoring it
fairly against today's binary raised it. graphify rose 21.7% → 31.7% and aider 13.3% → 20.0% the same
way. The margin over the best competitor is therefore 1.46×, not the 1.75× that two
separately-dated tables implied; the old framing flattered us by comparing today's ripwire against
year-old competitor runs.
Three limits travel with this table. ¹ repowise's walls include a fresh MCP-server spawn per query;
resident-server usage is faster. ² codeseek's raw row returned 0 results on 60/60 queries — its
keyless fallback matches function names only, so that row measures a query-protocol boundary, not its
embedder-backed shipping mode (unbenchmarked here). And the slice is Python-dominant — 107 of 134
gold files are .py — so this measures Python localization, not all twelve indexed languages.
Vexp and CodeIndexer were excluded, not beaten: their free tiers (node/project/chunk caps) cannot
run a fair 60-instance sweep. An independent adversarial pass attacked the r2 comparison's design, and
its findings and dispositions ship with that report
(VERIFIER.md); r1's and r2's tables remain in their own
directories as the historical record.
Multi-file gold is hard for every arm, including ours, and four attempts have failed to fix it.
ripwire leads the stratum at 21.4% strict — but its own any@10 there is 78.6%: it finds a gold file
and misses the siblings. If each gold file were an independent draw at the single-file rate (90.6%),
multi-file would score 71.2%; it scores 21.4%, so the failures are strongly correlated. The mechanism
is that a sibling is a file which changed because the primary changed — the primary carries the
issue's vocabulary, the siblings carry the consequences. Four pre-registered rounds
(r1_anchorhop, r1cpp_anchorhop, r4_siblift, r5_pooling) have now been rejected at ±0.00pp
against it, each archived with its grid and its verdict underbench/locbench/results/.
Round three (2026-08-03): headroom — the compression-layer competitor. headroom
(headroom-ai==0.33.0, 64k★) compresses context an agent already fetched; it retrieves nothing —
so this round's instrument is tokens-to-correct-answer on 12 pre-registered mid-task questions
(django @ pinned commit, five arms, one tokenizer), not file@k. ripwire won every measure the two
tools share. headroom's default config passed every code chunk through byte-identical — its
own protective guards fired throughout, netting −410 tokens on a 685,682-token workload (its own
limitations page says "Code — Passthrough"; this run confirms it live) — and stacking it on
ripwire's output added exactly 0 tokens of savings: the map is already past the density
compression targets. As measured then, ripwire answered at 7.3% of the naive grep-and-read
baseline's tokens (1.7% on the subset both arms fully answered), warm in ~0.14 s per verb. Those
two figures were re-derived on 2026-08-23 and now read 5.0% and 5.2% — the block below.
The losses in this
round are ripwire's own, and they are published first: under the frozen no-human verb ladders it
strictly satisfied only 5/12 questions vs the naive baseline's 11/12 — four ranking defects,
one missing symbol kind, two harness artifacts, each bucketed with its fix disposition in the
report. What the round does not show: headroom's home turf (JSON/log tool-output compression,
provider-cache economics) was deliberately not measured — ripwire does not compete there.
Provenance: docs/EVALS.md §2, full record + adversarial verification (which
materially corrected the draft's arithmetic in headroom's favor) inbench/headtohead/r3-headroom-2026-08-03/.
The 2026-08-03 round is frozen; this is the same instrument pointed at today's binary. Arms A
(idealized grep-and-read) and C (ripwire's pre-registered verb ladders) were re-run from the
committed harness.py, importing its metric functions unmodified — same questions.json, same
frozen arms_spec.json ladders, same tiktoken cl100k_base counter, same corpus pin
(django/django @ 70f39e46). The headroom arms (B/B′/D) were not re-run; they contribute nothing to
the ripwire-vs-naive ratio, and the round's finding about them is a passthrough result that does not
depend on ripwire's side.
The naive arm reproduced exactly — all 12 questions token-for-token, 685,682 t in total — which
is what makes the comparison a measurement of ripwire's change and not of drift somewhere else.
Satisfaction did not move either: 5/12 for ripwire, 11/12 for naive, and the both-satisfied
set is the identical {q02, q03, q04, q05, q11}.
| 2026-08-03 | 2026-08-23 | ||
|---|---|---|---|
| naive (arm A) total | 685,682 t | 685,682 t | reproduced to the token |
| ripwire (arm C) total | 50,138 t | 33,948 t | −32.3% |
| overall ripwire ÷ naive | 7.3% | 5.0% | better |
| both-satisfied, naive | 219,223 t | 219,223 t | same 5 questions |
| both-satisfied, ripwire | 3,775 t | 11,471 t | +204% |
| both-satisfied ripwire ÷ naive | 1.7% (58×) | 5.2% (19×) | worse |
| ripwire tokens spent on its own misses | 92.5% | 66.2% |
Why they moved apart. The compact conceptual route made the seven questions ripwire misses
dramatically cheaper — q07 13,198 → 4,416 t, q08 11,192 → 2,016 t, q01 11,974 → 3,045 t — which
is what pulls the overall share down. On the five it answers, richer default bundles cost more:q05 522 → 6,736 t and q11 280 → 1,373 t dominate that column. The 58× figure was always the
flattering framing of a 5-of-12 result, and the honest reading of the pair is that ripwire got much
better at being wrong cheaply and somewhat more expensive at being right. Nothing about the four
ranking defects, the missing symbol kind or the two harness artifacts in the original loss buckets
has been re-adjudicated here — the satisfaction column is unchanged, so those losses stand.
LocBench held-out, N = 243 across 78 repositories. Strict file@10 60.9%, against 27.6% for
the pre-routing baseline — a paired +33.33pp with a clustered-bootstrap 95% lower bound of
+25.00pp, bought for +3.4% warm latency and −39.4% on the production token ceiling. More
accurate and cheaper, which is why it shipped.
What it saves you, in tokens
Context is the budget an agent actually spends. Three measurements, each with the instrument that
pins it:
| Where the saving comes from | Measured | Pinned by |
|---|---|---|
--pack-signatures — body-elided declaration skeletons instead of full bodies |
80.2% fewer element bytes at top-50 (84.5% at top-10, 80.6% at top-100) — re-derived 2026-08-30 | test/showcasecapturecheck.sh, re-derived from this repo every run |
| Query-shape routing, on the production token ceiling | −39.4% p50, while strict file@10 rose +33.33pp | bench/locbench/, EVALS §3 |
| A whole-question bundle against a naive agent read | 96.0% fewer tokens (24.9×) — 14,758 against 367,192, tiktoken cl100k_base, six realistic questions |
bench/BENCHMARK.md — historical, private corpus, not reproducible from this tree |
Read the first row's methodology before quoting it: element bytes are counted root-neutralised,
with the corpus-root prefix subtracted from both sides, because the root repeats inside every element,
is charged in both forms, and is not what this verb elides. Quote the top-50 figure — the signature
payload is top-50 whatever --top-k says, and top-10 is a ten-symbol sample that one one-line
accessor can move several points. The gate fails if the documentation drifts more than 1.5 points from
the binary.
And the third row's caveat is not small: it was measured 2026-06-20 on a large private C++ corpus, it
is not publicly reproducible from this tree, and it proves cheaper and faster, not better
outcomes.
The losses ship next to the wins. --grep's 2026-06 anti-headline (+19.7% / −11.2% vs raw grep)
was re-derived 2026-08-15 after the emission overhaul: the un-tiered view — --grep-in=any, which
was the default when this was measured — lands at −1.9% / +4.3%
of a clean grep dump while carrying enclosing symbols and in-band honesty grep cannot give — one term
either side of parity, which is not a headline in either direction — but an uncapped dump of that same
un-tiered view remains token-negative (+150% / +214%), and this project still says so. (Span tiers
landed 2026-08-19 and made the default a filtered view of the same scan; every byte number on this
page is the un-tiered one, deliberately — the instrument may not move under a display change — so none
of them describes today's default. See docs/EVALS.md §grep.) Nor is that the worst
regime: on small-hit uncapped answers the fixed per-answer legend is not amortized over anything, and
a gated set of twelve such queries on this repository runs +65.1% median, larger than plain grep on
12 of 12. When the agent knows a second term, --grep=A --and=B flips hard positive (−77.7%
measured, complete both sides). --pack-signatures inverts on a short symbol: 303 bytes of
signature-plus-doc-comment against a 158-byte body. The headline is a property of large result sets,
and the full counterexample list is part of the contract, not an appendix — the
four-fact grep re-derivation lives in docs/EVALS.md §5.
Where its own cycles go — hardware counters, per scope
Every pipeline phase is bracketed by two hardware-counter reads, and the numbers say what
wall-clock cannot. Parse and query retire 3.2–3.5 instructions per cycle; the graph phases
stream at 32–35 L1D MPKI and still hold IPC above 3.1 (guardrail G2 doing its visible job); and a
warm run replaces the dominant phase's 8.74 B instructions with a 52.3 M-instruction cache load,
≈167× fewer. Two opt-in builds go faster still — PGO by 14–25% cold — with byte-identical
output on every one.
perf_event_open, the per-scope counter table, and the three things it says that wall-clock cannot
The self-profiler (-DRIPWIRE_PROFILE=ON; src/infra/profileScope.h + profilePmc.h) brackets every
pipeline phase with two hardware-counter reads — kperf on Apple Silicon, a pinned perf_event_open
group on Linux. Below: ripwire mapping its own public tree on an Apple M5 Pro, cold
(--no-cache) except the last row. Counters are raw integers, never scaled; reproduce steps inbench/PROFILE.md (arming needs root; unprivileged runs print the same table
with timing columns only — the honest degrade). The report renders on stderr; stdout stays the
deterministic XML map, so redirects and | xmllint pipes behave the same in the profile flavour.
| scope | calls | instructions | IPC | L1D MPKI | wall |
|---|---|---|---|---|---|
| tree-sitter parse | 803 | 8.74 B | 3.52 | 4.0 | 731 ms |
| tags query exec + captures | 803 | 8.65 B | 3.22 | 3.0 | 635 ms |
| resolve refs + build CSR | 1 | 54.6 M | 3.27 | 35.4 | 3.6 ms |
| PageRank (power iteration) | 1 | 13.7 M | 3.17 | 32.4 | 0.93 ms |
| serialize ranked map | 1 | 3.24 M | 2.43 | 6.1 | 0.29 ms |
| warm run — loadCache (read + deserialize) | 1 | 52.3 M | 3.18 | 7.5 | 3.6 ms |
Three things the counters say that wall-clock alone cannot. The parse/query phases are
compute-dense, not stall-bound: 3.2–3.5 instructions retired per cycle at ~3–4 L1D misses per
thousand. The graph phases stream hard — 32–35 L1D MPKI — yet hold IPC above 3.1, which is the
DOD/SoA/CSR layout (G2) doing its visible job. And the auto-cache's whole story in two rows: a warm
run replaces the dominant phase's 8.74 B instructions with a 52.3 M-instruction cache load, ≈167×
fewer instructions. Caveats travel with the table: counters are per-thread and aggregated per
scope, so rows must not be summed across scopes (a recursive site samples only its outermost
frame); one machine, one corpus — re-run on yours. Backend contract is gated bytest/pmccheck.sh; M5 Pro event names verified (the last-level alias resolves
via PL2_CACHE_MISS_LD).
Every number on this page is the DEFAULT build — and there is a faster one you can opt into. A
clang optimization-remarks pass over src/ (-DRIPWIRE_OPT_REMARKS=ON; the whole triage is indocs/OPTREMARKS.md) found that the phases above spend their time calling
tree-sitter's C API across a translation-unit boundary — 397 of 636 distinct inline/NoDefinition
remarks in the hot TU name a ts_* accessor. Two build options answer that, both off by default:
| build | cold | warm | |
|---|---|---|---|
-DRIPWIRE_LTO=OFF |
baseline | baseline | the fast edit loop, not the fast binary |
default (cmake -S . -B build, LTO on) |
1–6% faster | 0–3% faster | |
scripts/pgobuild.sh (PGO on top of LTO) |
14–25% faster (6–16% over the default) | 5–10% faster | the fastest binary this tree can produce |
Measured by interleaved A/B (A,B,A,B,…, median and min, 9–31 runs per arm, repeated) on this
repository and on a ~2000-file C++ tree that appears in no training run — the held-out corpus shows
the same or larger gain, which is what rules out training on the benchmark. Output is
byte-identical on all three builds and on both corpora, and the determinism gate passes on every
tree; these options change how fast the answer arrives, never what it is. Cold gains 2–3× more than
warm because cold is a branchy walk over tree-sitter's parse tree, while warm already runs in the
cache-tuned CSR/SoA/B+tree structures G2 exists to produce. LTO is on by default — it costs link
time and nothing else, and link time is not what this tool is optimized for. PGO needs a training
run, so it stays a driven build (scripts/pgobuild.sh) rather than something a barecmake --build does behind your back.
And on machines with no PMU at all — most cloud VMs and CI boxes — the counter columns no longer
vanish. A kernel that refuses every hardware event (ENOENT; no vPMU is the common cloud case)
still offers software counters, so the Linux backend's per-event graceful skip now extends to the
group leader and falls through to two PERF_TYPE_SOFTWARE rows — task-clock (on-CPU ns) andpage-faults — under their own column names, never as a stand-in for the hardware counts. Below,
ripwire mapping its own tree, cold, on the 2-vCPU vPMU-less Intel Xeon VM this was validated live
on:
| scope | calls | wall | task-clock (on-CPU) | page-faults |
|---|---|---|---|---|
| tree-sitter parse | 799 | 1,773 ms | 1,134 ms | 6.4 k |
| tags query exec + captures | 799 | 1,084 ms | 1,071 ms | 6.7 k |
| doc post-pass (main-thread wait on the pool) | 1 | 2,174 ms | 0.50 ms | 0 |
| resolve refs + build CSR | 1 | 12.32 ms | 12.31 ms | 7 |
Four things this buys that wall-clock alone cannot say. The wall−task-clock gap is off-CPU time:
the parse phase's 36% gap is 2-vCPU oversubscription made visible (a pool parsing 799 files on two
cores). The CSR row is a live cross-check: task-clock is the kernel's clock, the wall column is
the profiler's own — two independent clocks agreeing to 0.05% on a single-threaded scope. (Short
hot scopes diverge by the documented read-bracket overhead instead: the counter bracket encloses
the tick bracket.) The page-faults column is a G2 witness: PageRank's power iteration retires
with zero page faults and the CSR build with 7, against ~3,100 in the allocation-heavy
model-build scopes — the no-allocation rule inside the ranked loop, watchable on a box with no PMU.
And the doc post-pass row caught something real: 2.17 s of wall on 0.5 ms of CPU is work
happening outside the process — with markitdown installed, the showcase PDF and PPTX are
re-extracted by subprocess on every run, cache or no cache, which on this box is ~97% of a warm
run's wall (2.05 s of 2.11 s); child CPU is invisible to every per-thread counter, and the
wall-vs-task-clock gap is precisely the signature that flags it. (The extraction is already
documented in-tree as a pure function of the file bytes — a cache candidate, now measured.) Only a
kernel that offers nothing at all — perf_event_paranoid>=3, seccomp — still degrades to
timing-only, and pmccheck's inactive arm now proves that was truly the case.
Standing on the whole field
Almost none of the ideas here are new; the combination and the constraints are. Lessons folded from
36 repositories and 67 papers into one deterministic executable, alongside a labelled
survey of 231 tools that folded nothing and are catalogued separately — the two sets are disjoint,
so they add rather than nest. The row-by-row ledger, each with the lesson taken and where it lives, isdocs/LINEAGE.md. Those three counts are derived from that document's own tables
by test/readmedriftcheck.sh, which fails if this sentence and those tables disagree.
One of those papers measures the alternative architecture directly: an independent study found a
planner that delegates exploration to a sub-agent in an isolated context window losing to search over
a pre-built index — 65.2% vs 46.2% accuracy, at less than half the cost — with 41.8% of the delegated
arm's failures happening silently at the planner→sub-agent hand-off
(arXiv:2608.01507). A single process answering in one call has no
hand-off to fail at.
The honesty contract
The differentiator is not a number, it is a discipline: a measurement you cannot check is a claim,
and this tool ships the check.
What it misses, and what to run next
A name-based call graph cannot see dynamic dispatch, a callback routed through a table, or a symbol
that exists only after macro expansion. Every static tool has that horizon; the one that costs you a
bug is the one that hides it. So the contract is not it sees everything — it is nothing it is
unsure about reaches your agent unlabelled.
Measured against a compiler-grade oracle, its silent-miss count is zero. Of 68 answers scored
against a scip-clang index, six were imperfect and four flagged themselves; the other two were
right, and the oracle was the one that could not see the files. No imperfect answer arrived unmarked.
When a mark says the cheap answer is not enough, escalate on purpose — never by guessing:
--expand=SYM— read the body it ranked, still a fraction of a whole-file read.--uses=SYM/--impact=SYM— every read, write and import site, and the transitive blast
radius.--callersalone under-counts, and says so.--scip=index.scip— hand it a compiler-grade index and precise edges replace the
name-based guesses, taggedprov="scip". Missing or corrupt index degrades; it never fails.
amb=, ambiguous=, counts_floor=, unresolved=, external=, --skipped
The map for this repository's own src/ grades itself in the header before a single answer
(2026-08-10, at 4e245d7): files=109 symbols=3233 edges=10132 ambiguous=4768 unresolved=1097.
Read ambiguous= as a property of the indexed tree, not a score for the resolver. It counts call
names that hit more than one definition, so it moves when the corpus gains same-named symbols — and
it just did, visibly. On 2026-08-09 this number rose from 2991 to 4507. The cause was attributed by
swapping one file back and re-measuring: src/infra/svector.h alone accounts for 4507 → 2741. The
small-vector there grew a full container interface, so the tree now defines its own size, begin,end, push_back and data — the most-called names in any C++ corpus. Adding a container is a name
collision by construction. Expect the number to climb again as that container replaces std::vector
across the tree; a rise there means the map is disclosing more overloading, not resolving worse.
| the output says | read it as |
|---|---|
amb="K" |
K of this symbol's calls hit an overloaded name — one target was chosen; read the source if which one matters |
ambiguous=N |
the map's completeness gauge, one number, in the header |
counts_floor="1" |
a floor, not a total — a zero means none found, never none exists |
unresolved=N |
call sites recognized and deliberately not resolved — counted, never dropped in silence |
external="1" |
no definition anywhere in the indexed tree — stdlib or third-party, not a miss |
--skipped |
every file the index does not contain, itemized with its reason — oversize, excluded, unsupported-ext, a pruned vendor tree (pruned_dirs=, contents unknown, not zero) — plus the files it DOES contain but cannot vouch for: degraded-parse (tree-sitter error spans, with err_ratio=) and minified-suspect (ws_freq=) |
A 34-query sweep of this repository, 68 answers across --uses and --callers, scored against ascip-clang index (2026-08-09, the shipping binary). Six answers were imperfect; four carried a
discriminating self-flag (amb=, defs>1, external="1"). The two unflagged were not misses:
the oracle could not see those files — a Python file under bench/, an uncompiled file undertest/ — and ripwire's answer was the correct one.
It errs the other way instead. 14 of 62 correct answers carried a caution flag they did not
need — 22.6% over-hedging, up from 18.6% before this round's resolver fixes, because closing loss
buckets added marks faster than it removed them. That bias is deliberate: a flag you did not need
costs you one source read; a miss you were never told about costs you a bug.
One corpus, 34 queries, and the oracle has blind spots of its own — the limits that travel with the
number are listed with it. Receipt, per-query scores and reproduction:bench/headtohead/r9-2026-08-09/.
In the output
Three rules the output enforces on itself: a zero reads as none found, never none exists;
every truncation says what it withheld and how to page it; and every count names its unit, because
the units differ by verb.
counts_floor="1", the shown_*/*_capped= paging vocabulary, and why two counts can disagree honestly
- A zero is a measurement, not an absence.
counts_floor="1"marks every count that name-based
resolution cannot prove is a total. Read a zero as none found, never none exists. - Truncation is disclosed where it happens.
shown_*,*_capped=and the paging attributes say
what was withheld and how to page it; the legend comment that leads each document defines the
vocabulary in full, so the output explains itself without this README. - Units are named, because they differ by verb. The callers count is distinct symbols, the impact
count is a reach set, the uses count is call sites. The legend says which, so two numbers that look
contradictory can be read as the different questions they answer.
In the numbers
The evaluation labels were authored by reading the source and deciding which symbol is the on-task
answer — never by transcribing the ranker's own output — so the eval is allowed to say the ranker is
wrong, and it has. These are the results that say so, all in-tree, all published on purpose:
--grepcosts more tokens than it saves, and--pack-signaturescan make output bigger —
both quantified next to the savings they qualify, because saying so
is cheaper than being caught.- The public C++ number is materially lower than the retired private one was. SFML: strict file@10
28.7%, any@10 41.7%, first-hit MRR 0.21 — measured at commitd411f3de4
(bench/cppbench/results/sfml_scoreboard.md). Until 2026-08-07 this bullet compared against a
roughly-89%-any@10 private corpus that is no longer reproducible from this tree; that comparison is
retired. The public number is the baseline going forward. - PageRank is a bad co-change ranker — 3.8% recall@5 against 40.3% for plain lexical, and fusing
the two made it worse. Relatedness is lexical; importance is structural; the tool uses different
machinery for each because the measurement said so. - Strict multi-file localization is hard and stays hard. Held-out LocBench: single-file gold
73.4%, multi-file 18.2%. Every corpus shows the same cliff.
In the tests
test/regression.sh names 542 gate scripts and is the authoritative list;python3 test/pargates.py . ./build/ripwire -j 6 runs the same set in parallel. On top of them sit the
contracts that do not fit a unit test: two runs byte-identical, warm output identical to cold, output
that pipes clean through xmllint --noout, a sanitizer build with -fno-sanitize-recover=all, and a
differential argv harness that runs a reference binary and the candidate over every argument vector
and requires stdout, stderr and exit code to match on each.
The house rule behind all of it: write the gate before the code it measures. A ranking, a token
estimate and a call graph all look plausible whether or not they are correct.
Set it up in your coding agent
If your agent can run shell commands, it is already set up. The CLI is the primary interface:ripwire on PATH costs the agent nothing until the moment it runs a command — no server to
register, no tool schemas riding in every request's context. The one step that matters is installing
the skills (step 2 below), which teach the agent when to reach for which verb.
The MCP server is the optional second interface, for what a shell pipe can't give you: clients
without shell access, lazy body handles (fetch a symbol's source only when actually needed), and
the same span-addressed edit operations against an already-warm index. The CLI exposes those edits too,
with the same staleness/ambiguity refusal and atomic-write contract:
ripwire . --replace-symbol-body=SYM --edit-payload=definition.txt
printf '%s' "$BLOCK" | ripwire . --insert-before-symbol=SYM --edit-payload=-
That MCP convenience has a
cost the CLI doesn't carry — the verb schemas sit in the agent's context every session — so register
it when you want those verbs, not as a default.
1. (Optional) Register the MCP server
ripwire wrap <agent> prints the recipe for the agent you name. It prints; it never edits your
config — you read the line, then run it.
ripwire wrap claude      # MCP:      claude mcp add ripwire -- ripwire --mcp
ripwire wrap cursor      # MCP:      the mcpServers stanza for .cursor/mcp.json (or ~/.cursor/mcp.json)
ripwire wrap codex       # CLI-first: optional MCP restricted to audit/health verbs in Codex TOML
ripwire wrap windsurf    # MCP:      that client's stanza
ripwire wrap gemini      # MCP:      that client's stanza
ripwire wrap opencode    # CLI-1st:  the AGENTS.md wiring; its "mcp" stanza offered as the alternative
ripwire wrap aider       # no MCP:   a ranked map file, and the aider invocation that reads it
ripwire wrap --all       # detect every installed agent and emit each one's config
One stdio server, 30 verbs — 15 read, 12 flagship-reflex, 3 span-addressed edit — and a client
that isn't one of the six above can be pointed at the same process by hand.
That registers one stdio server — ripwire --mcp — exposing 30 verbs: 15 read verbs, 12
flagship-reflex verbs, and 3 span-addressed edit verbs. Read verbs mirror the CLI (analyze, for,grep, cochange, fetch_body, lego, mentions, owners, memory_recall,situational_awareness, batch, …); find_symbol and find_referencing_symbols attach a stablehandle instead of a body, so the agent fetches source only when it actually needs it. The edit verbs
mirror the CLI flags and enforce the shared safety contract — staleness refusal, ambiguity refusal,
mode preservation and atomic writes. Full reference:skills/ripwire-mcp/.
Before printing, wrap security-scans ./skills and .agents/skills with the same engine as--scan-skills: a CRITICAL finding blocks the recipe, warnings print and continue.
If your client is not one of the six, the server is a plain stdio MCP process and every client
that speaks MCP can be pointed at it by hand. The whole configuration is:
{
  "mcpServers": {
    "ripwire": { "command": "ripwire", "args": ["--mcp"] }
  }
}
Use an absolute path in command if ripwire is not on the agent's PATH. For a client that wants a
socket instead of stdio, ripwire --listen=HOST:PORT serves the same verbs.
2. Install the skills
skills/ ships eighteen task-shaped skills that tell an agent which verb answers the moment it
is in — orienting cold, tracing a call, sizing a refactor, checking a diff, hunting a bug, writing
tests, reviewing security. Without them an agent has 30 verbs and no map of when each applies; the skills name the moment
each verb is for. Install as symlinks back into this repo, so edits here take effect
immediately:
skills/install.sh                 # → ~/.claude/skills
skills/install.sh --codex         # → ${AGENTS_HOME:-~/.agents}/skills (canonical Codex/agent path)
skills/install.sh --codex --hook  # → also install Codex's task router, CLI nudge + session primer
skills/install.sh --codex-legacy  # → ${CODEX_HOME:-~/.codex}/skills (older Codex installs)
skills/install.sh /some/path      # → an explicit destination
ripwire --scan-skills=skills      # read the security scanner's verdict first, if you would rather
The script's own header documents its other modes, including the opt-in advisory PreToolUse hook.wrap also prints a pasteable use-when blurb for your client's rules file (CLAUDE.md,AGENTS.md, .cursor/rules, …) and works from a prebuilt install with no checkout — from v0.2.2
it points at the installer's staged copy of the skills when the cwd is not a checkout.
Improve it with your agent
prompts/ holds eleven self-contained orchestrator prompts: the loops this project is
built with, written so a coding agent can run them. They encode the workflow rather than describing
it.
How to run one:
- Build the tool first — most loops need a binary to measure against:
cmake -S . -B build && cmake --build build -j - Open your coding agent at the root of a ripwire checkout.
- Paste the contents of one prompt file. It needs nothing else from that directory.
- It writes a plan and stops for your go-ahead. Nothing runs before you approve it — read the
plan, cut what you disagree with, then say go. - The loop runs its own gates in the foreground and reports what it left green.
Three worth starting with:
| Prompt | What it produces |
|---|---|
full-audit.md |
A severity-ranked audit across bugs, measured performance, verb-to-moment matching, token efficiency, and an ecosystem scan of papers and repos with real momentum. |
dogfood-gaps.md |
A real task done using only ripwire for navigation, with every fallback to grep or a whole-file read logged as a product gap at the moment it happened. |
capture-audit.md |
A fresh showcase capture read by parallel adversarial lenses, and the findings turned into family-wide gates. |
The other seven — a paired head-to-head against a competitor, a ranking-eval loop that mines real
retrieval misses from your own sessions, a per-language improvement pass, a zero-context onboarding
study, a sibling sweep, a live command tour, a showcase build — are listed with their audiences inprompts/README.md. Each states its own scope and its honesty rules, and most name the gates they must leave green.
Languages
C, C++, Objective-C / Objective-C++, Metal (Metal Shading Language, .metal — indexed with the
C++ grammar, since MSL is a C++14 dialect, so a dual-compile header's symbols resolve from both the
GPU and CPU halves), CUDA (.cu/.cuh — indexed with the vendored tree-sitter-cuda grammar,
so kernel<<<grid, block>>>( … ) launch sites are real call edges and --callers of a kernel names
its host-side launchers; __constant__ module tables index as symbols even uninitialized — thecudaMemcpyToSymbol idiom — and SCREAMING_SNAKE __device__/__managed__ globals join them;
dual-compile .cuh headers resolve from both halves), Python, TypeScript,
JavaScript, Java, Ruby, PHP (.php/.phtml — classes, interfaces, traits, enums, functions,
methods and constants; $o?->m() null-safe and A::m() static calls are edges; use directives are
imports. Dynamic dispatch — $fn(), call_user_func, __call — names its callee at run time and is
a stated floor, not a silence), Lua (all five spellings that define a function, including theM.f = function and table-constructor forms; function M:f() is a method. Metatable inheritance is
a runtime call with no syntax to read, so a Lua corpus reports no inheritance edges — stated, not
implied), Bash, Go, Rust, Swift, C#, JSON + TOML + YAML (config keys — a[tool.ruff.lint] table is one symbol under its full dotted name, andpyproject.toml/Cargo.toml/CI workflows become greppable), and Markdown (.md/.markdown —
the DOC tier: every heading, ATX or setext, is a section symbol whose span runs to the next
same-or-higher heading, so --for ranks the section, --expand serves the section body, --recall
answers section-granular, and links/backtick mentions are doc→doc and doc→code edges).
Twenty-one tree-sitter grammars, all vendored.
Want another language? The pipeline is language-agnostic past the parse: a new language is a
vendored tree-sitter grammar, its query file, and one row in the declarativeextension → { grammar, queries } table (the "declarative constexpr tables" rule inCONTRIBUTING.md) — open an issue naming the grammar and the repo you'd run it on.
Notebooks, HTML and CSV are indexed as documents for --recall and the doc↔code edges behind--mentions; Office and PDF join them through an optional bridge. Markdown graduated from that
tier: it parses with its own vendored grammar, so its headings are symbols, not just document text.
Documentation
| Need | File |
|---|---|
| Every flag, with a real invocation and its recorded output | docs/COMMANDS.md |
| The authoritative flag list, always current | ./build/ripwire --help |
| Pipeline, data model, determinism contract, output-honesty contract | docs/ARCHITECTURE.md |
| Every published number, its instrument, and what is not published | docs/EVALS.md |
| Compiler optimization remarks: the triage, and the two opt-in faster builds | docs/OPTREMARKS.md |
| The method, as something transferable | docs/METHODOLOGY.md |
| Where every idea came from, and where each one lives in the code | docs/LINEAGE.md |
| C++ house style, the G1–G5 guardrails, gate discipline, the submission checklist | CONTRIBUTING.md |
| Orientation for a coding agent working on this repository | CLAUDE.md / AGENTS.md |
| User-visible capabilities, behaviour changes, known limits | CHANGELOG.md |
| Vendored dependencies and their licences | THIRD_PARTY.md |
| The whole tool in 27 slides — the showcase deck | present/ripwire-showcase.pdf (pptx, rebuilt by present/deck5_ripwire_build.js) |
If a document disagrees with --help, the document is the bug.
Contributions are welcome — read CONTRIBUTING.md first, andCODE_OF_CONDUCT.md. Security reports: SECURITY.md.
Licence
Apache License 2.0 — see LICENSE for the full text.
Copyright 2026 David Brewster
Vendored third-party code keeps its own licence; every dependency is enumerated with its terms inTHIRD_PARTY.md.
Reviews (0)
Sign in to leave a review.
Leave a reviewNo results found