riva
Health Uyari
- License — License: MIT
- Description — Repository has a description
- Active repo — Last push 0 days ago
- Low visibility — Only 7 GitHub stars
Code Gecti
- Code scan — Scanned 12 files during light audit, no dangerous patterns found
Permissions Gecti
- Permissions — No dangerous permissions requested
This tool is a local-first observability and control plane designed to monitor, log, and manage AI agents running on your machine. It provides a web dashboard and CLI to track agent behavior, resource usage, and tool calls in real time.
Security Assessment
Overall Risk: Low. The codebase was scanned and contains no hardcoded secrets or dangerous code patterns, and it does not request any risky system permissions. Because it monitors local AI agent activity (reading session JSONL logs and hooking events), it inherently processes potentially sensitive data, including shell command executions and prompts. However, it runs entirely locally. Network activity is restricted to local interfaces to serve the web dashboard and REST API (OTLP).
Quality Assessment
The project is under active development, with the most recent code push occurring today. It uses the permissive MIT license, making it safe for integration into most workflows. However, community trust and visibility are currently minimal. With only 7 GitHub stars, the tool is in its early stages and has not yet been widely peer-reviewed or battle-tested by a large audience.
Verdict
Safe to use, but keep in mind that it has low community visibility and is a very new project.
Local-first observability and control plane for AI agents.
![]()
AI Agent Command Center
Observe, monitor, and control local AI agents running on your machine.
![]()
![]()
![]()
![]()
![]()
Riva is a local-first observability and control plane for AI agents.
It helps you understand what agents are running on your machine, what they are doing, and how they are behaving in real time.
As agent frameworks push toward autonomy, visibility often disappears.
Riva exists to restore clarity, safety, and trust.
Getting Started · How it works · CLI Reference · Web Dashboard · Security · Contributing · Discord
Demo
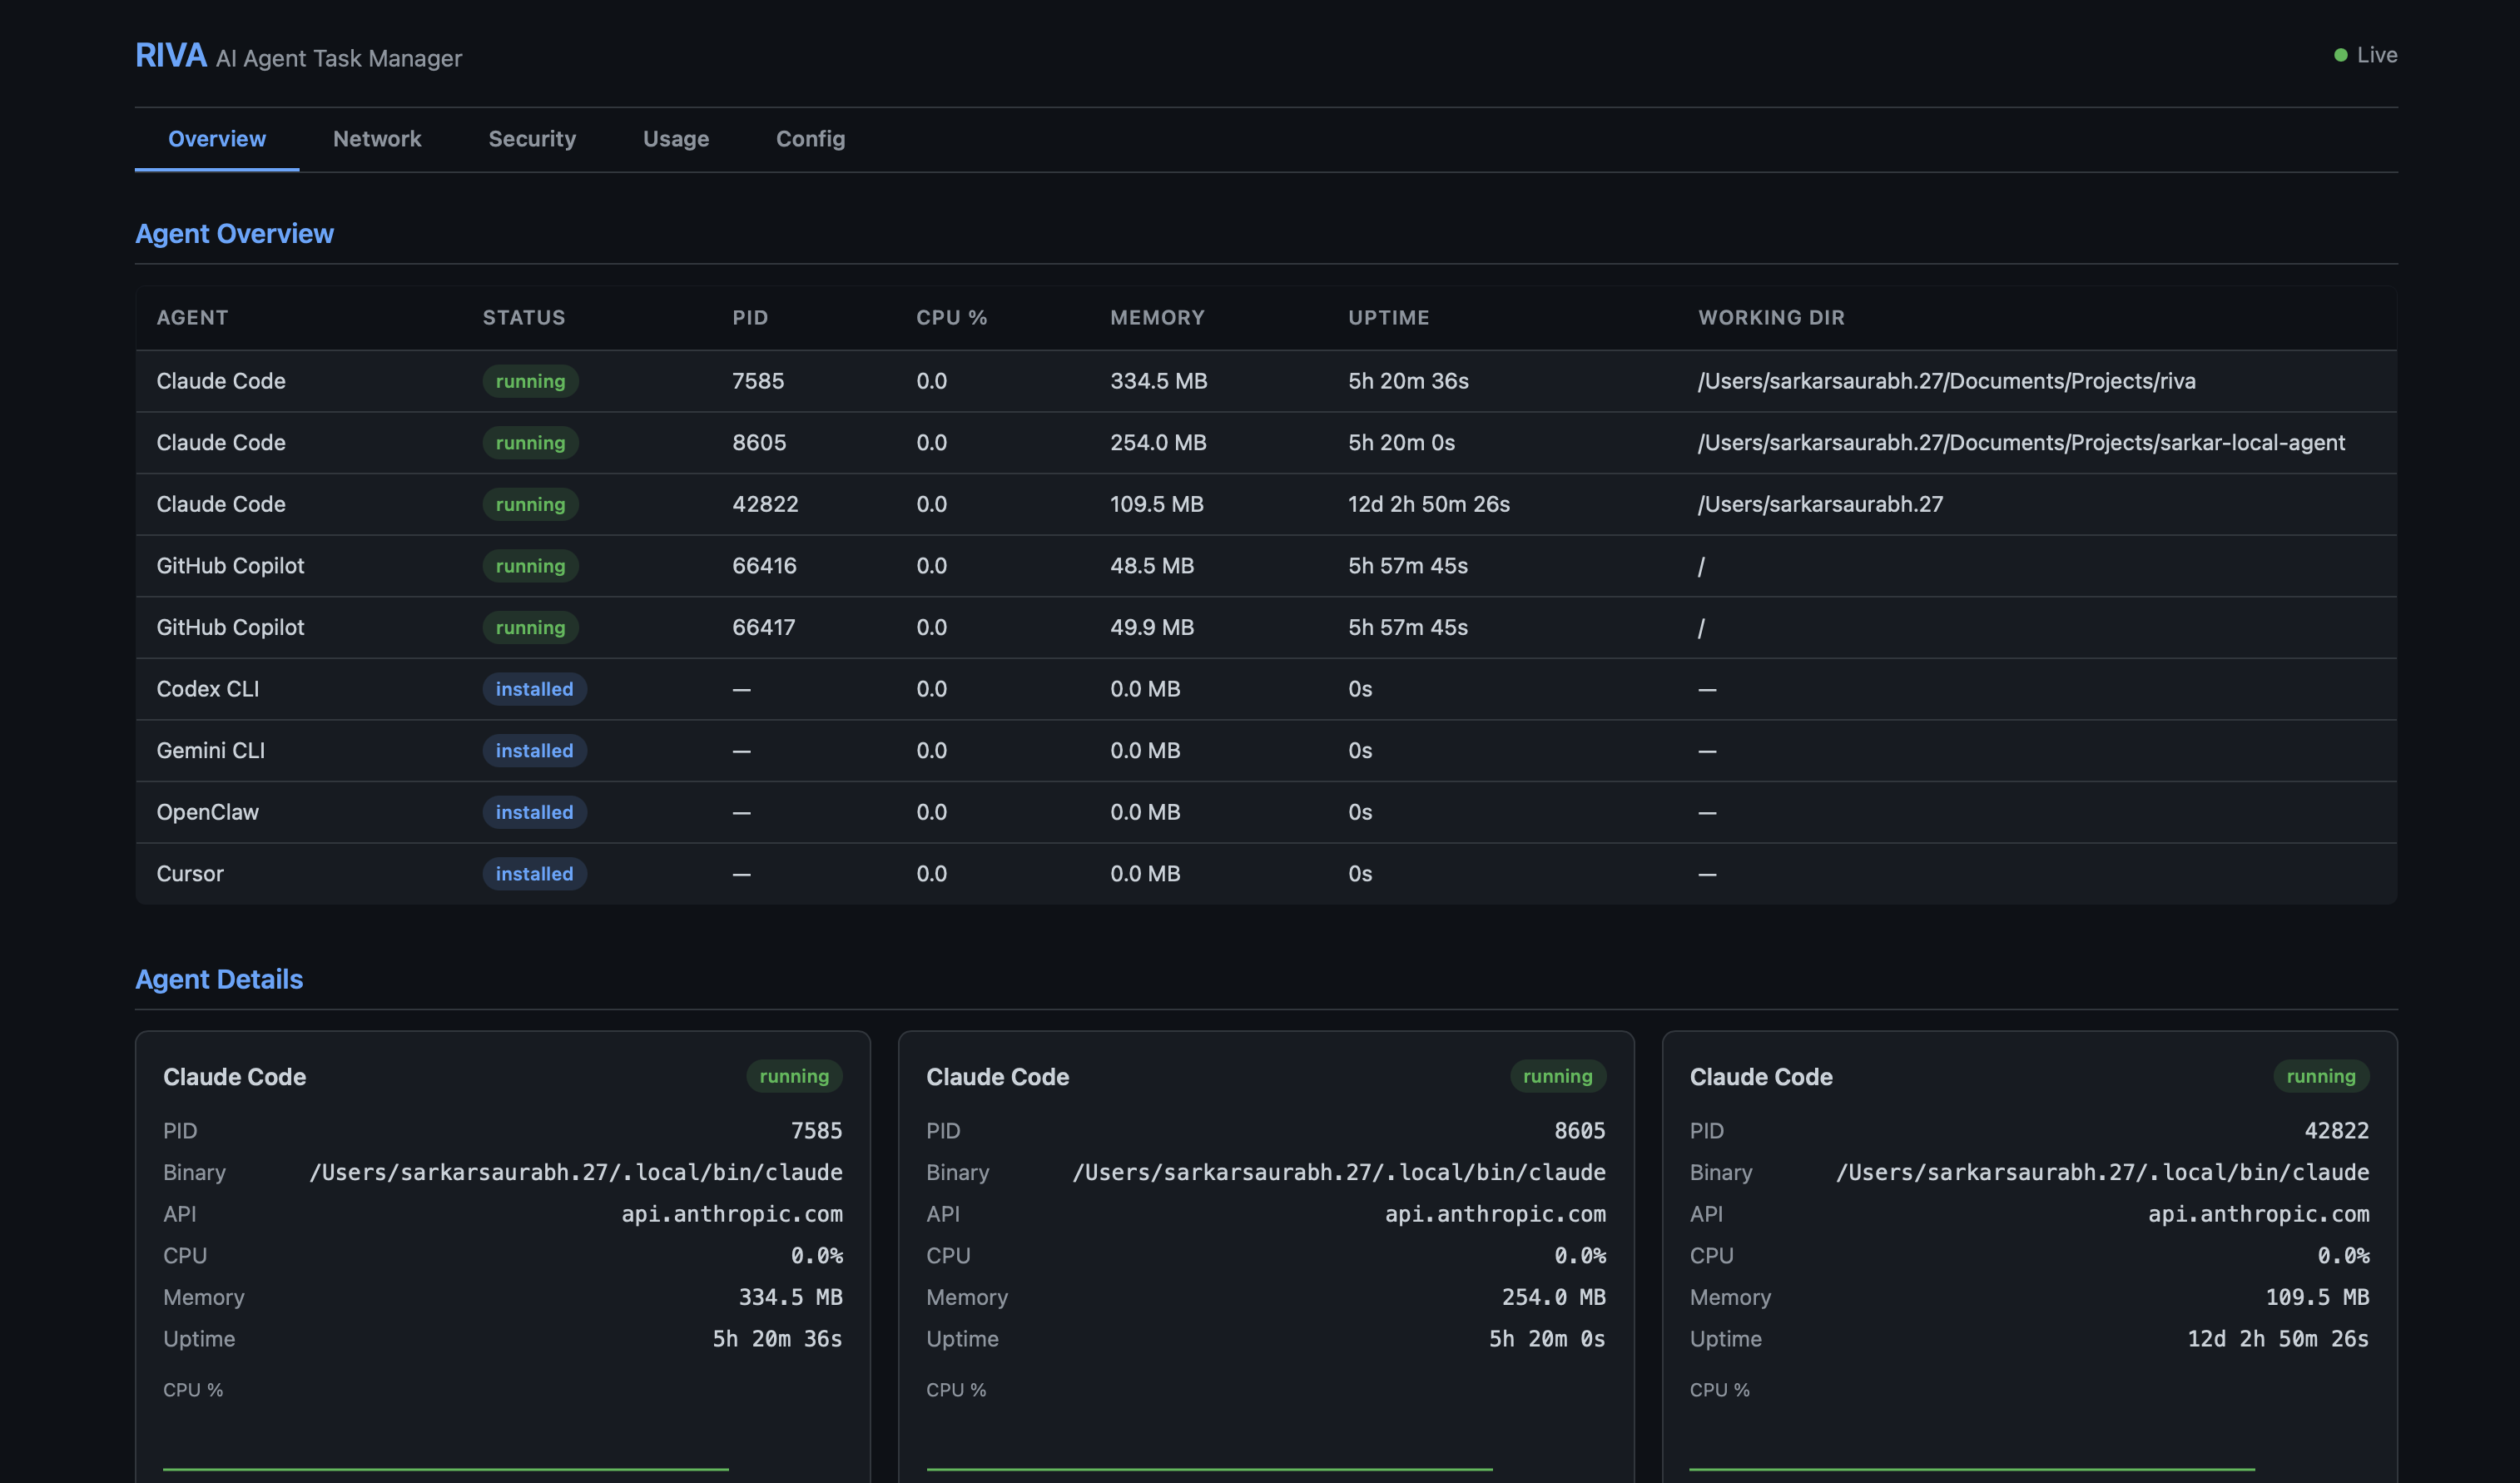
| Agent Overview | Infosec Monitoring |
|---|---|
 |
 |
| Event Stream (v0.3.14) | Events → Forensic Drill-in |
|---|---|
 |
 |
| Forensic Timeline — Tool Calls, Patterns, Dead Ends |
|---|
 |
How it works
Local Agents (Claude Code / Codex CLI / Gemini CLI / LangGraph / CrewAI / AutoGen / ...)
        |              |                        |
        | hook events  | session JSONL tail     | OTLP push
        v              v                        v
        +----------------------------------------------+
        |                    Riva                      |
        |  discovery · metrics · logs · lifecycle      |
        |  hook_events (tool calls · sessions · spans) |
        +--------------------+-------------------------+
                             |
        +--------------------+-------------------------+
        |          |         |           |             |
      CLI         TUI    Web Dashboard  REST API   System Tray
                Events tab  /api/events  /otlp/v1/*  (macOS)
Riva runs entirely on your machine.
It observes agent behavior but does not execute agent actions.
Highlights
- Agent discovery — detect locally running agents across 15 frameworks and growing (Claude Code, Kiro, Cursor, Cline, Windsurf, Continue.dev, Codex CLI, Gemini CLI, Strands, and more)
- Lifecycle visibility — see when agents start, stop, crash, or hang
- Resource tracking — CPU, memory, and uptime per agent in real time
- Token usage stats — track token consumption, model usage, and tool call frequency
- Event stream (new in v0.3.14) — real-time tool-call visibility via three ingestion paths: Claude Code hook events, JSONL session file tail-watching (Claude Code + Cursor), and OTLP HTTP receiver (any OTel-instrumented agent); all surfaced in the new Events tab (
3/e) inriva watch - Claude Code hooks (new in v0.3.14) —
riva hooks installregisters Riva into Claude Code's hook system in one command; everyPreToolUse,PostToolUse,SessionStart,SubagentStop, andStopevent is streamed to Riva in real time - OTLP receiver (new in v0.3.14) —
POST /otlp/v1/traces|metrics|logsaccepts protobuf and JSON; LangGraph, CrewAI, AutoGen and any OTel-instrumented agent can push directly to Riva - Environment scanning — detect exposed API keys in environment variables
- Sandbox detection — detect whether agents run inside containers (Docker, Podman, containerd, LXC) or directly on the host
- Session forensics —
riva forensicdeep-dive analysis of agent session transcripts — timeline, patterns, decisions, efficiency metrics; works for both interactive and non-interactive (API/MCP) sessions - Skills system —
riva skillstracks workflows across sessions with usage count, success rate, backtrack rate, and avg token cost; discoverable from all agents (Claude Code commands/skills, Kiro hooks/specs, Cursor rules, Continue slash commands, Windsurf memories, Codex/Gemini instructions, Cline rules) - OpenTelemetry export —
riva otelpushes metrics, logs, and traces to any OTel-compatible backend (Datadog, Grafana, Jaeger) via OTLP - Boundary monitoring — continuous policy evaluation every poll cycle — flag violations for file access, network connections, process trees, and privilege
- Compliance audit log — tamper-evident JSONL log with HMAC chain, CEF export for SIEMs, integrity verification via
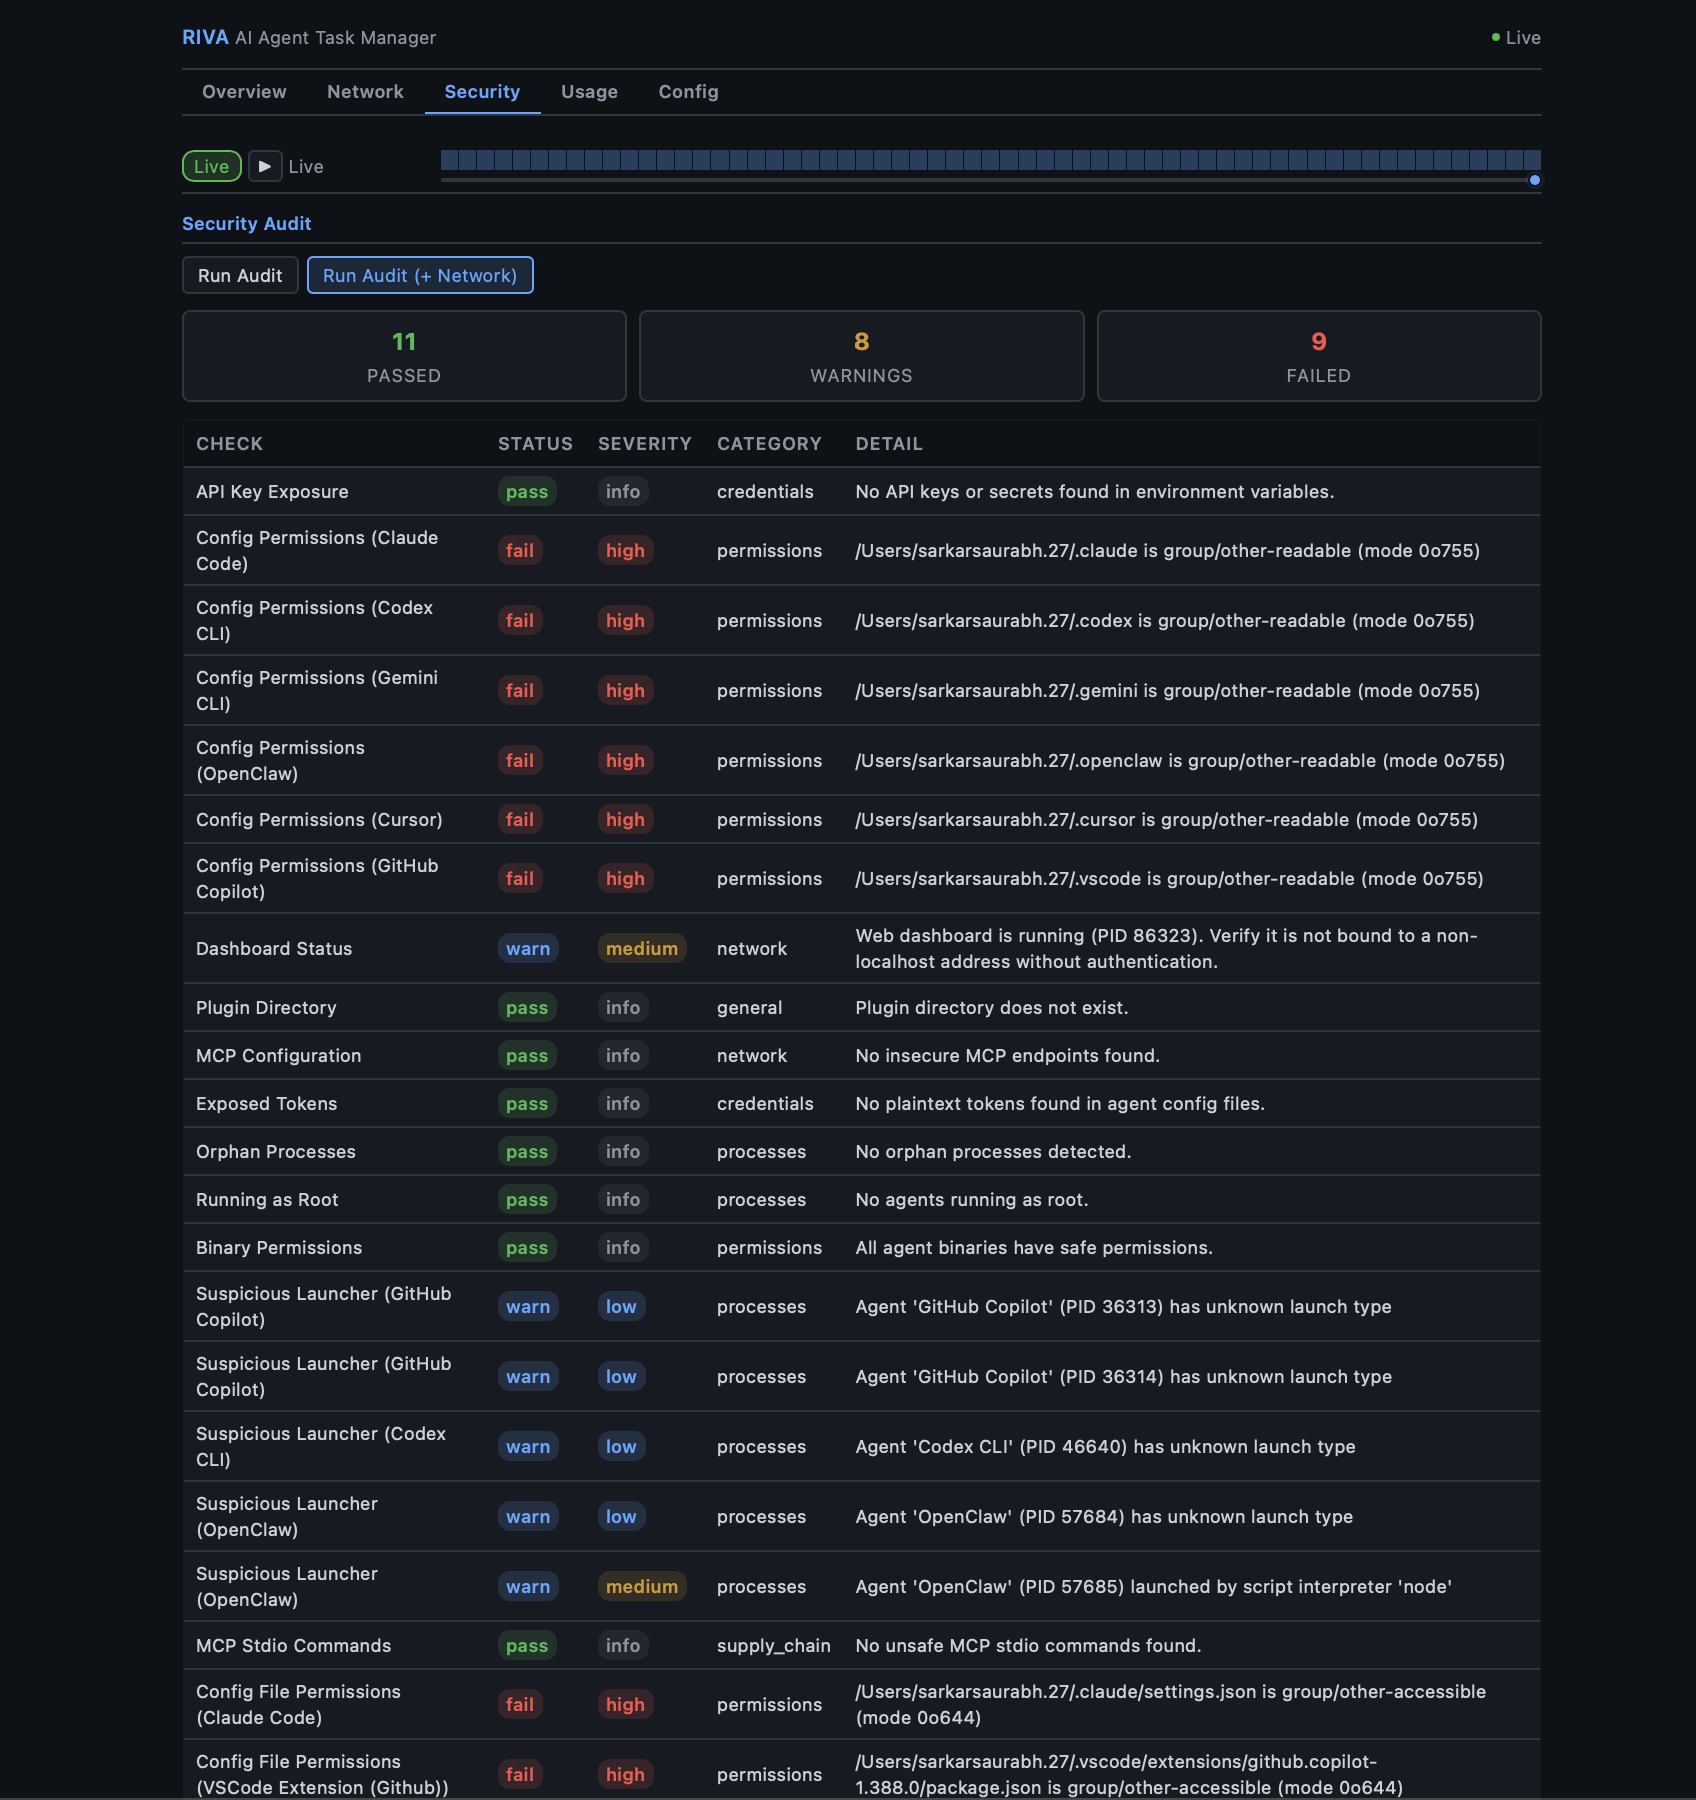
riva audit verify - Security audit —
riva auditchecks for config permission issues, exposed secrets, and dashboard misconfiguration - System tray — native macOS menu bar app for quick access to TUI, web dashboard, scan, and audit (compiled Swift)
- Web dashboard — Flask-based dashboard with REST API, security headers, optional auth token, forensic drill-in, Skills tab, and Events feed
- Skill description —
riva --skill-helpoutputs structured Markdown so any AI agent can use riva as a tool; invocable as an MCP skill - Framework-agnostic — works across multiple agent frameworks and custom agents
- Local-first — no cloud, no telemetry, no hidden data flows
Supported Frameworks
Riva ships with built-in detectors for these agent frameworks:
| Framework | Binary / Process | Config Dir | API Domain |
|---|---|---|---|
| Claude Code | claude |
~/.claude |
api.anthropic.com |
| Kiro | kiro (Electron) |
~/.kiro |
api.kiro.aws |
| Codex CLI | codex |
~/.codex |
api.openai.com |
| Gemini CLI | gemini |
~/.gemini |
generativelanguage.googleapis.com |
| OpenClaw | openclaw, clawdbot |
~/.openclaw |
varies |
| LangGraph | langgraph / Python |
~/.langgraph |
api.smith.langchain.com |
| CrewAI | crewai / Python |
~/.crewai |
app.crewai.com |
| AutoGen | autogen / Python |
~/.autogen |
varies |
| OpenCode | opencode |
~/.config/opencode |
varies |
Python-based frameworks (LangGraph, CrewAI, AutoGen) are detected by matching python processes whose command line references the framework.
Adding more frameworks — Riva is extensible via:
- Built-in detectors in
src/riva/agents/ - Third-party pip packages using
[project.entry-points."riva.agents"] - Plugin scripts dropped into
~/.config/riva/plugins/
What Riva Is Not
Riva is intentionally not:
- An AI agent
- An orchestration framework
- A cloud monitoring service
- A replacement for agent runtimes
Riva does not make decisions.
It makes agent behavior visible.
Requirements
- macOS (Ventura, Sonoma, Sequoia) or Linux
- Windows via WSL2
- Python 3.11+
- System tray (optional, macOS only): Xcode Command Line Tools (
xcode-select --install)
Quick Start
Install from PyPI
pip install riva
Install via bash script
curl -fsSL https://raw.githubusercontent.com/sarkar-ai-taken/riva/main/install.sh | bash
Install from source
git clone https://github.com/sarkar-ai-taken/riva.git
cd riva
pip install -e ".[test]"
Verify
riva --help
CLI Reference
riva scan
One-shot scan for running AI agents.
riva scan              # Rich table output
riva scan --json       # JSON output
riva scan --otel       # Scan and export metrics/logs to OTel collector
riva watch
Launch the live TUI dashboard with real-time resource monitoring.
riva watch
Tab keys:
| Key | Tab | Content |
|---|---|---|
1 / m |
Main | Agent table, resource cards, network, security, forensic summary |
2 / s |
Skills | All skills with forensic stats |
3 / e |
Events | Real-time event stream — hook events, JSONL tail, OTLP (last 1 h) |
riva tray
Native macOS system tray (menu bar app). Provides quick access to both the TUI and web dashboards, plus scan and audit actions.
riva tray                      # Start daemon (background)
riva tray start                # Same as above
riva tray start -f             # Foreground mode
riva tray start --port 9090    # Custom web port
riva tray stop                 # Stop the tray daemon
riva tray status               # Show running state and PID
riva tray logs                 # View tray logs
riva tray logs -f              # Follow log output
Requires Xcode Command Line Tools (xcode-select --install). The Swift binary is compiled on first launch and cached at ~/.cache/riva/tray-mac.
Menu items:
| Action | Description |
|---|---|
| Open TUI Dashboard | Opens Terminal.app with riva watch |
| Open Web Dashboard | Opens browser to the web dashboard URL |
| Start Web Server | Starts the web daemon in the background |
| Stop Web Server | Stops the running web daemon |
| Quick Scan | Opens Terminal.app with riva scan |
| Security Audit | Opens Terminal.app with riva audit |
| Quit | Exits the tray |
riva stats
Show token usage and tool execution statistics.
riva stats                        # All agents
riva stats --agent "Claude"       # Filter by name
riva stats --json                 # JSON output
riva list
Show all known agent types and their install status.
riva list
riva config
Show parsed configurations for detected agents.
riva config
riva audit
Security audit and compliance commands.
riva audit                              # Run security audit (PASS/WARN/FAIL table)
riva audit run --json                   # JSON output
riva audit run --network                # Include network security checks
riva audit log                          # Show recent audit log entries
riva audit log --hours 48 --type boundary_violation  # Filter by time and type
riva audit verify                       # Verify HMAC chain integrity
riva audit export --format jsonl        # Export for compliance (default)
riva audit export --format cef          # CEF format for SIEM (Splunk, QRadar)
riva audit export --hours 72 -o report.cef  # Custom time range and output
Checks performed:
- API key / secret exposure in environment variables
- Config directory and file permissions (group/other-accessible)
- Web dashboard bind address and status
- Plugin directory existence and permissions
- MCP server configs — HTTP endpoints, shell commands, temp-dir references
- Plaintext token scanning across all agent config files
- Agent processes running as root (UID 0)
- Agent binary writability (group/world-writable binaries)
- Suspicious launcher detection (unknown or script-interpreter parents)
- Orphan process detection
- Network checks (with
--network): unencrypted connections, unknown destinations, excessive connections, stale sessions
See Security Audit Details for the full list and rationale.
riva forensic
Session forensics — deep-dive analysis of AI agent session transcripts (JSONL).
riva forensic sessions                    # List recent sessions
riva forensic sessions --project riva     # Filter by project
riva forensic summary latest              # Summary of latest session
riva forensic timeline <slug>             # Event-by-event timeline
riva forensic patterns <slug>             # Detected anti-patterns
riva forensic decisions <slug>            # Key decision points
riva forensic files <slug>                # File access report
riva forensic trends                      # Cross-session aggregate metrics
riva forensic trends --limit 50 --json    # JSON output
Session identifiers: latest, a session slug (e.g. witty-shimmying-haven), a UUID prefix, or a full UUID.
riva skills
Track reusable agent workflows (slash commands, tool sequences) with forensic stats.
riva skills list                        # All skills with usage count, success rate, avg tokens
riva skills list --agent claude         # Filter by agent
riva skills list --json                 # JSON output
riva skills scan                        # Parse recent sessions and record invocations
riva skills scan --all-sessions         # Process all historical sessions
riva skills stats /commit               # Per-skill breakdown
riva skills add "deploy"                # Create a skill in the global registry
riva skills share /commit --to cursor   # Mark shared, reassign agent
riva skills export skills.toml          # Export all skills to TOML
riva skills import skills.toml          # Import skills from TOML (deduped by id)
Skills are defined in ~/.riva/skills.toml (global) or .riva/skills.toml (workspace):
[skill.commit]
name = "commit"
description = "Stage and commit with a conventional commit message"
agent = "Claude Code"
invocation = "/commit"
tags = ["git", "workflow"]
shared = true
Riva auto-discovers skills from agent-specific sources:
| Agent | Skills concept | Source |
|---|---|---|
| Claude Code | Commands + installed skills | ~/.claude/commands/*.md, .claude/skills/*/SKILL.md |
| Kiro | Hooks + specs | ~/.kiro/hooks/*.md, ~/.kiro/specs/*.md |
| Cursor | Project rules | ~/.cursor/rules/*.mdc, .cursor/rules/*.mdc |
| Continue.dev | Slash commands | slashCommands[] in ~/.continue/config.json |
| Windsurf | Memories + rules | ~/.codeium/windsurf/memories/*.md, .windsurfrules |
| Codex CLI | Instructions | ~/.codex/instructions.md, AGENTS.md |
| Gemini CLI | Instructions | ~/.gemini/GEMINI.md, GEMINI.md |
| Cline | Rules | ~/.clinerules, .clinerules |
Slash commands (e.g. /commit, /review-pr) in session JSONL are automatically detected and linked to skill invocations during riva skills scan.
riva skills send — Cross-agent Skill Export
Share skills between workspaces and across agent frameworks. Riva converts each skill into the target agent's native format automatically.
# Same agent, different workspace
riva skills send frontend-design --to /path/to/project2

# Claude Code → Cursor
riva skills send frontend-design --to /project2 --agent cursor

# Claude Code → Gemini CLI
riva skills send frontend-design --to /project2 --agent gemini-cli

# Disambiguate when multiple agents have same skill name
riva skills send commit --from claude-code --to /project2 --agent codex-cli
Supported target formats:
| Target agent | Written to |
|---|---|
| Claude Code | .claude/commands/<name>.md |
| Cursor | .cursor/rules/<name>.mdc |
| Codex CLI | AGENTS.md (appended section) |
| Gemini CLI | GEMINI.md (appended section) |
| Kiro | .kiro/specs/<name>.md |
| Cline | .clinerules (appended section) |
| Windsurf | .windsurfrules (appended section) |
Web dashboard: click Send on any skill row to open the export modal:
| Skills Tab with Send buttons | Export Skill Modal |
|---|---|
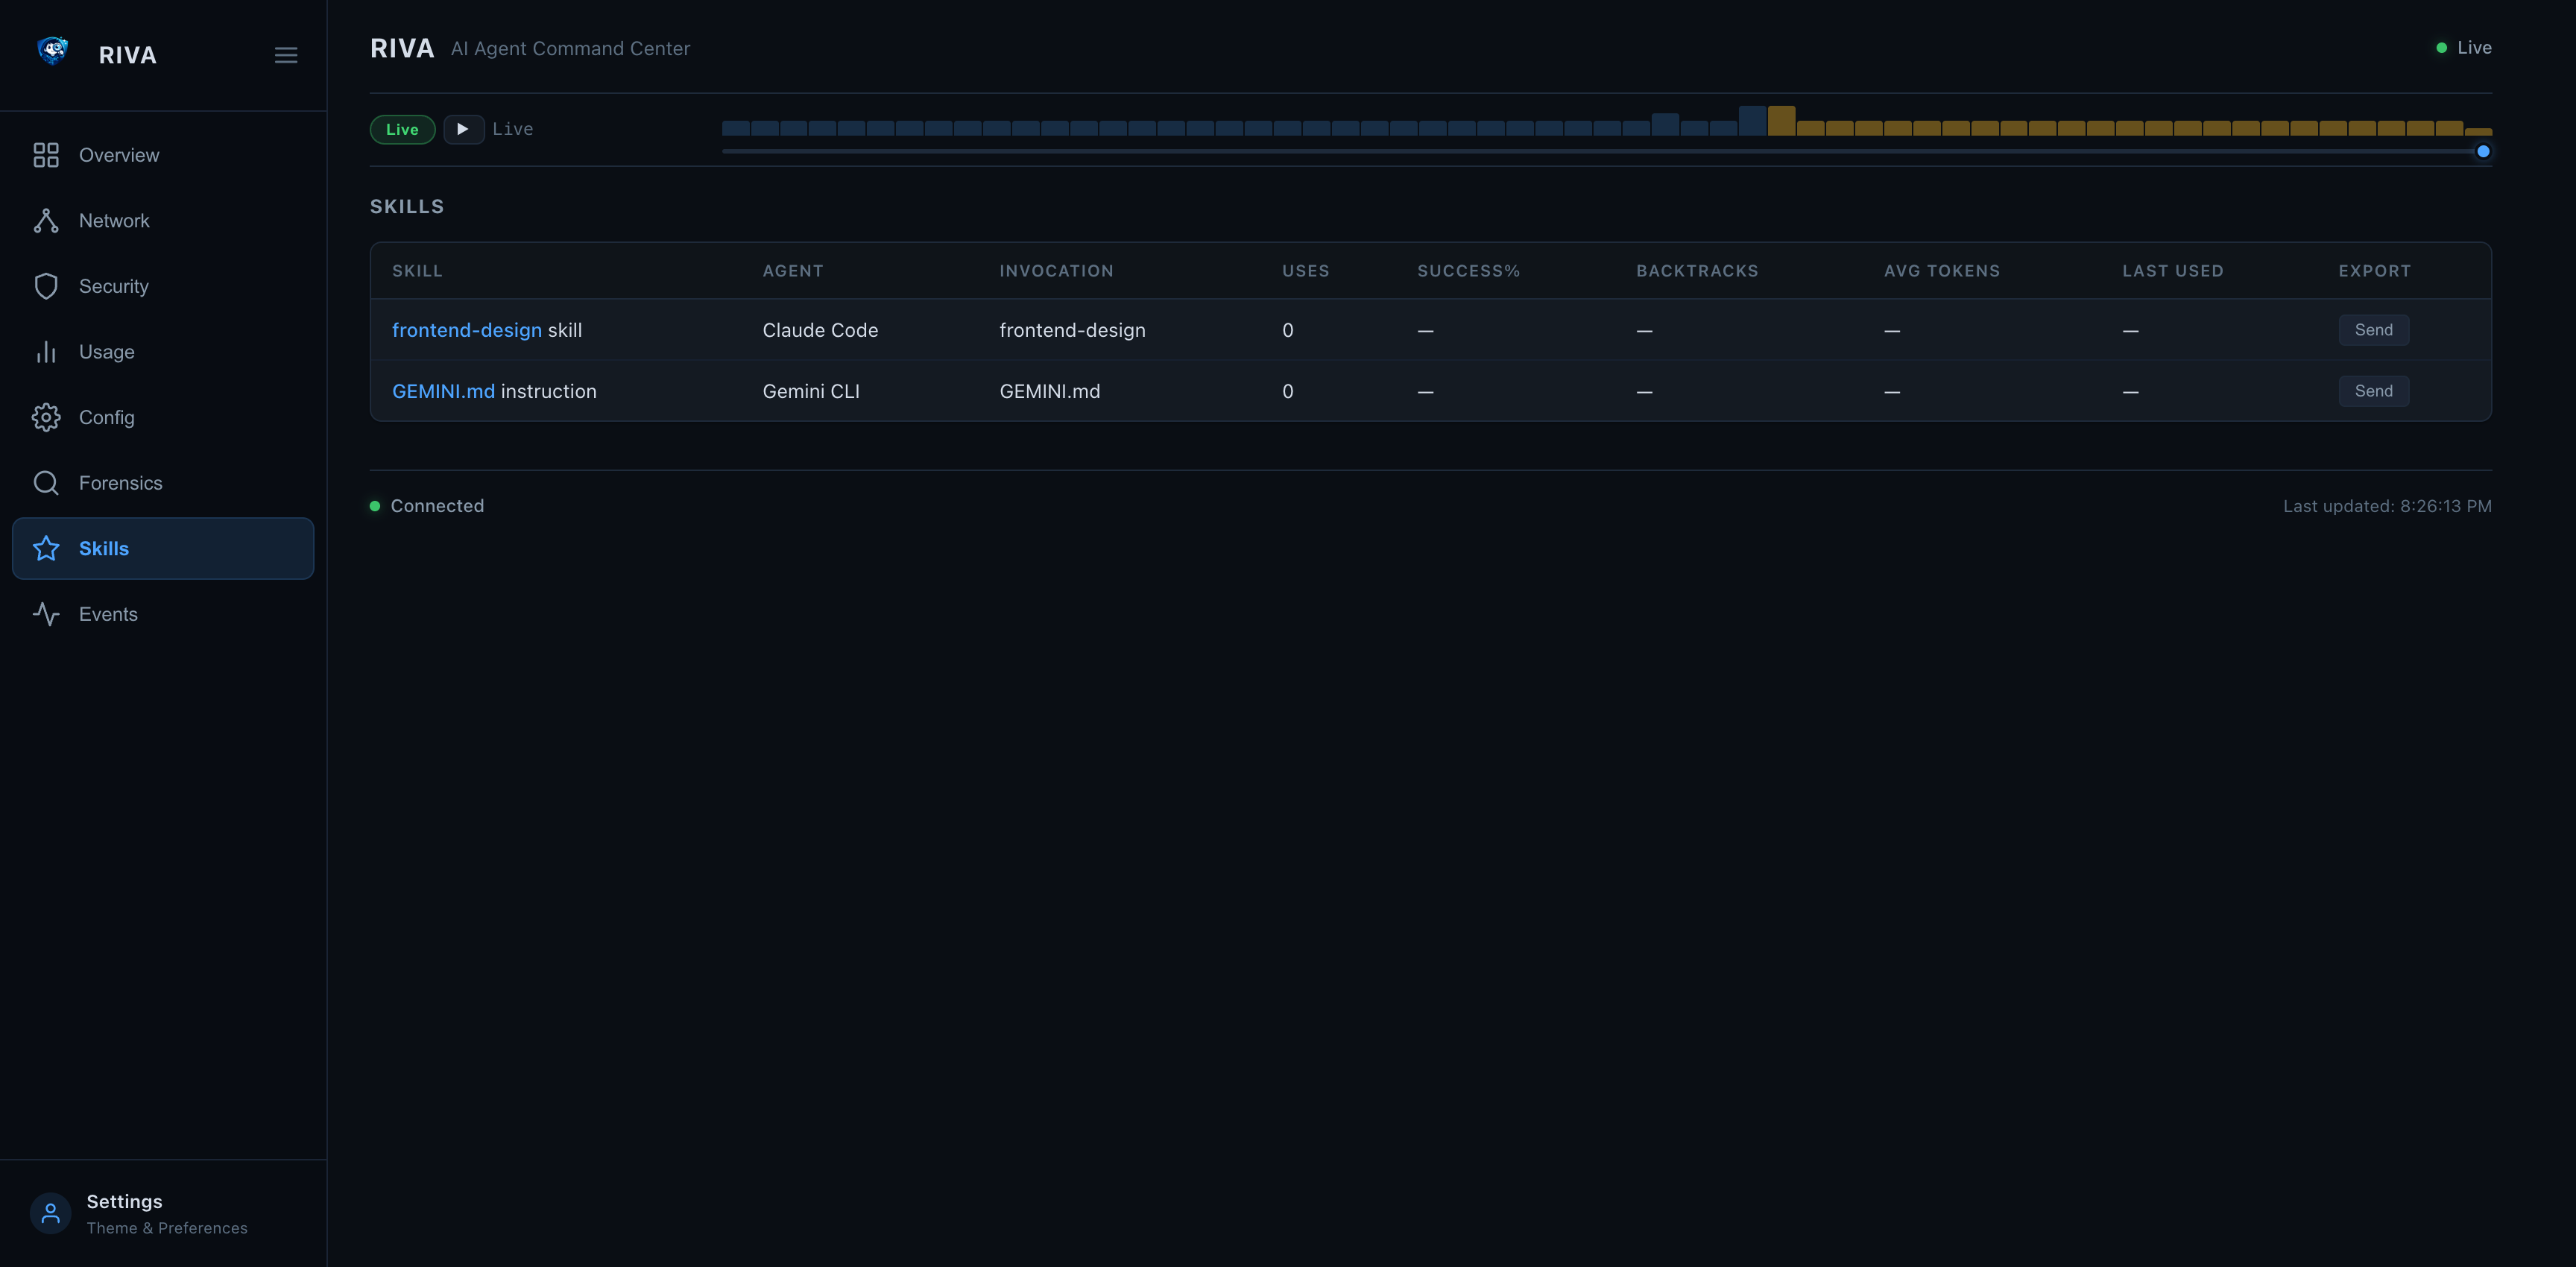 |
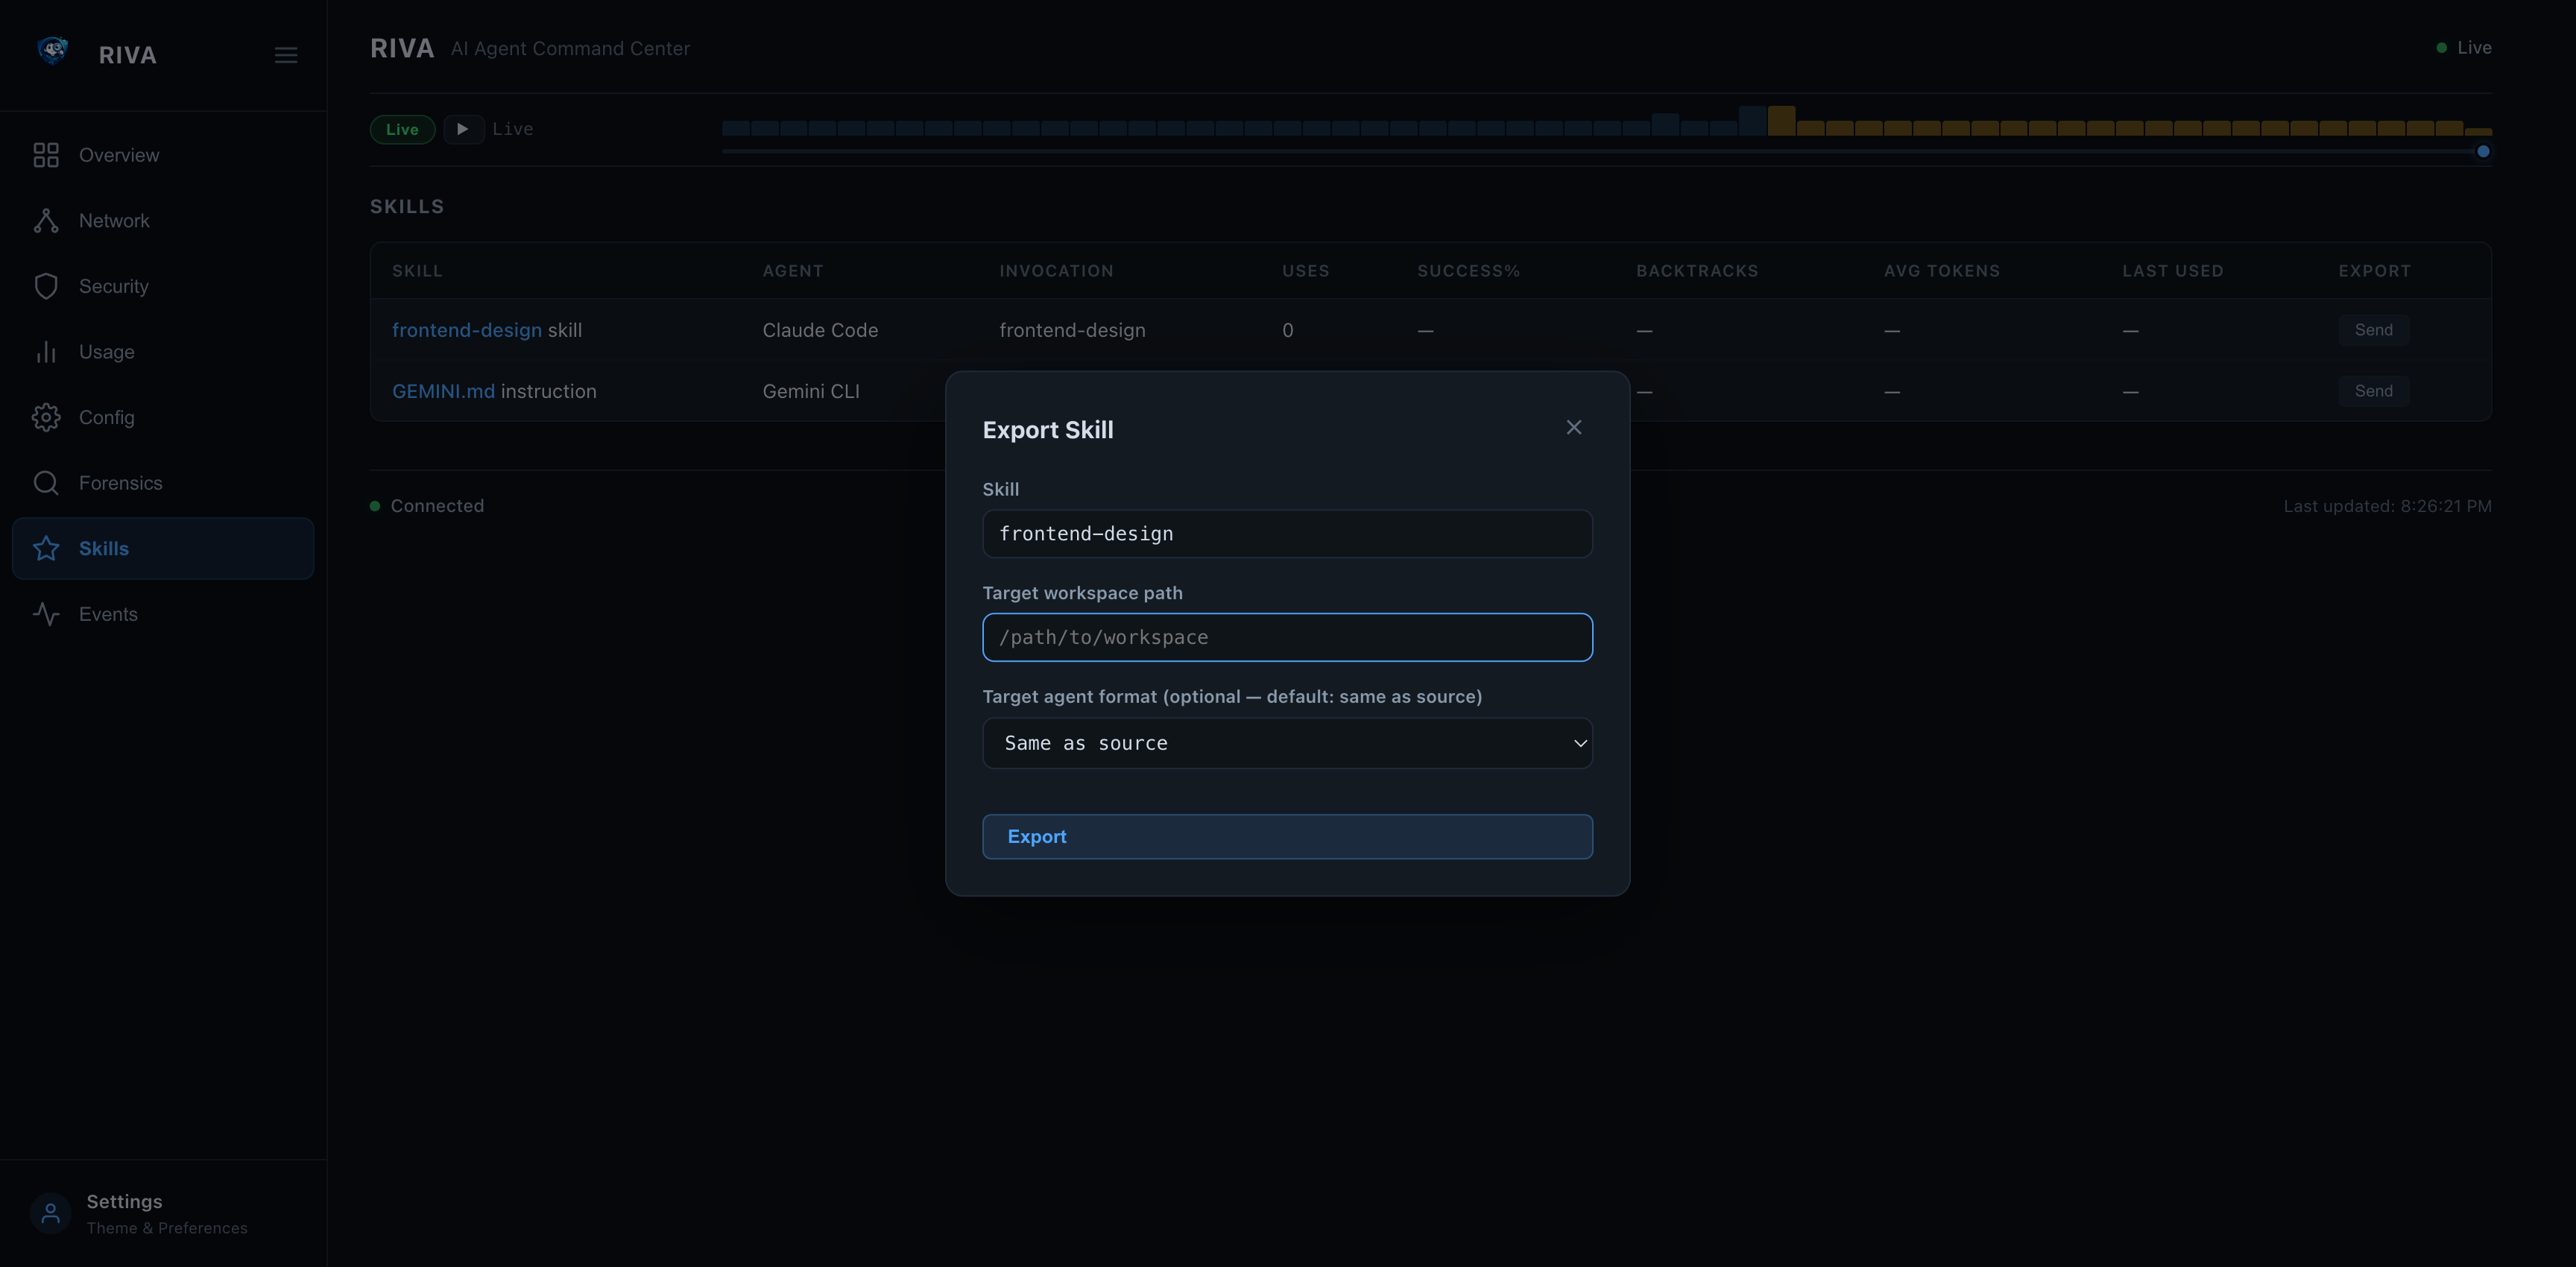 |
riva hooks
Install and manage Riva's real-time hook integrations with AI agents.
riva hooks install                    # Register Riva hooks in ~/.claude/settings.json
riva hooks install --agent claude-code  # Explicit agent (default)
riva hooks uninstall                  # Remove Riva hook entries
riva hooks status                     # Show which events have Riva hooks installed
Once installed, every Claude Code tool call (PreToolUse, PostToolUse), session start, subagent stop, and stop event is streamed to the running Riva server in real time.
Quick setup:
pip install riva
riva hooks install        # one-time setup
riva watch                # launch dashboard — press 3 for the Events tab
# now run Claude Code in any terminal
Environment variables for the hook script:
| Variable | Default | Purpose |
|---|---|---|
RIVA_SERVER_URL |
http://127.0.0.1:8585 |
Riva server base URL |
RIVA_AUTH_TOKEN |
(none) | Bearer token if riva web start --auth-token was used |
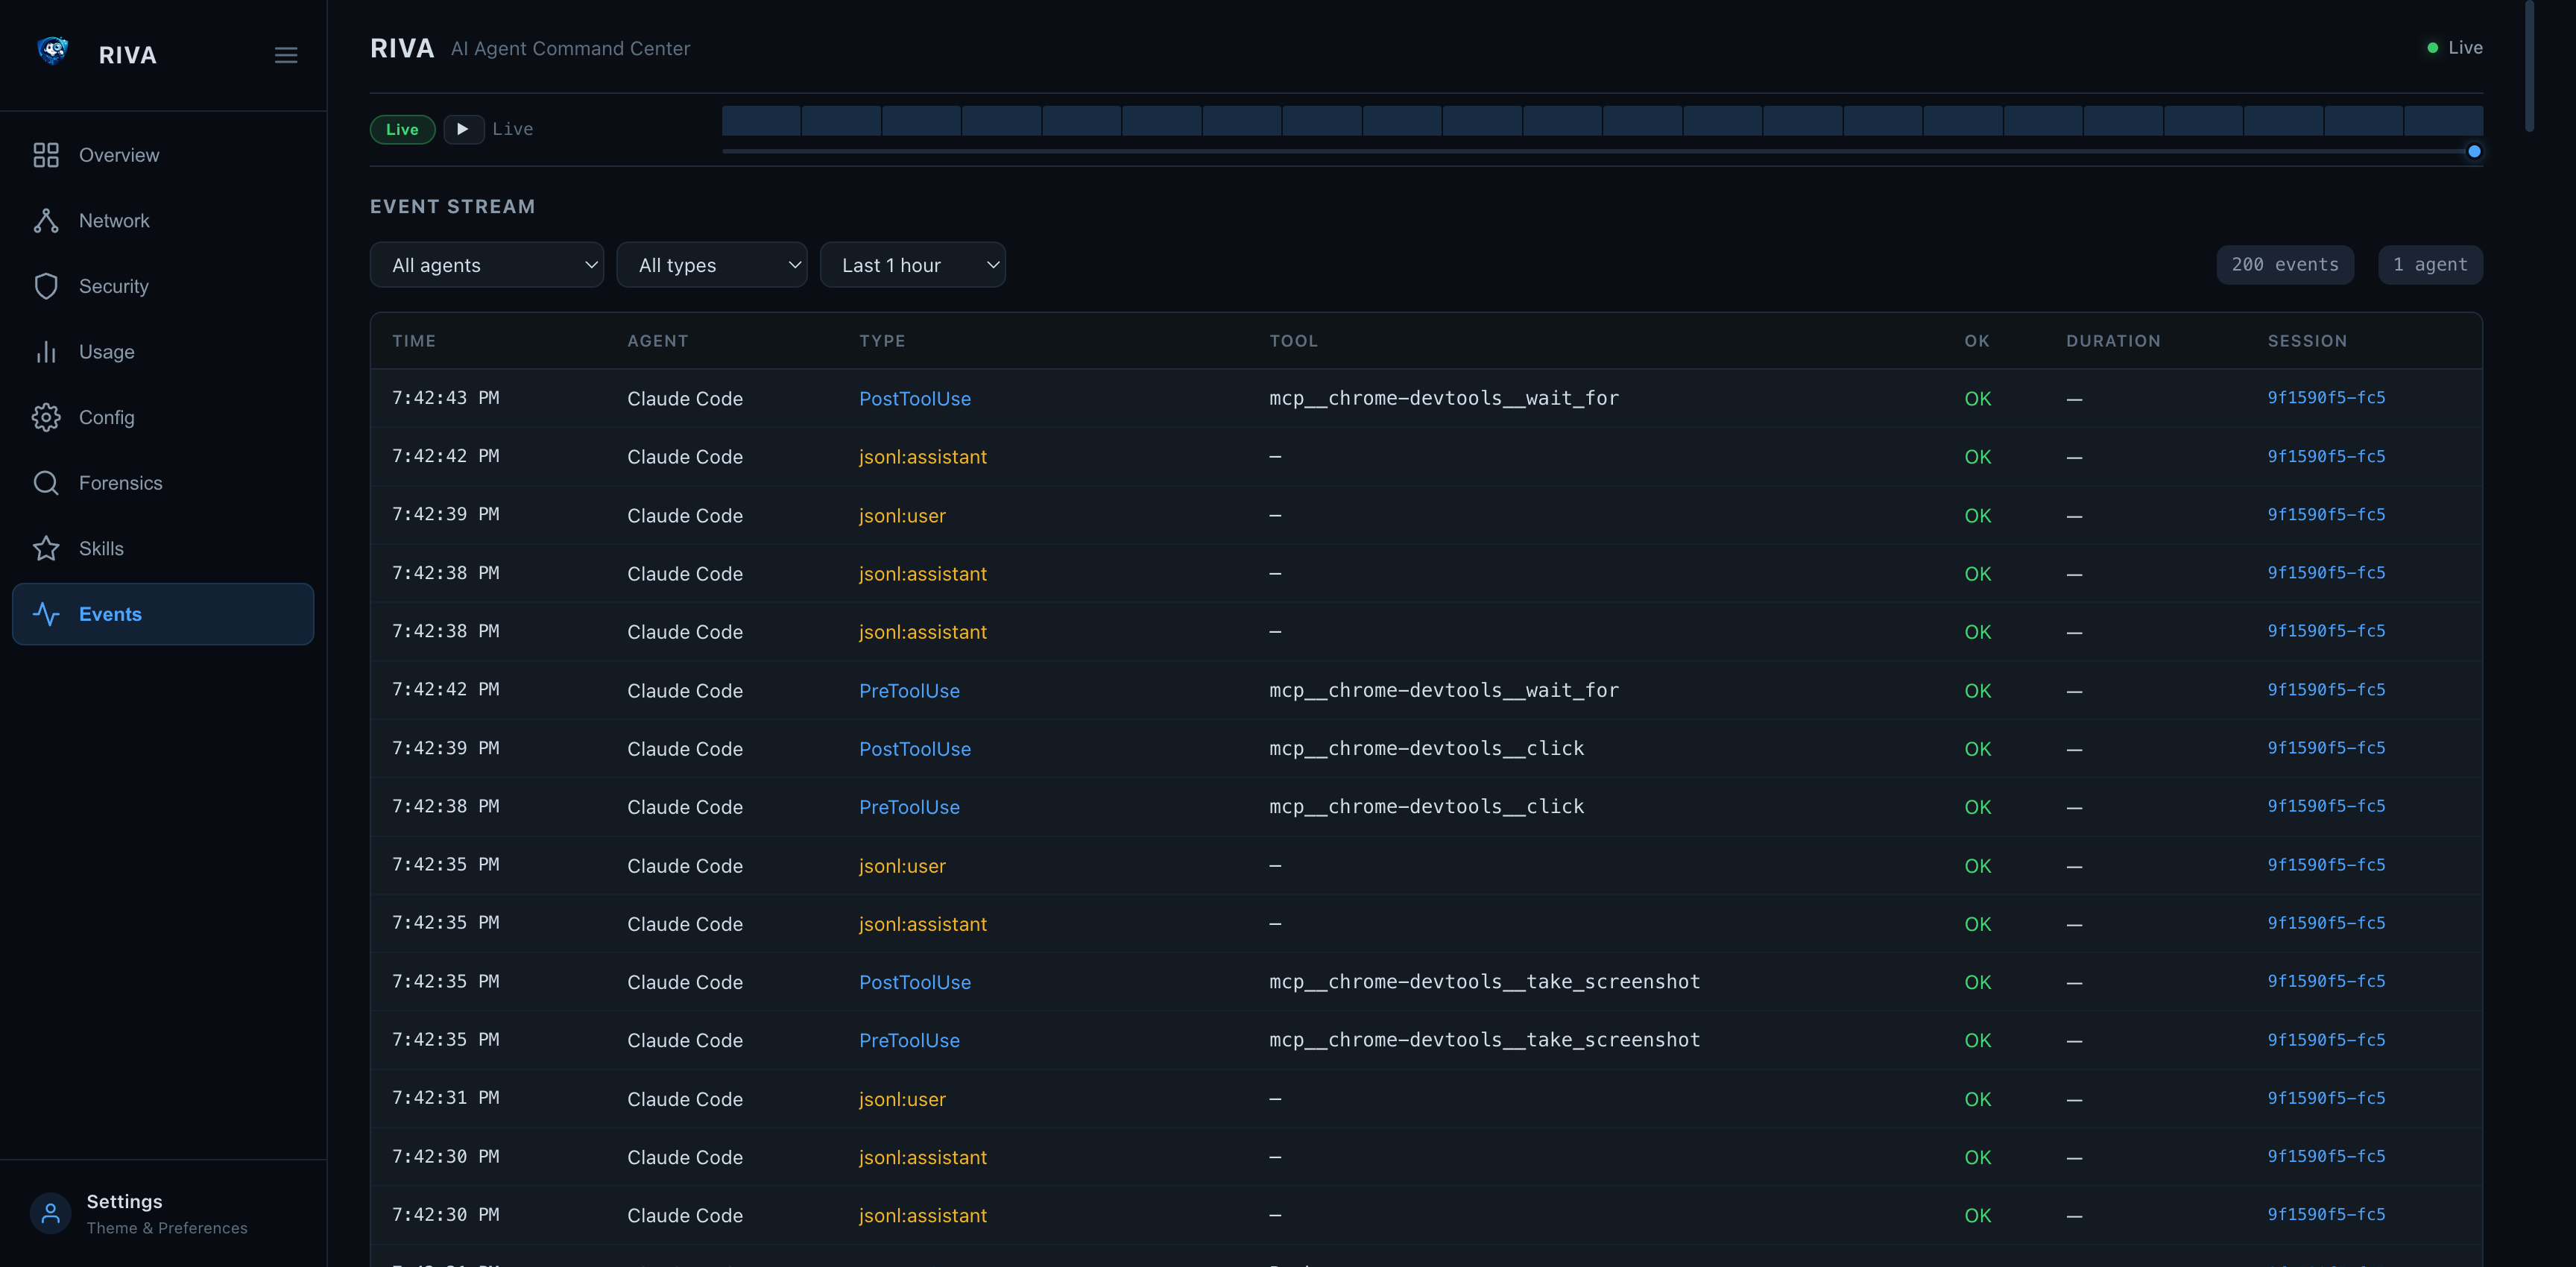
Event Stream — Real-time Tool-call Visibility
Riva v0.3.14 adds a unified event stream that captures every tool call, session lifecycle event, and agent action in real time. Three ingestion paths feed into one view:
Claude Code hooks ──→ POST /api/events ──→┐
JSONL tail-watching ──→ (automatic)  ──→  ├──→ hook_events table ──→ Events tab + API
OTLP receiver ──→ POST /otlp/v1/* ──→    ┘
1. Claude Code hooks (push — real-time)
Every PreToolUse, PostToolUse, SessionStart, SubagentStop, and Stop event is pushed to Riva as it happens.
riva hooks install claude-code    # one-time setup
riva web start                    # start the server
# Use Claude Code normally — events appear instantly
2. JSONL tail-watching (automatic — no setup)
Riva watches ~/.claude/projects/**/*.jsonl and ~/.cursor/projects/**/*.jsonl for new lines every 5 seconds. No configuration needed — if the Riva server or TUI is running, tailing is active.
Events appear as jsonl:tool_use, jsonl:tool_result, jsonl:assistant, jsonl:user, etc.
3. OTLP receiver (push — any OTel agent)
Any agent instrumented with the OpenTelemetry SDK can push traces, metrics, and logs directly to Riva:
# From curl
curl -X POST http://127.0.0.1:8585/otlp/v1/traces \
  -H "Content-Type: application/json" \
  -d '{"resourceSpans":[{"resource":{"attributes":[{"key":"service.name","value":{"stringValue":"my-agent"}}]},"scopeSpans":[{"spans":[{"traceId":"abc","spanId":"def","name":"search","startTimeUnixNano":"1712859232000000000","attributes":[]}]}]}]}'
# From Python — point any OTel exporter at Riva
from opentelemetry.exporter.otlp.proto.http.trace_exporter import OTLPSpanExporter
exporter = OTLPSpanExporter(endpoint="http://127.0.0.1:8585/otlp/v1/traces")
Events appear as otlp:trace, otlp:metric, otlp:log.
Viewing events
Web dashboard — click the Events tab in the sidebar:
- Filter by agent, event type, or time range
- Auto-refreshes every 3 seconds
- Click any session ID to jump to the forensic session detail
TUI — press 3 or e in riva watch for the Events tab.
API — query events programmatically:
# All events from the last hour
curl "http://127.0.0.1:8585/api/events?hours=1&limit=100"

# Filter by agent
curl "http://127.0.0.1:8585/api/events?agent=Claude+Code"

# Filter by type
curl "http://127.0.0.1:8585/api/events?type_prefix=otlp"
curl "http://127.0.0.1:8585/api/events?type_prefix=jsonl"
Events → Forensics deep-link
Clicking a session ID in the event stream navigates directly to the Forensics tab with the full session analysis:
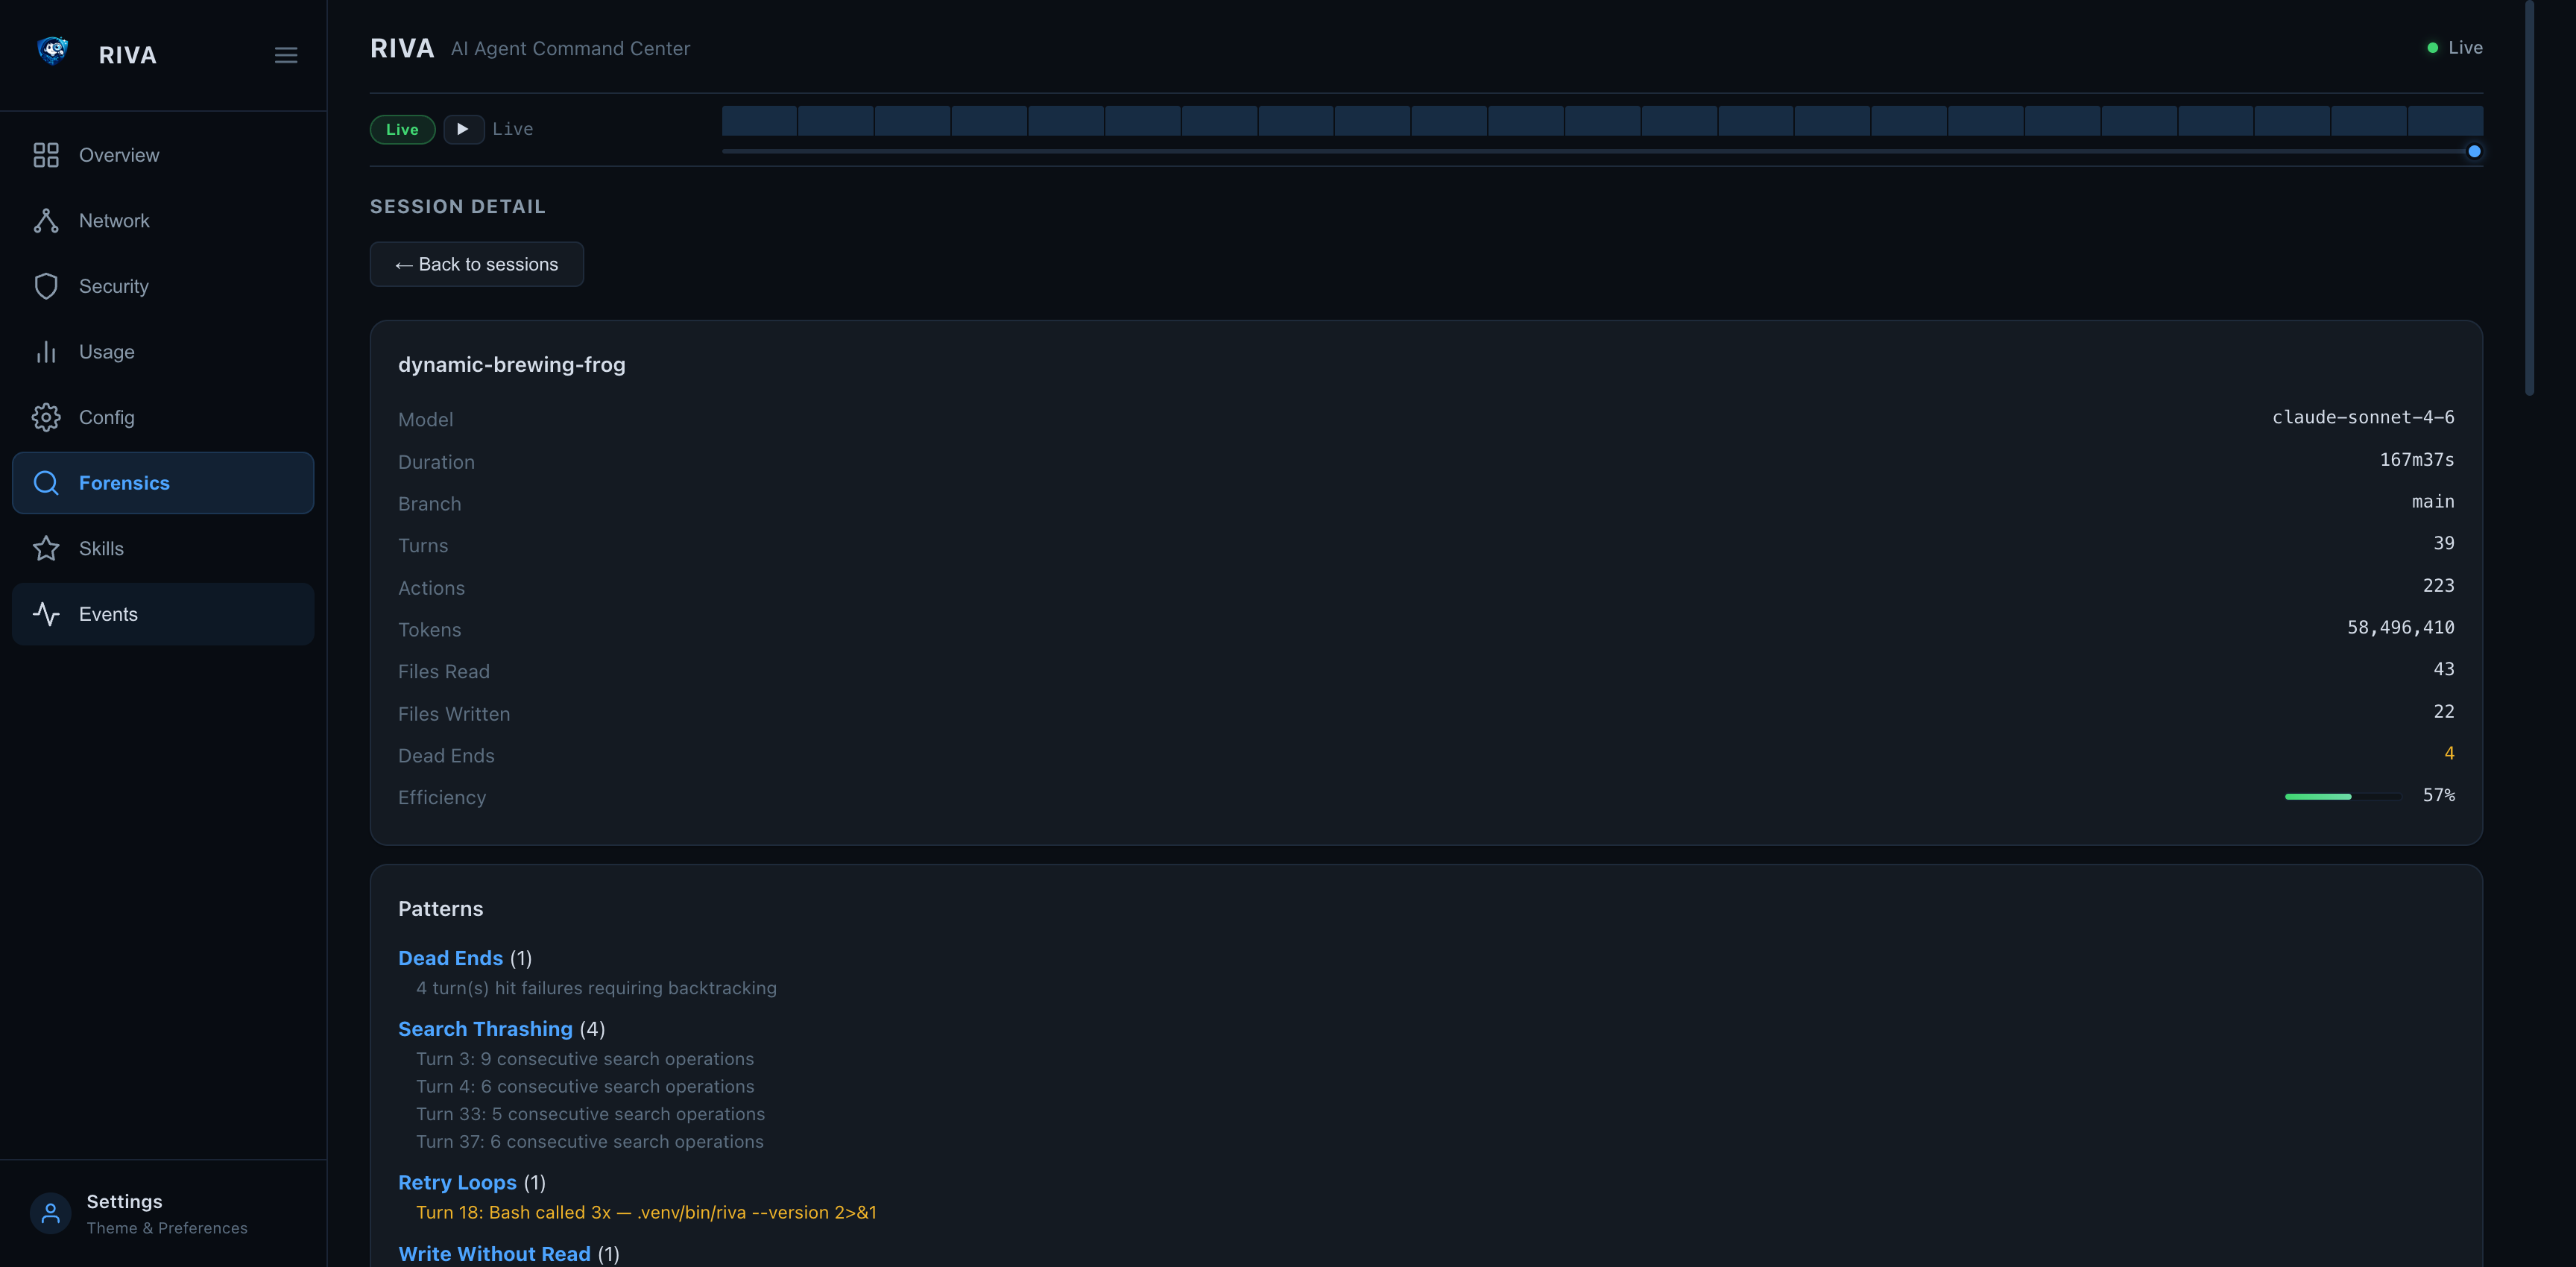
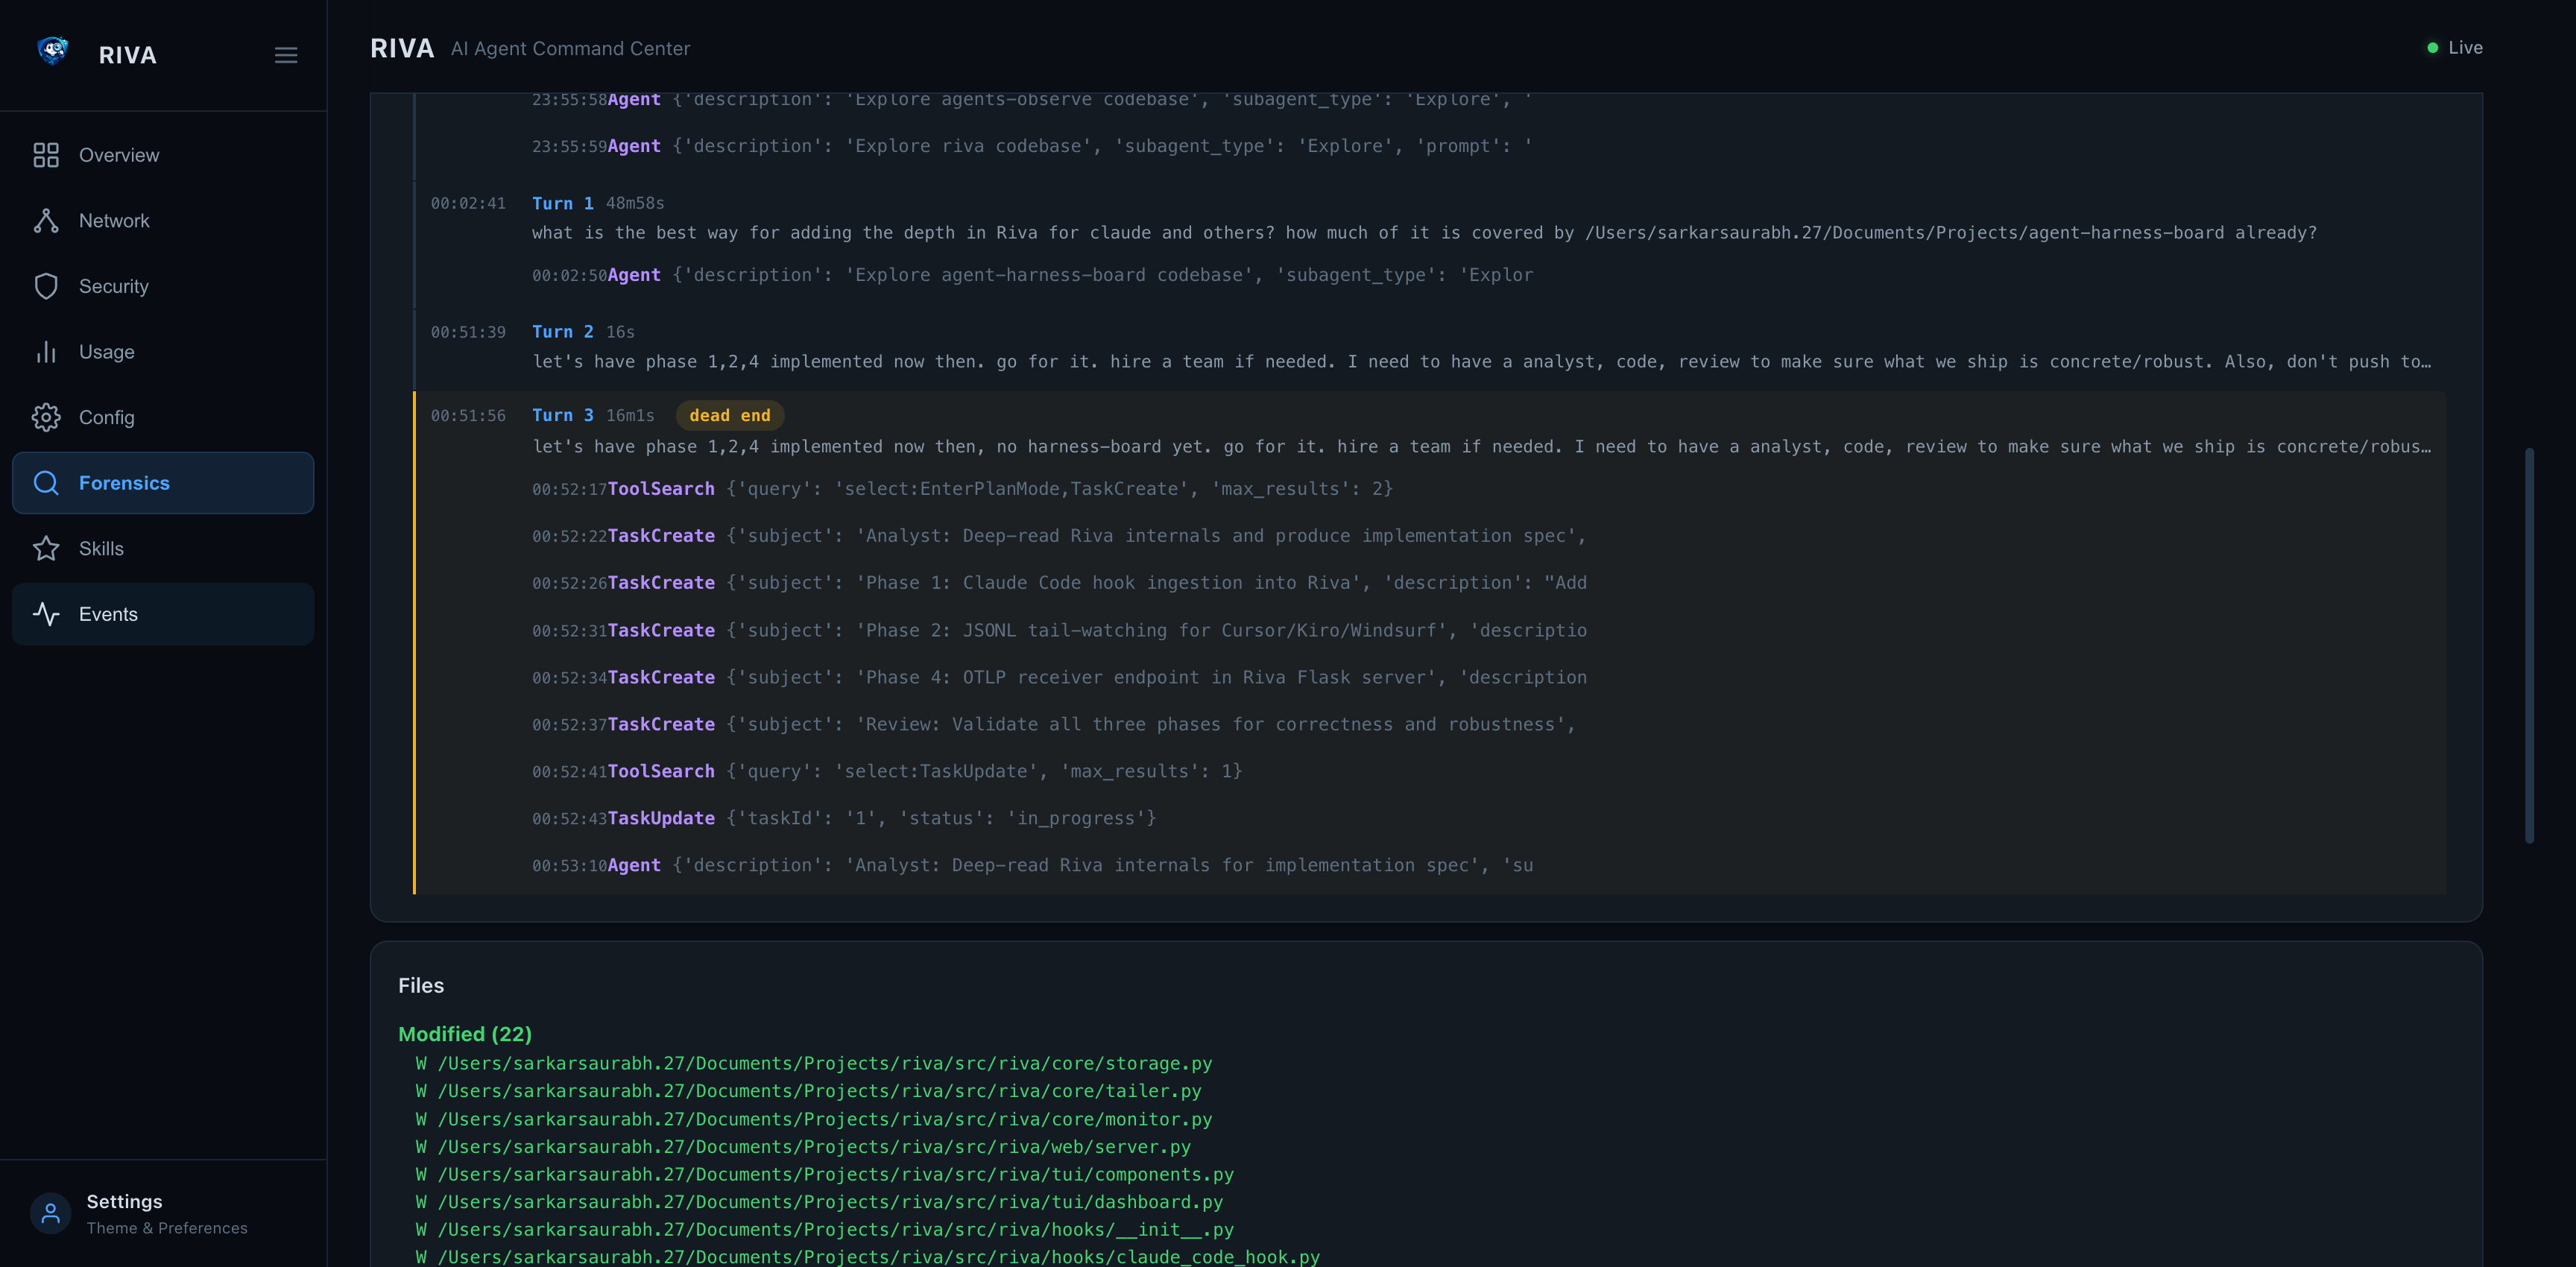
| Forensic Session Summary | Forensic Timeline |
|---|---|
|
|
The forensic view shows:
- Summary — model, duration, turns, tokens, efficiency score
- Patterns — dead ends, search thrashing, retry loops, write-without-read
- Timeline — every turn with prompt, tool calls, duration, and success/failure
- Files — all files read and written during the session
- Decisions — key decision points with reasoning previews
riva otel
OpenTelemetry export — push metrics, logs, and traces to any OTel-compatible backend.
OpenTelemetry is included with pip install riva — no extra install needed.
riva otel status                            # Show SDK availability and config
riva otel status --json                     # JSON output
riva otel export-sessions                   # Export forensic sessions as traces
riva otel export-sessions --limit 5         # Limit session count
riva otel export-sessions --project myapp   # Filter by project
Configuration via .riva/config.toml:
[otel]
enabled = true
endpoint = "http://localhost:4318"
protocol = "http"
service_name = "riva"
export_interval = 5.0
metrics = true
logs = true
traces = false

[otel.headers]
Authorization = "Bearer <token>"
Or via environment variables: OTEL_EXPORTER_OTLP_ENDPOINT, OTEL_SERVICE_NAME, RIVA_OTEL_ENABLED.
OpenTelemetry Observability
Riva exports all three OTel signals — metrics, logs, and traces — to any OTLP-compatible backend.
Quick Start with Grafana LGTM
# 1. Start the all-in-one Grafana stack (Loki + Grafana + Tempo + Mimir)
docker run -d --name otel-lgtm -p 4318:4318 -p 3000:3000 grafana/otel-lgtm

# 2. Install Riva (OTel support included)
pip install riva

# 3. Initialize workspace config (if not already done)
riva init

# 4. Enable OTel in .riva/config.toml
# [otel]
# enabled = true
# endpoint = "http://localhost:4318"
# metrics = true
# logs = true
# traces = true

# 5. Run a scan — metrics and logs are exported automatically
riva scan --otel

# 6. Export forensic session traces
riva otel export-sessions --limit 10

# 7. Import the bundled Grafana dashboard
curl -s -X POST http://localhost:3000/api/dashboards/db \
  -H 'Content-Type: application/json' \
  -u admin:admin \
  -d "{\"dashboard\": $(cat grafana-dashboard.json), \"overwrite\": true}"

# 8. Open Grafana at http://localhost:3000 (admin/admin)
Signals
| Signal | What it exports | Backend |
|---|---|---|
| Metrics | 8 observable gauges (CPU, memory, uptime, connections, child count, tree CPU, tree memory, running count) + 4 counters (scans, detected, stopped, audit findings) | Prometheus, Mimir, Datadog |
| Logs | Agent lifecycle events (detected/stopped) and audit findings with severity, category, and agent attributes | Loki, Elasticsearch, Datadog |
| Traces | Forensic sessions as span trees — session root → turn children → action grandchildren with tool names and durations | Tempo, Jaeger, Datadog |
Metric Names (OTel → Prometheus)
| OTel Name | Prometheus Name | Type | Labels |
|---|---|---|---|
riva.agents.running_count |
riva_agents_running_count |
Gauge | — |
riva.agent.cpu_percent |
riva_agent_cpu_percent |
Gauge | riva_agent_name, process_pid |
riva.agent.memory_mb |
riva_agent_memory_mb_mebibytes |
Gauge | riva_agent_name, process_pid |
riva.agent.uptime_seconds |
riva_agent_uptime_seconds |
Gauge | riva_agent_name, process_pid |
riva.agent.connection_count |
riva_agent_connection_count |
Gauge | riva_agent_name, process_pid |
riva.agent.child_count |
riva_agent_child_count |
Gauge | riva_agent_name, process_pid |
riva.agent.tree_cpu_percent |
riva_agent_tree_cpu_percent |
Gauge | riva_agent_name, process_pid |
riva.agent.tree_memory_mb |
riva_agent_tree_memory_mb_mebibytes |
Gauge | riva_agent_name, process_pid |
riva.scan.total |
riva_scan_total |
Counter | — |
riva.agent.detected_total |
riva_agent_detected_total |
Counter | riva_agent_name |
riva.agent.stopped_total |
riva_agent_stopped_total |
Counter | riva_agent_name |
riva.audit.finding_total |
riva_audit_finding_total |
Counter | riva_audit_check, riva_audit_status, riva_audit_severity, riva_audit_category |
Grafana Dashboard
A pre-built Grafana dashboard is included at grafana-dashboard.json. It provides 12 panels covering all three signals — stat panels, time series, log viewer, and trace table.
Environment Variables
| Variable | Description | Default |
|---|---|---|
RIVA_OTEL_ENABLED |
Enable/disable OTel export | false |
OTEL_EXPORTER_OTLP_ENDPOINT |
OTLP collector endpoint | http://localhost:4318 |
OTEL_SERVICE_NAME |
Service name in OTel resource | riva |
Boundary Policies
Configure continuous boundary monitoring via .riva/config.toml:
[boundary]
enabled = true
allowed_paths = []
denied_paths = ["~/.ssh/**", "~/.gnupg/**", "~/.aws/**"]
allowed_domains = ["api.anthropic.com", "api.openai.com"]
denied_domains = []
max_child_processes = 50
denied_process_names = ["nc", "ncat"]
deny_root = true
deny_unsandboxed = false
Boundaries are evaluated every poll cycle (default 2s). Violations fire the BOUNDARY_VIOLATION hook and are recorded in the tamper-evident audit log.
Web Dashboard
Start / Stop
riva web start                  # Background daemon
riva web start -f               # Foreground
riva web start --auth-token MY_SECRET   # With API auth
riva web stop                   # Stop daemon
riva web status                 # Check status
riva web logs                   # View logs
riva web logs -f                # Follow logs
Custom host and port
riva web --host 0.0.0.0 --port 9090 start
A warning is printed when binding to a non-localhost address.
API endpoints
| Endpoint | Description |
|---|---|
GET / |
HTML dashboard |
GET /api/agents |
Running agents (fast poll) |
GET /api/agents/history |
CPU/memory history |
GET /api/stats |
Token usage stats (cached 30s) |
GET /api/env |
Environment variables |
GET /api/registry |
Known agent types |
GET /api/config |
Agent configurations |
GET /api/forensic/sessions |
Forensic session list (cached 30s) |
GET /api/forensic/session/<id> |
Full parsed session detail |
GET /api/forensic/trends |
Cross-session aggregate trends (cached 30s) |
GET /api/skills |
All skills with forensic stats (cached 30s) |
POST /api/events |
Ingest a hook event from any agent adapter |
GET /api/events |
Query hook events (?agent=, ?session=, ?type_prefix=, ?hours=, ?limit=) |
POST /otlp/v1/traces |
OTLP trace receiver (protobuf or JSON) |
POST /otlp/v1/metrics |
OTLP metrics receiver (protobuf or JSON) |
POST /otlp/v1/logs |
OTLP log receiver (protobuf or JSON) |
POST /api/events — event ingestion schema
{
  "agent_name": "Claude Code",
  "session_id": "550e8400-e29b-41d4-a716-446655440000",
  "event_type": "PostToolUse",
  "timestamp": 1712859232.5,
  "tool_name": "Bash",
  "tool_input": { "command": "pytest tests/ -x" },
  "tool_output": "5 passed in 0.4s",
  "success": true,
  "duration_ms": 412,
  "metadata": {}
}
OTLP receiver — configure any OTel SDK
# Python — opentelemetry-sdk
from opentelemetry.sdk.trace import TracerProvider
from opentelemetry.exporter.otlp.proto.http.trace_exporter import OTLPSpanExporter
from opentelemetry.sdk.trace.export import BatchSpanProcessor

provider = TracerProvider()
provider.add_span_processor(
    BatchSpanProcessor(OTLPSpanExporter(endpoint="http://127.0.0.1:8585/otlp/v1/traces"))
)
Authentication
When started with --auth-token, all /api/* and /otlp/* routes require an Authorization: Bearer <token> header. The index page (/) remains accessible without authentication.
# Start with auth
riva web start --auth-token secret123

# Access API
curl -H "Authorization: Bearer secret123" http://127.0.0.1:8585/api/agents

# OTLP with auth (set in your OTel SDK)
OTEL_EXPORTER_OTLP_HEADERS="Authorization=Bearer secret123" your-agent
Security headers
All responses include:
X-Content-Type-Options: nosniffX-Frame-Options: DENYContent-Security-Policy: default-src 'self' 'unsafe-inline'X-XSS-Protection: 1; mode=blockReferrer-Policy: strict-origin-when-cross-origin
Security
- Runs locally — no network exposure by default
- Web dashboard binds to
127.0.0.1by default - Non-localhost binding triggers a visible warning
- Optional bearer token auth for the web API
- Security headers on all HTTP responses
riva auditperforms 15+ automated security checks (see below)- No agent execution privileges — read-only observation
See SECURITY.md for the full security policy.
Security Audit Details
riva audit runs a comprehensive set of checks designed to catch real-world threats to local AI agent deployments. Each check below links to supporting evidence for why it matters.
Credential & Token Exposure
| Check | What it does | Why it matters |
|---|---|---|
| API Key Exposure | Scans environment variables for keys, tokens, and secrets | GitHub found 39M+ leaked secrets in 2024 alone |
| Plaintext Token Scan | Scans agent config files for 14 token patterns (sk-, ghp_, AKIA, AIza, sk-ant-, eyJ, hf_, gsk_, etc.) |
API keys stored in plaintext config files are a top credential exposure vector (OWASP A07:2021) |
Covered config files per agent: settings.json, config.json, mcp.json, .env, config.toml (Codex CLI), config.ts (Continue.dev), OAI_CONFIG_LIST (AutoGen), langgraph.json (LangGraph), mcp_config.json (Windsurf). Also scans VS Code extension directories (Cline, Copilot, Continue) and macOS Application Support paths.
Permissions
| Check | What it does | Why it matters |
|---|---|---|
| Config Directory Permissions | Flags config dirs readable by group/other | Other local users or malware can read API keys and session data |
| Config File Permissions | Checks individual config files for mode & 0o077 |
Per-file permission hardening — a directory can be safe while files inside are over-permissioned |
| Binary Permissions | Flags agent binaries that are group/world-writable | A writable binary can be replaced with a trojan — classic binary planting |
| Plugin Directory | Flags existence and permissions of ~/.config/riva/plugins/ |
Plugin directories are arbitrary code execution surfaces |
Process Safety
| Check | What it does | Why it matters |
|---|---|---|
| Running as Root | Flags agent processes with UID 0 | AI agents should follow principle of least privilege — root agents can access any file or process |
| Suspicious Launcher | Flags unknown launch types or script-interpreter parents (python, node) |
Unexpected parent processes may indicate process injection or unauthorized agent execution |
| Orphan Processes | Detects agent child processes whose parent has died | Orphaned agent processes continue consuming resources and may hold open API connections |
MCP (Model Context Protocol) Supply Chain
| Check | What it does | Why it matters |
|---|---|---|
| MCP HTTP Endpoints | Flags MCP servers using http:// instead of https:// |
Unencrypted MCP connections expose tool calls and responses to network sniffing (Invariant Labs MCP security research) |
| MCP Shell Commands | Flags MCP servers whose stdio command is bash, sh, cmd, etc. |
Shell-based MCP servers enable arbitrary command execution via prompt injection |
| MCP Temp Dir References | Flags MCP server commands or args referencing /tmp/ |
Temp directories are world-writable — MCP binaries there can be swapped by any local user |
Scans 6 well-known MCP config paths plus dynamically discovered mcp.json/mcp_config.json in every installed agent's config directory.
Network (with --network flag)
| Check | What it does | Why it matters |
|---|---|---|
| Unencrypted Connections | Flags connections to known API domains on non-443 ports | API traffic should always be TLS-encrypted |
| Unknown Destinations | Flags ESTABLISHED connections to unrecognized hosts | May indicate data exfiltration or unauthorized API calls |
| Excessive Connections | Flags agents with >50 active connections | Possible connection leak or C2 beaconing |
| Stale Sessions | Flags CLOSE_WAIT/TIME_WAIT connections | Connection cleanup failures waste resources and may indicate issues |
Dashboard
| Check | What it does | Why it matters |
|---|---|---|
| Dashboard Status | Warns when the web dashboard is running | A running dashboard is an attack surface — verify it's not exposed to the network |
Architecture
src/riva/
├── agents/              # Agent detection and parsing
│   ├── base.py          # AgentInstance, AgentStatus, BaseDetector
│   ├── registry.py      # Agent registry
│   ├── claude_code.py   # Claude Code detector
│   ├── codex_cli.py     # Codex CLI detector
│   ├── gemini_cli.py    # Gemini CLI detector
│   ├── openclaw.py      # OpenClaw detector
│   ├── langgraph.py     # LangGraph / LangChain detector
│   ├── crewai.py        # CrewAI detector
│   └── autogen.py       # AutoGen detector
├── core/                # Core logic
│   ├── audit.py         # Security audit checks
│   ├── audit_log.py     # Tamper-evident JSONL audit log (HMAC chain)
│   ├── boundary.py      # Continuous boundary policy engine
│   ├── env_scanner.py   # Environment variable scanning
│   ├── forensic.py      # Session forensics (timeline, patterns, decisions)
│   ├── monitor.py       # Resource monitoring (CPU, memory)
│   ├── sandbox.py       # Sandbox / container detection
│   ├── scanner.py       # Process scanning
│   └── usage_stats.py   # Token/tool usage parsing
├── otel/                # OpenTelemetry exporter
│   ├── config.py        # OTel configuration loading
│   ├── metrics.py       # Metrics exporter (gauges, counters)
│   ├── logs.py          # Logs exporter (audit, lifecycle)
│   ├── traces.py        # Traces exporter (forensic sessions)
│   └── exporter.py      # Main coordinator
├── tray/                # System tray (macOS)
│   ├── manager.py       # Swift binary compilation, spawn, IPC
│   ├── daemon.py        # Background daemon management (PID, start/stop)
│   ├── run.py           # Daemon subprocess entry point
│   └── tray_mac.swift   # Native macOS NSStatusBar app
├── tui/                 # Terminal UI (Rich)
│   ├── components.py    # Rich table builders
│   └── dashboard.py     # Live dashboard
├── web/                 # Flask web dashboard
│   ├── server.py        # Flask app, REST API, security middleware
│   └── daemon.py        # Background daemon management
├── utils/               # Shared utilities
│   ├── formatting.py    # Display formatting helpers
│   └── jsonl.py         # JSONL file parsing
└── cli.py               # Click CLI entry points
Riva is modular by design.
New agent detectors can be added without changing the core.
Development
Setup
git clone https://github.com/sarkar-ai-taken/riva.git
cd riva
python -m venv .venv
source .venv/bin/activate
pip install -e ".[test]"
Running tests
pytest                                    # All tests
pytest --cov=riva --cov-report=term-missing  # With coverage
pytest tests/test_cli.py                  # Specific file
Linting
pip install ruff
ruff check src/ tests/
ruff format --check src/ tests/
Type checking
pip install mypy types-psutil
mypy src/riva/ --ignore-missing-imports
Release Process
- Update version in
pyproject.toml - Update
HISTORY.mdwith changes - Run full test suite:
pytest --cov=riva - Build the package:
python -m build - Verify:
twine check dist/* - Create a git tag:
git tag v0.x.x - Push with tags:
git push --tags - Create a GitHub Release — this triggers automatic PyPI publishing
Manual publish (if needed)
python -m build
twine upload dist/*
Uninstall
If you installed Claude Code hooks, remove them first:
riva hooks uninstall --all      # remove hook entries from ~/.claude/settings.json
riva web stop                   # stop the web daemon if running
pip uninstall riva
Without riva hooks uninstall, the hook entries remain in ~/.claude/settings.json. They're harmless (the hook script fails silently when Riva isn't installed) but leave orphaned config. Clean them up manually if needed:
# Manual cleanup (if you already uninstalled without removing hooks)
python3 -c "
import json; p = __import__('pathlib').Path.home() / '.claude/settings.json'
d = json.loads(p.read_text())
h = d.get('hooks', {})
for ev in list(h):
    h[ev] = [e for e in h[ev] if not any('riva.hooks' in x.get('command','') for x in e.get('hooks',[]))]
    if not h[ev]: del h[ev]
p.write_text(json.dumps(d, indent=2))
print('Cleaned')
"
Or use the uninstall script:
curl -fsSL https://raw.githubusercontent.com/sarkar-ai-taken/riva/main/uninstall.sh | bash
Early Stage Project
Riva is early-stage and evolving rapidly.
Expect:
- Rapid iteration
- API changes
- Active design discussions
Feedback is highly encouraged — join the conversation on Discord.
Philosophy
If you cannot see what an agent is doing, you cannot trust it.
Riva exists to make local AI agents inspectable, understandable, and safe.
Contributing
We welcome contributions and design discussions.
- See CONTRIBUTING.md for guidelines
- Join the Discord for questions and discussion
License
MIT — see LICENSE for details.
Share
If you find Riva useful, feel free to share:
Yorumlar (0)
Yorum birakmak icin giris yap.
Yorum birakSonuc bulunamadi