Agent-FleetOps
Health Uyari
- License — License: MIT
- Description — Repository has a description
- Active repo — Last push 1 days ago
- Low visibility — Only 5 GitHub stars
Code Gecti
- Code scan — Scanned 12 files during light audit, no dangerous patterns found
Permissions Gecti
- Permissions — No dangerous permissions requested
Bu listing icin henuz AI raporu yok.
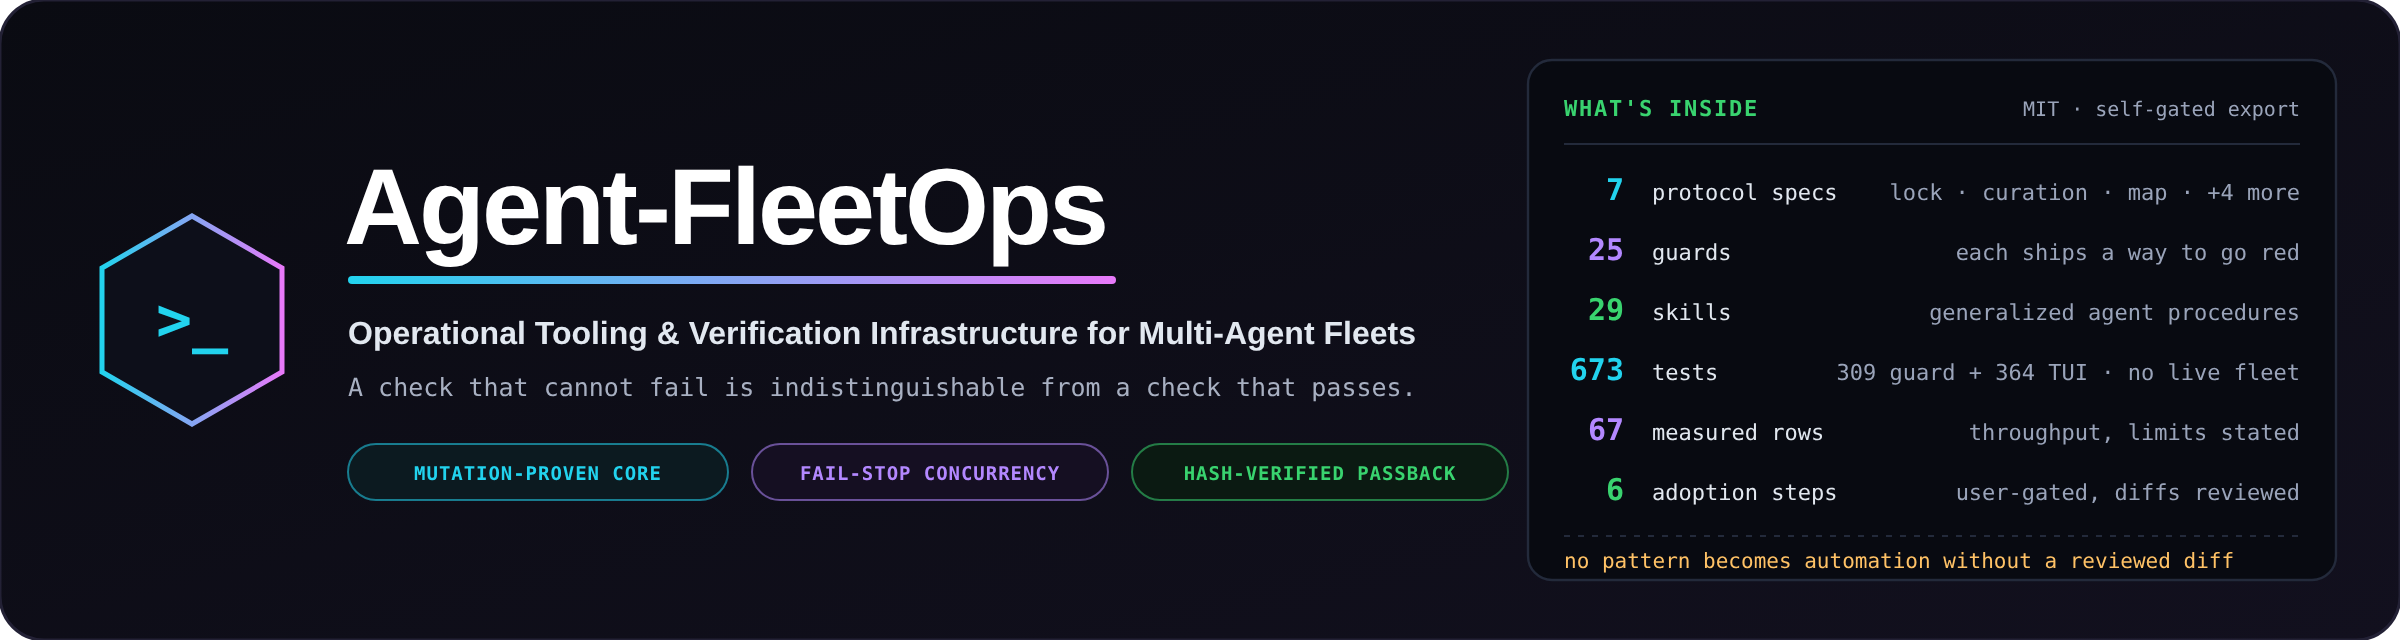
Operational tooling & discipline for multi-agent AI engineering fleets — mutation-proven guards, a 364-test fleet monitor, generalized skills, and specs. Every check ships with proof it can fail.
Agent-FleetOps
Custom multi-agent orchestration built from scratch (no CrewAI, LangGraph, or any framework). Counters off-the-shelf failure modes — error cascades, argument loops, unverified agent trust — with mutation-proven drift guards, deterministic apply, driver-lock serialization, and verifier-first review panels. Routing decisions are made against real measured throughput per hardware tier, via a multi-box telemetry pipeline whose data is in the repo — not vendor benchmarks. A ~380-test hermetic monitor proves every guard can fail. Validated in production via ParaKit
So you wanna run an AI Fleet without it turning into a hallucination circus? I've put together a generalized version of my collection of skills and tools, please use as you see fit. This is not prompt engineering, more like automatic babysitting. I hope it helps, if you like what I've put together, throw me a star and I'll keep updating as I improve on the design, thanks!
Pattern library for agent fleets: bind every check, count, and claim to a live target that can go red (fail).
It works on one box; the two-workstation setup that produced it is provenance, not a requirement.
The organizing idea, applied everywhere here:
A report that cannot fail is indistinguishable from a report that passed.
Bind every guard, test, count, path and status to a live target, and run the case that turns it red.Every model is a genie with a parser. FleetOps exists because “technically correct” is not the same thing as “what I actually wanted.”
This repo is a pattern library. You do not need two workstations.
Hand it to your AI: clone it, then paste the block under Set it up with your own AI; the agent records missing GPUs and CLIs as ABSENT.
Read it yourself: read the specs for the operating contracts; run the guards for checks that can go red.
Start with eval-integrity, generate-review-fix-loop, and model-routing-table; the minimum viable slice explains the rest.
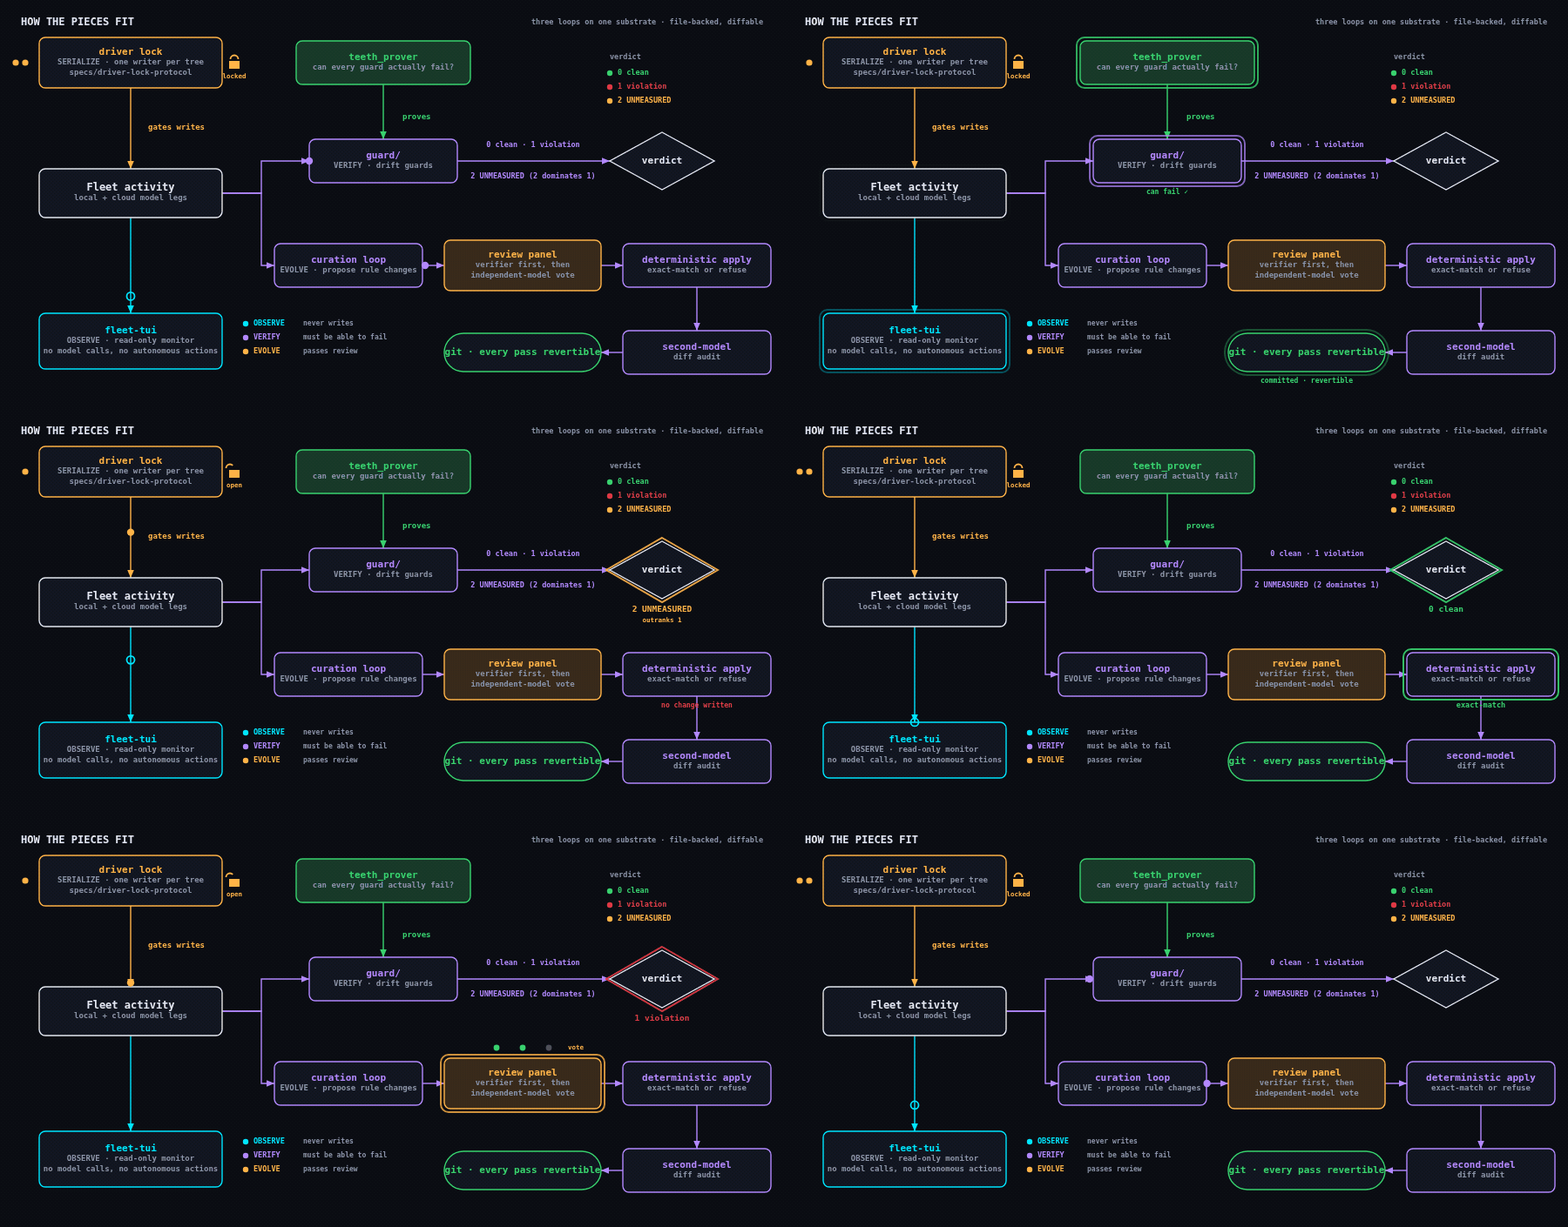
How the pieces fit
flowchart TD
    W["Fleet activity <br/>local + cloud model legs"] --> T["fleet-tui <br/>OBSERVE - read-only monitor <br/>no model calls, no autonomous actions"]
    L["driver lock <br/>SERIALIZE - one writer per tree <br/>(specs/driver-lock-protocol)"] -->|gates writes| W
    W --> G["guard/ <br/>VERIFY - drift guards"]
    TP["teeth_prover <br/>can every guard actually fail?"] -->|proves| G
    G -->|"0 clean / 1 violation / 2 UNMEASURED <br/>(2 dominates 1)"| V{verdict}
    W --> C["curation loop <br/>EVOLVE - propose rule changes"]
    C --> H["review panel <br/>verifier first, then independent-model vote"]
    H --> A["deterministic apply <br/>exact-match or refuse"] --> D["second-model diff audit"] --> R["(git - every pass revertible)"]
    style TP fill:#1a3a2a,stroke:#39d36f
    style H fill:#3a2a1a,stroke:#ffb347
Observation never mutates, writes serialize behind a lock, verification must be able to fail, and
evolution of the rules themselves passes a review panel (verifier first, then independent-model vote). The three loops share one substrate: recorded artifacts and rule changes are file-backed and
diffable. Git-tracked edits are revertible; model calls, live fleet activity, and external actions
(services, cron, shell hooks) need their own rollback.
That rule is enforced on this repository itself: the export pipeline's secret scanner and
never-publish wall-checker each carry planted-mutation self-tests, and both caught real defects in
their own first hour (a JSON-style key pattern gap; a hardcoded test that could never fail on
another machine). The commit history tells that story.
What's here
| Dir | Contents |
|---|---|
tui/ |
fleet-tui — a Textual terminal monitor for a local/cloud model fleet. 27 headless source modules (excluding __init__.py) behind a 386-test hermetic suite; strict one-way pipeline (pure readers → pure formatters → app), frozen dataclass contracts, safe-default degradation. CI runs the full suite on every push. |
skills/ |
Generalized agent-discipline procedures — evaluation integrity, model routing (the living-table method), the local-lane build loop, multi-agent code workflow, research dispatch/verification, memory ops, brain bookkeeping, protected-function guards, blocked-page retrieval, the should-we directive check (interrogate the premise before executing an imperative), and more. Each encodes failure stories from real operation. The portable start-list is in adopt/20_skills.md; you are not expected to install them all. |
templates/ |
Copyable dispatch, honesty, pinned-environment, and research-artifact patterns. Templates are adoption patterns, not automatic enforcement. |
_tools/ |
The export pipeline's own gates — provenance wall-checker, secrets/personal-data scanner, and a ref gate, all mutation-proven (--self-test). The first two ask "is this tree safe to publish?"; the third asks the question they structurally cannot: "what would a push actually publish?" A history rewrite is only true of the branch you rewrote — this repo's own rewrite left a clean main beside two leftover refs still carrying the trailers and build artifacts the rewrite removed, one push --all away from being republished. Content gates scan a worktree; pushes carry refs. |
guard/ + pipeline surfaces |
The drift-guard core — teeth-prover (every guard proven able to fail), contract-agreement across four vocabulary surfaces, 626 hermetic unit gates, and a sandboxing mutation harness that fail-closes without its measurement corpus, and the honesty stop hook in guard/ that blocks a turn asserting unmeasured live state. 2 = UNMEASURED dominates 1 = violation throughout. |
specs/ |
The multi-agent driver-lock protocol, the curation-loop architecture, the verified-system-map pattern, and the research-team, rigor-spectrum, and honesty-stop-gate guides. |
bench/ |
The two-box throughput operating log — 67 measurements over 22 model tags, with sample sizes and device labels attached. See below. |
fleet-tui, running
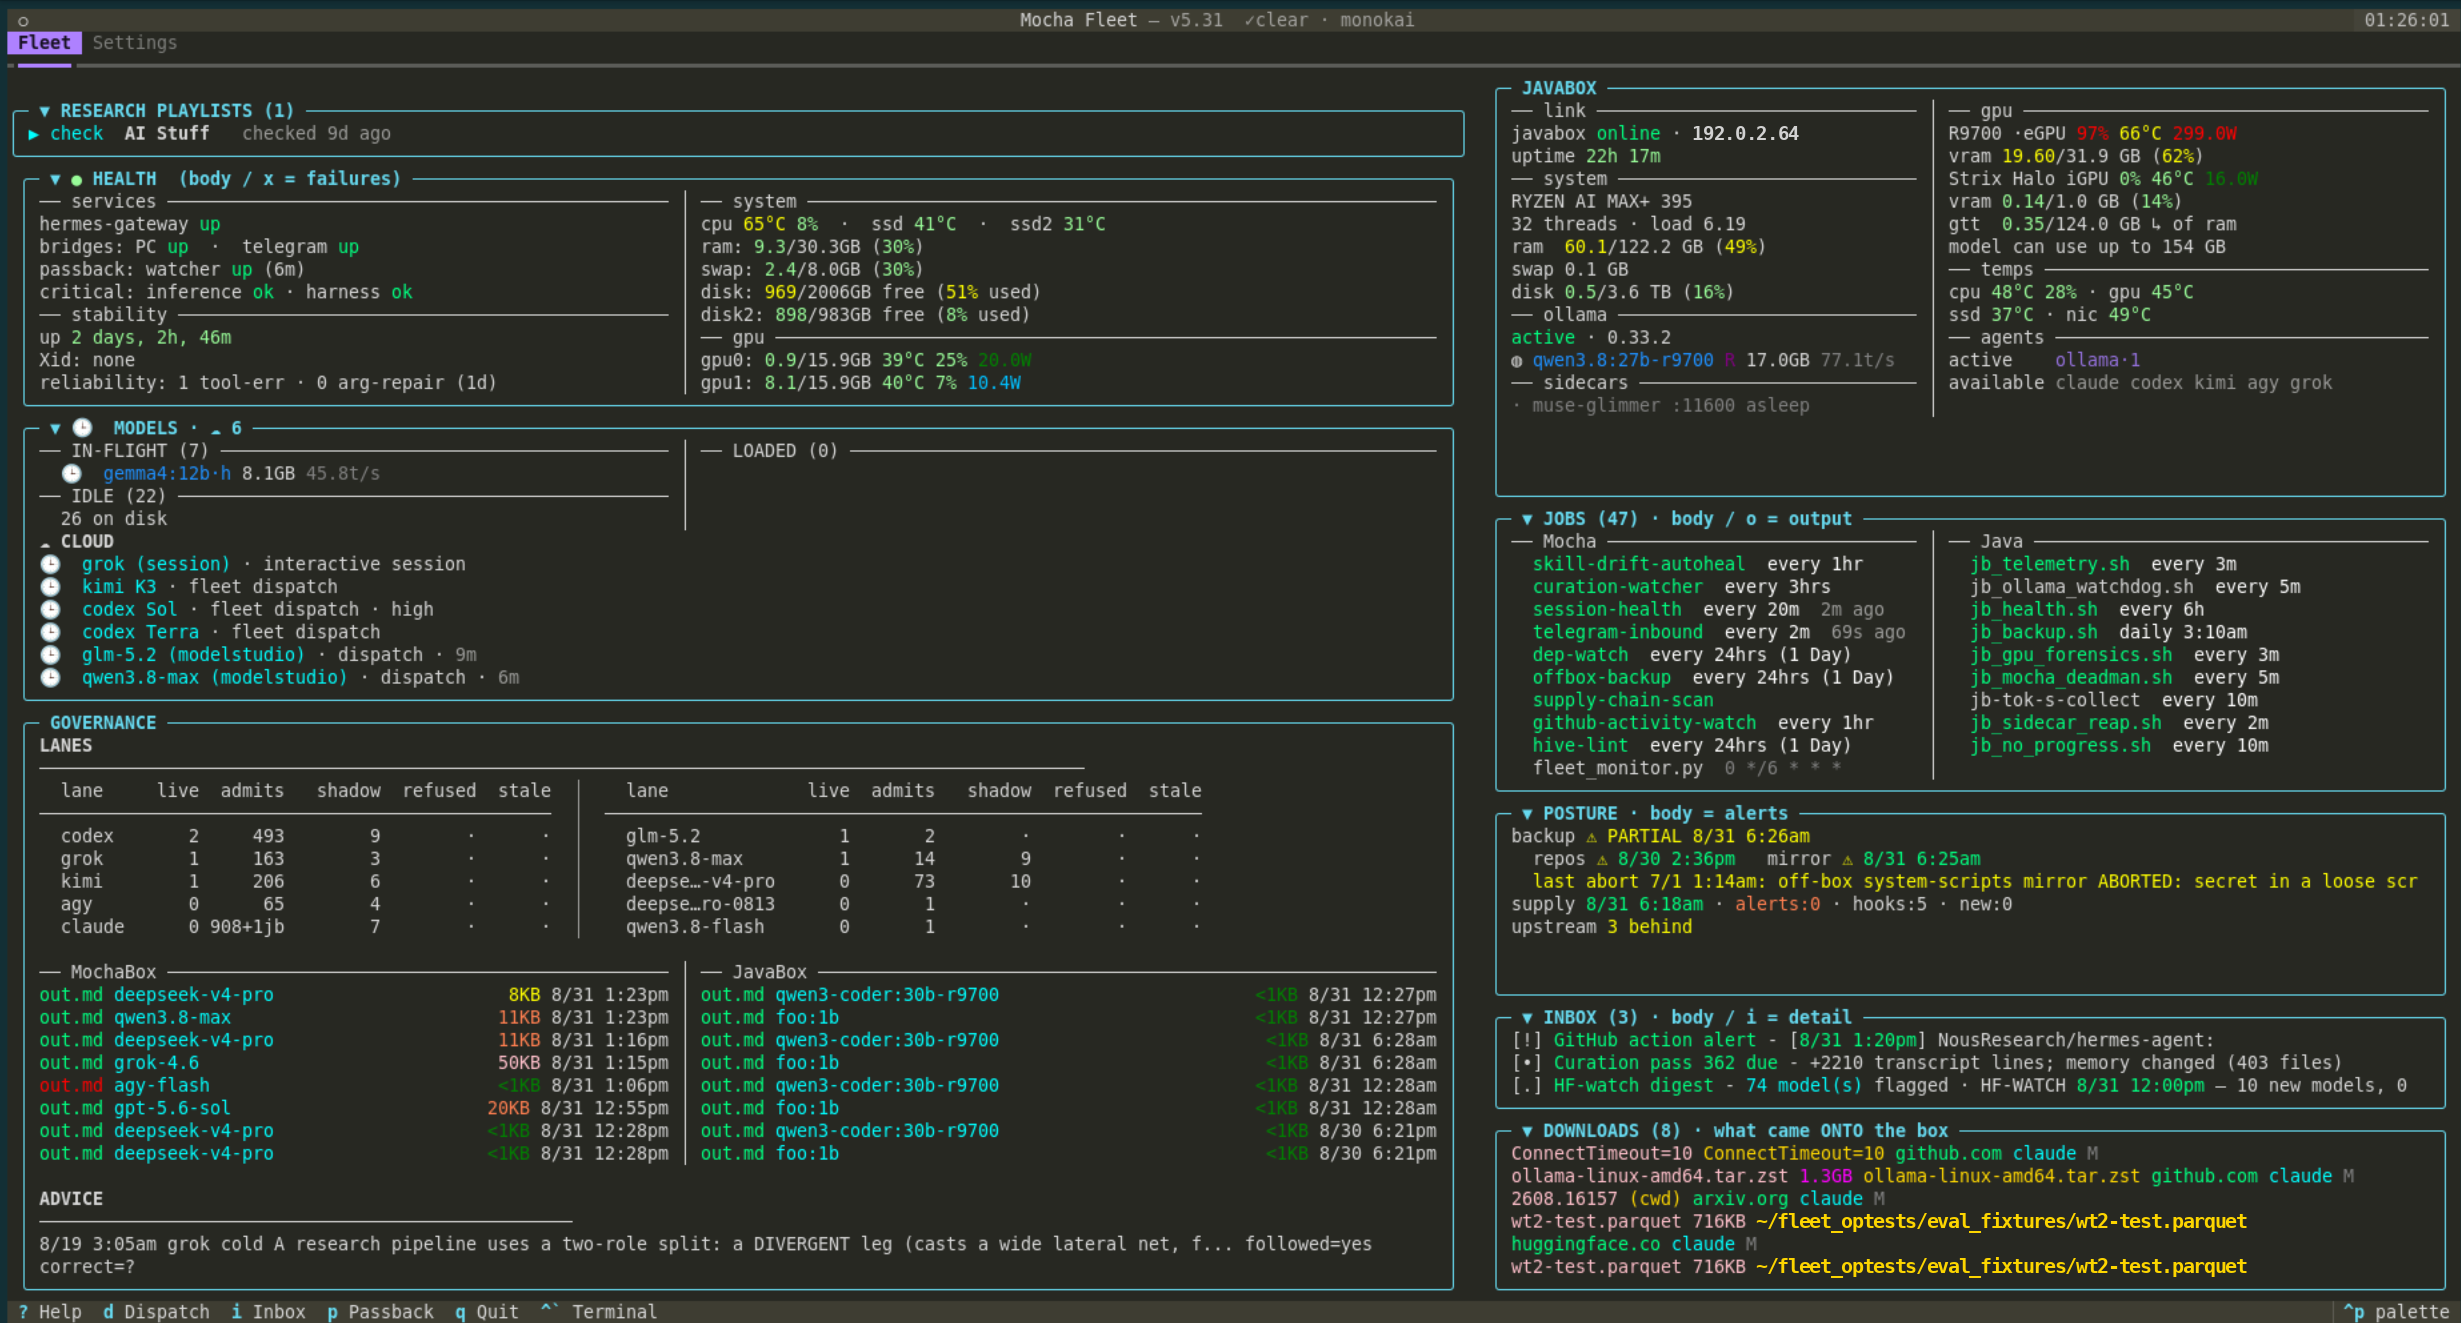
Authors' instance capture, including its roster names and box labels.
A live two-box fleet in one screen, in resizable collapsible cards. The left column is this box:
service and stability health beside CPU, disk and per-GPU readings; a model kanban splitting in-flight
from loaded and idle; the lane governance table carrying live, admitted, shadow, refused and stale
counts per provider; and the artifact receipts that every dispatch writes. The right column is the
second box over the LAN — its own CPU, memory and disk, both of its GPUs read separately, its thermals,
its ollama version and the model it is currently serving.
Two panels deliberately interleave the boxes instead of separating them. Receipts give each box its own
column, and the scheduled-jobs panel lists both crontabs side by side, so a job that exists on one box
and not the other is visible without diffing anything. The header stamps the running version, which is
how a relaunch proves it picked up fresh code rather than a cached build.
Worth noticing, because it is what the tool is for: the second box's discrete GPU is at 97% / 66°C /
299 W serving a 17 GB model at 77.1 tok/s — a live rate read off the running model, not a CSV cell;
the logged figures for that tag top out at 74.6 — while the integrated GPU on the same silicon sits at
0% / 46°C. Two devices, one box, wildly different states, both visible at a glance. Seven models are
in flight: one resident local model beside six cloud legs across four providers, each row naming the
work it was given. The lane table separates this box's 908 claude admits from the 1 attributed to the
second box, because a single pooled number hides which machine paid.
Nothing here is green-washed. The posture panel is carrying a PARTIAL backup, a stale repo, an aborted
mirror with the reason it aborted, and three dependencies behind upstream; the inbox holds three unread
items; and a research-advice row at the bottom left records a past consult with its outcome still marked
unknown. A monitor that only ever showed green would be the one worth distrusting.
The LAN address shown is a documentation placeholder; every reading is real and unretouched. The header stamps a newer in-house build than the tui/ sources exported here.
The same fleet from a phone
The shipped tui/serve.sh wrapper has no authentication and binds 127.0.0.1
(loopback only) by default. Install the TUI dependencies before running it. SetFLEET_TUI_SERVE_HOST=0.0.0.0 explicitly to bind all interfaces, and configure a
host firewall to admit only trusted clients. Add authenticated access before
allowing untrusted clients; this package does not install or verify those controls.
The phone captures below show my separate layout. It is the same data the
terminal shows, re-laid-out for a narrow screen: cards stack, the model kanban becomes sections, and
the wide tables scroll rather than truncate.
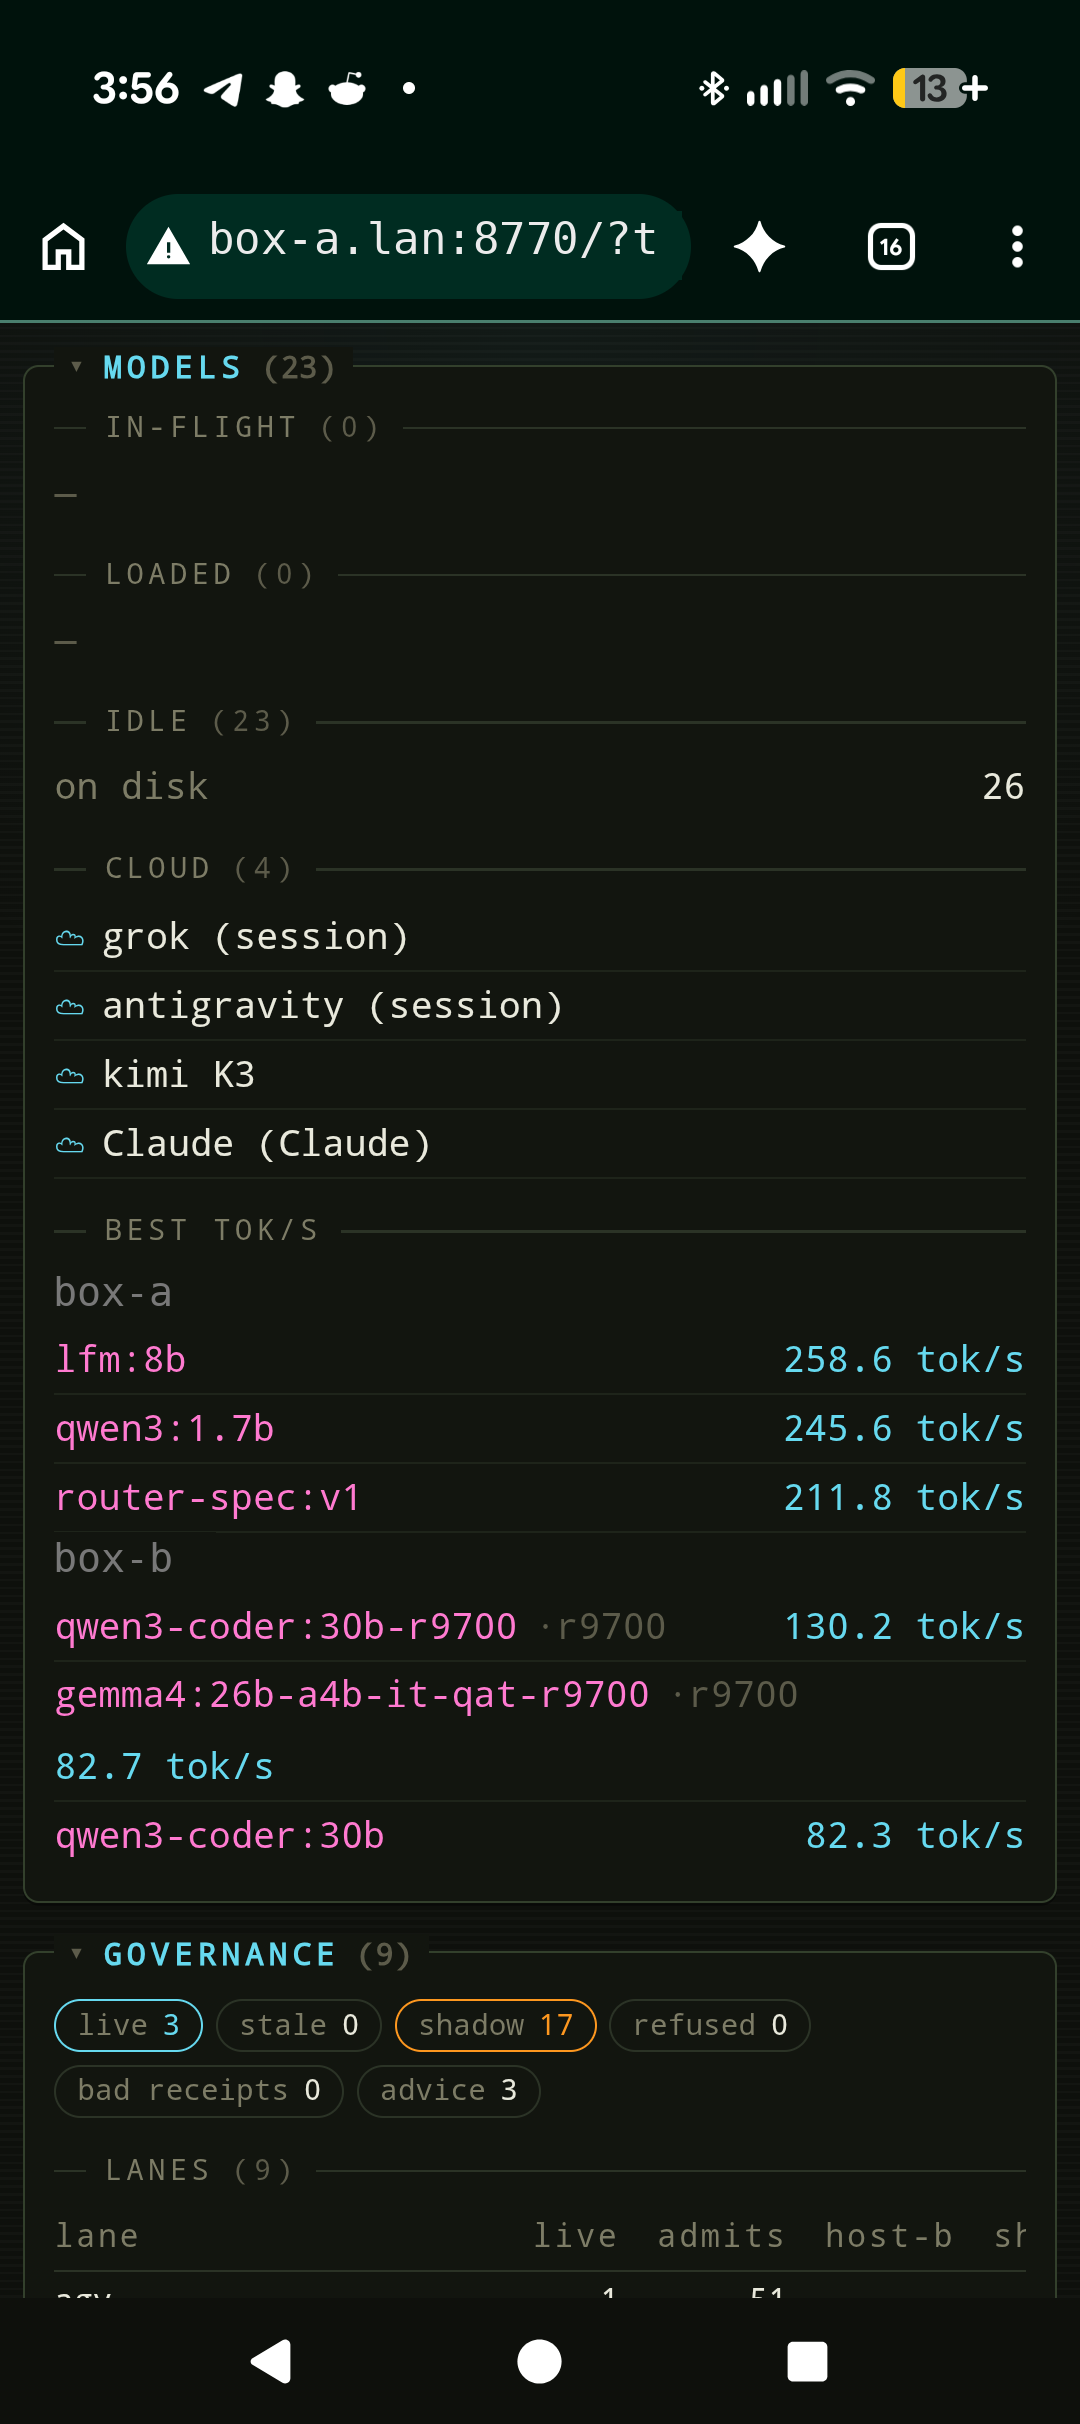
Local and cloud legs in one view. Twenty-three local model tags across two boxes, four cloud legs
in session, and the best measured rate per model per box — the same box-a / box-b split the
throughput log above uses.
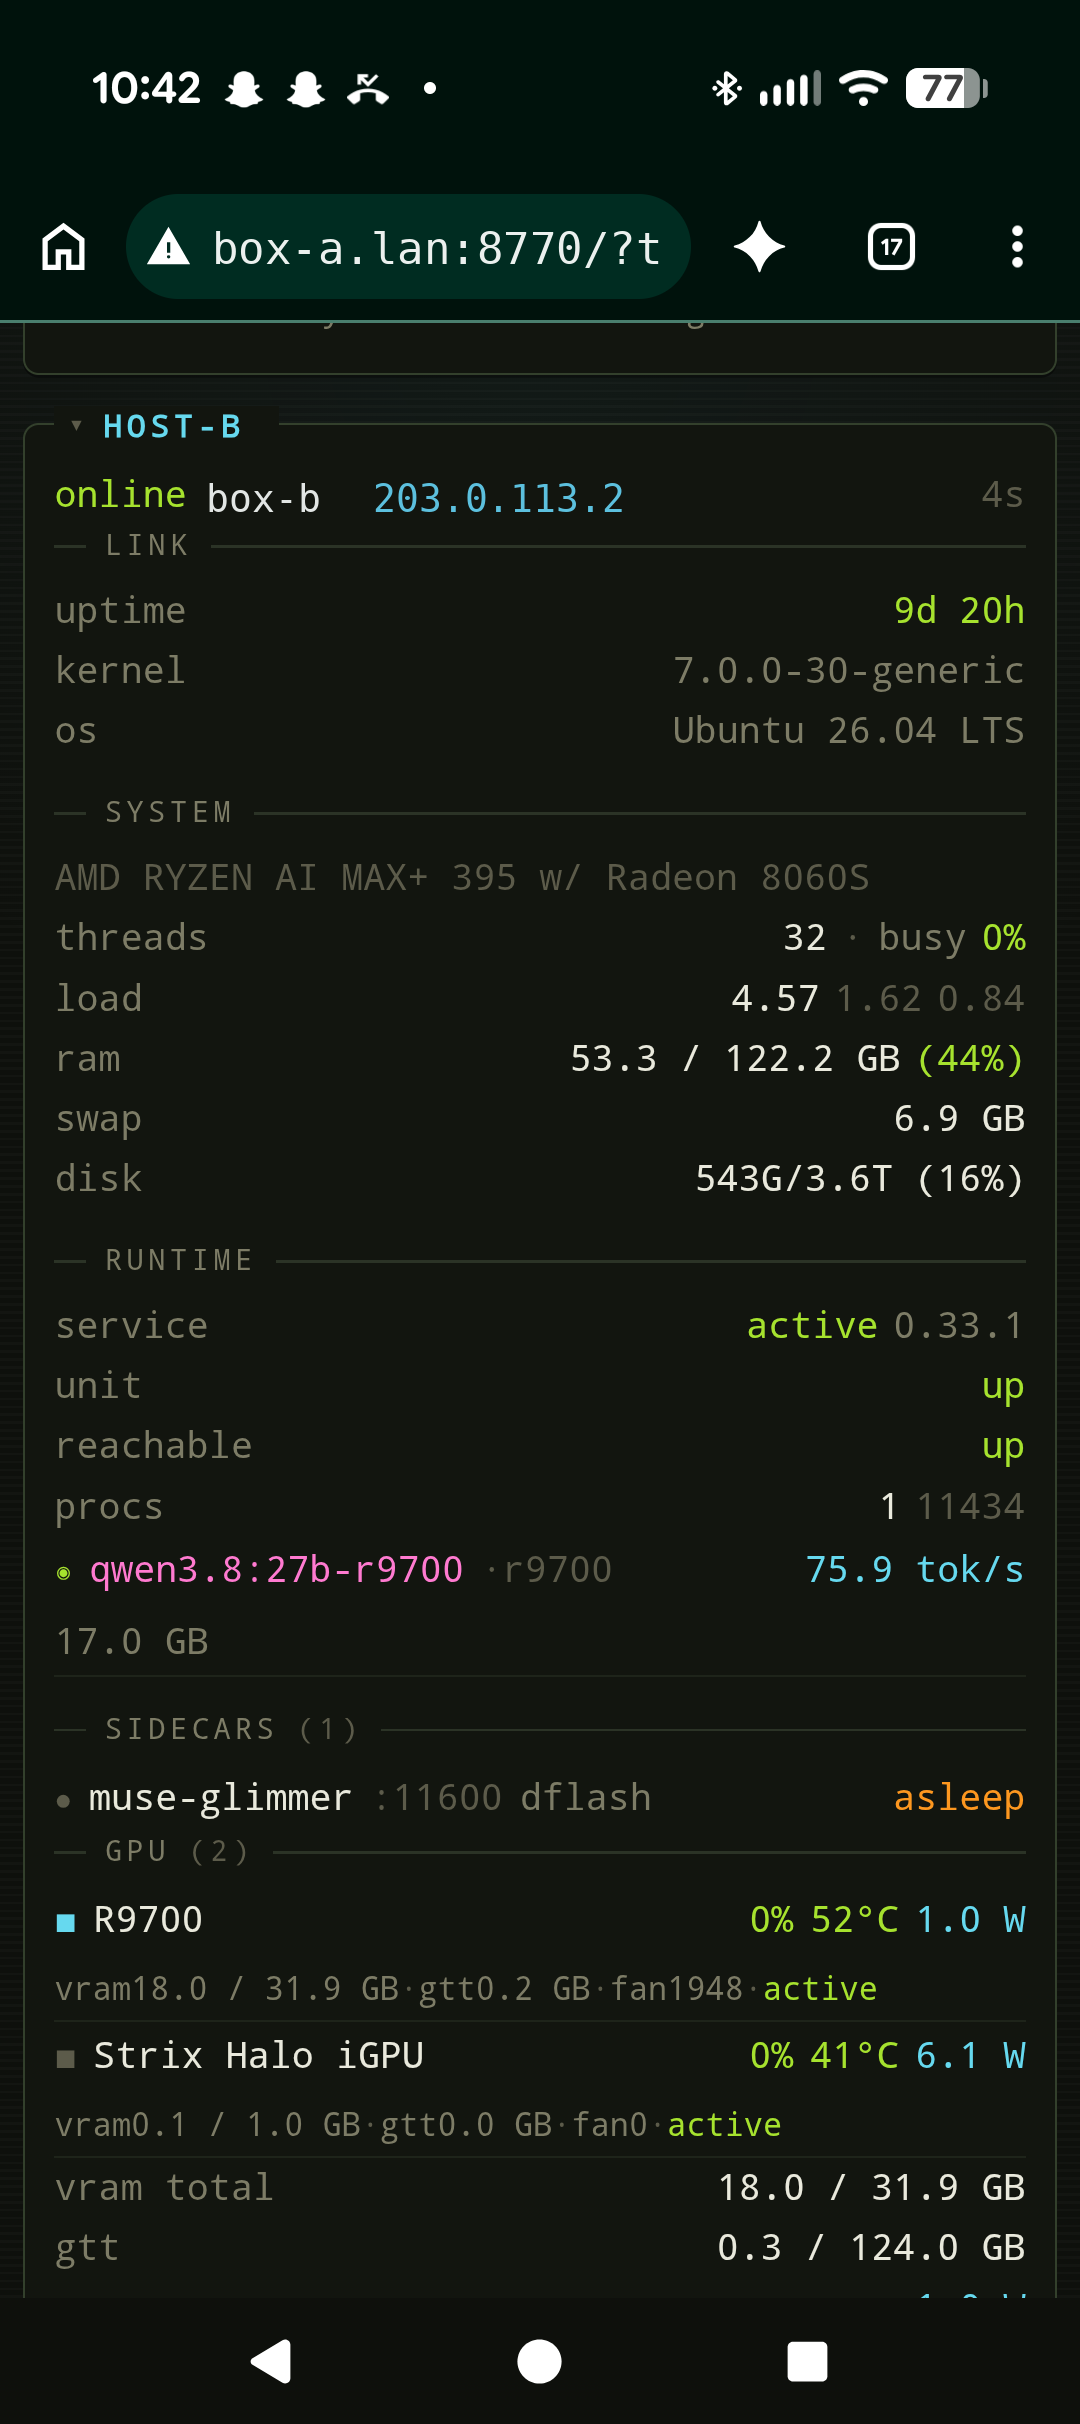
A remote box, in full. The second box reported over the LAN: uptime, kernel, CPU and memory,
runtime service state, sidecars, and both of its GPUs with their separate thermal and power readings.
 More panels from the same session — click to expand
These are the remaining views from the same capture session: governance and lane tables, downloads,
receipts, inbox and alerts, and the per-box job and device panels. They are included for completeness
rather than because each needs commentary.
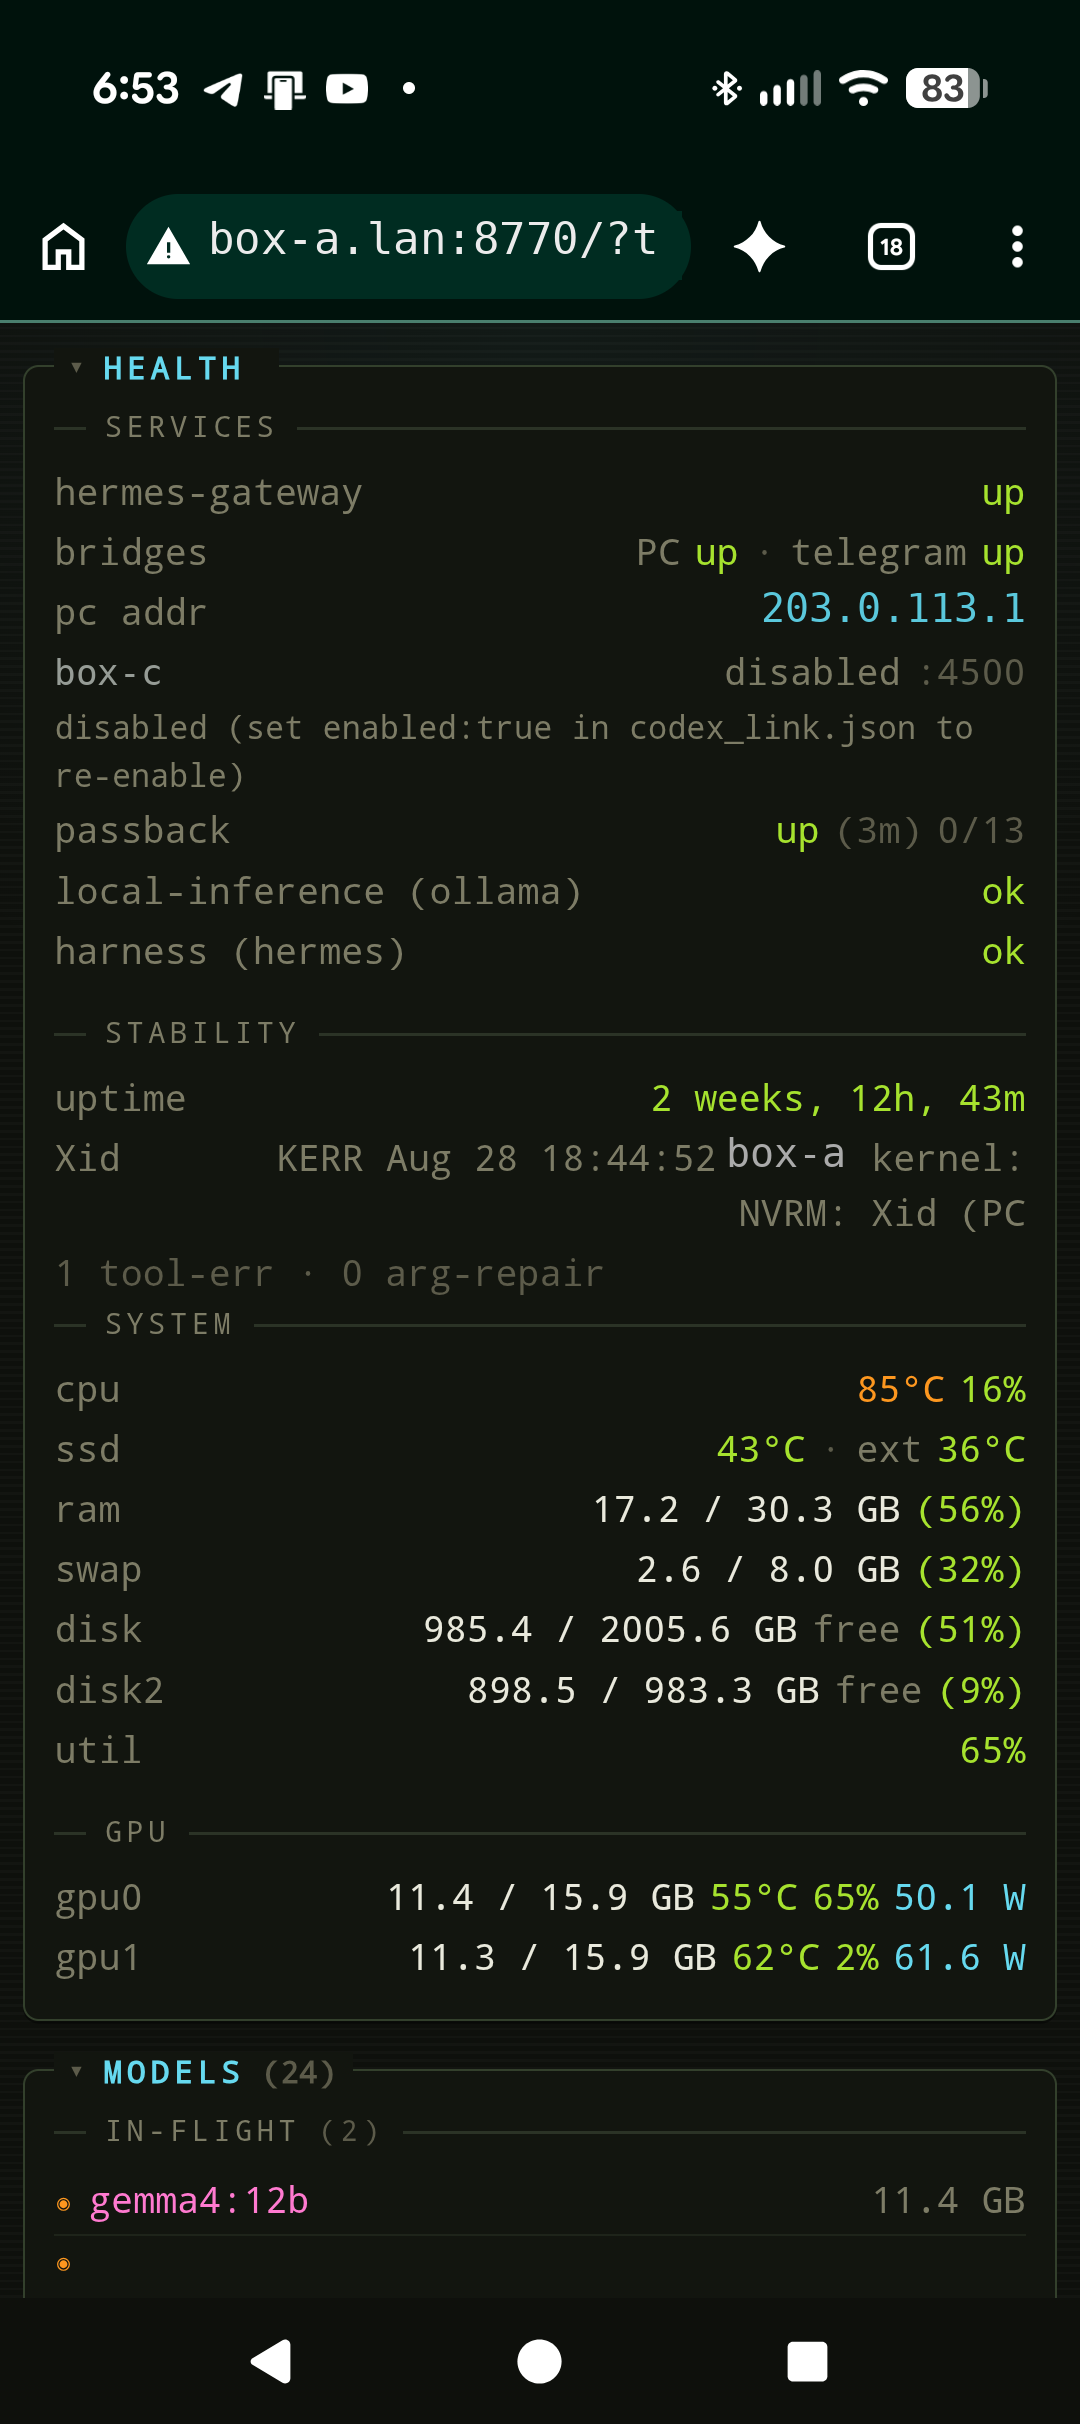
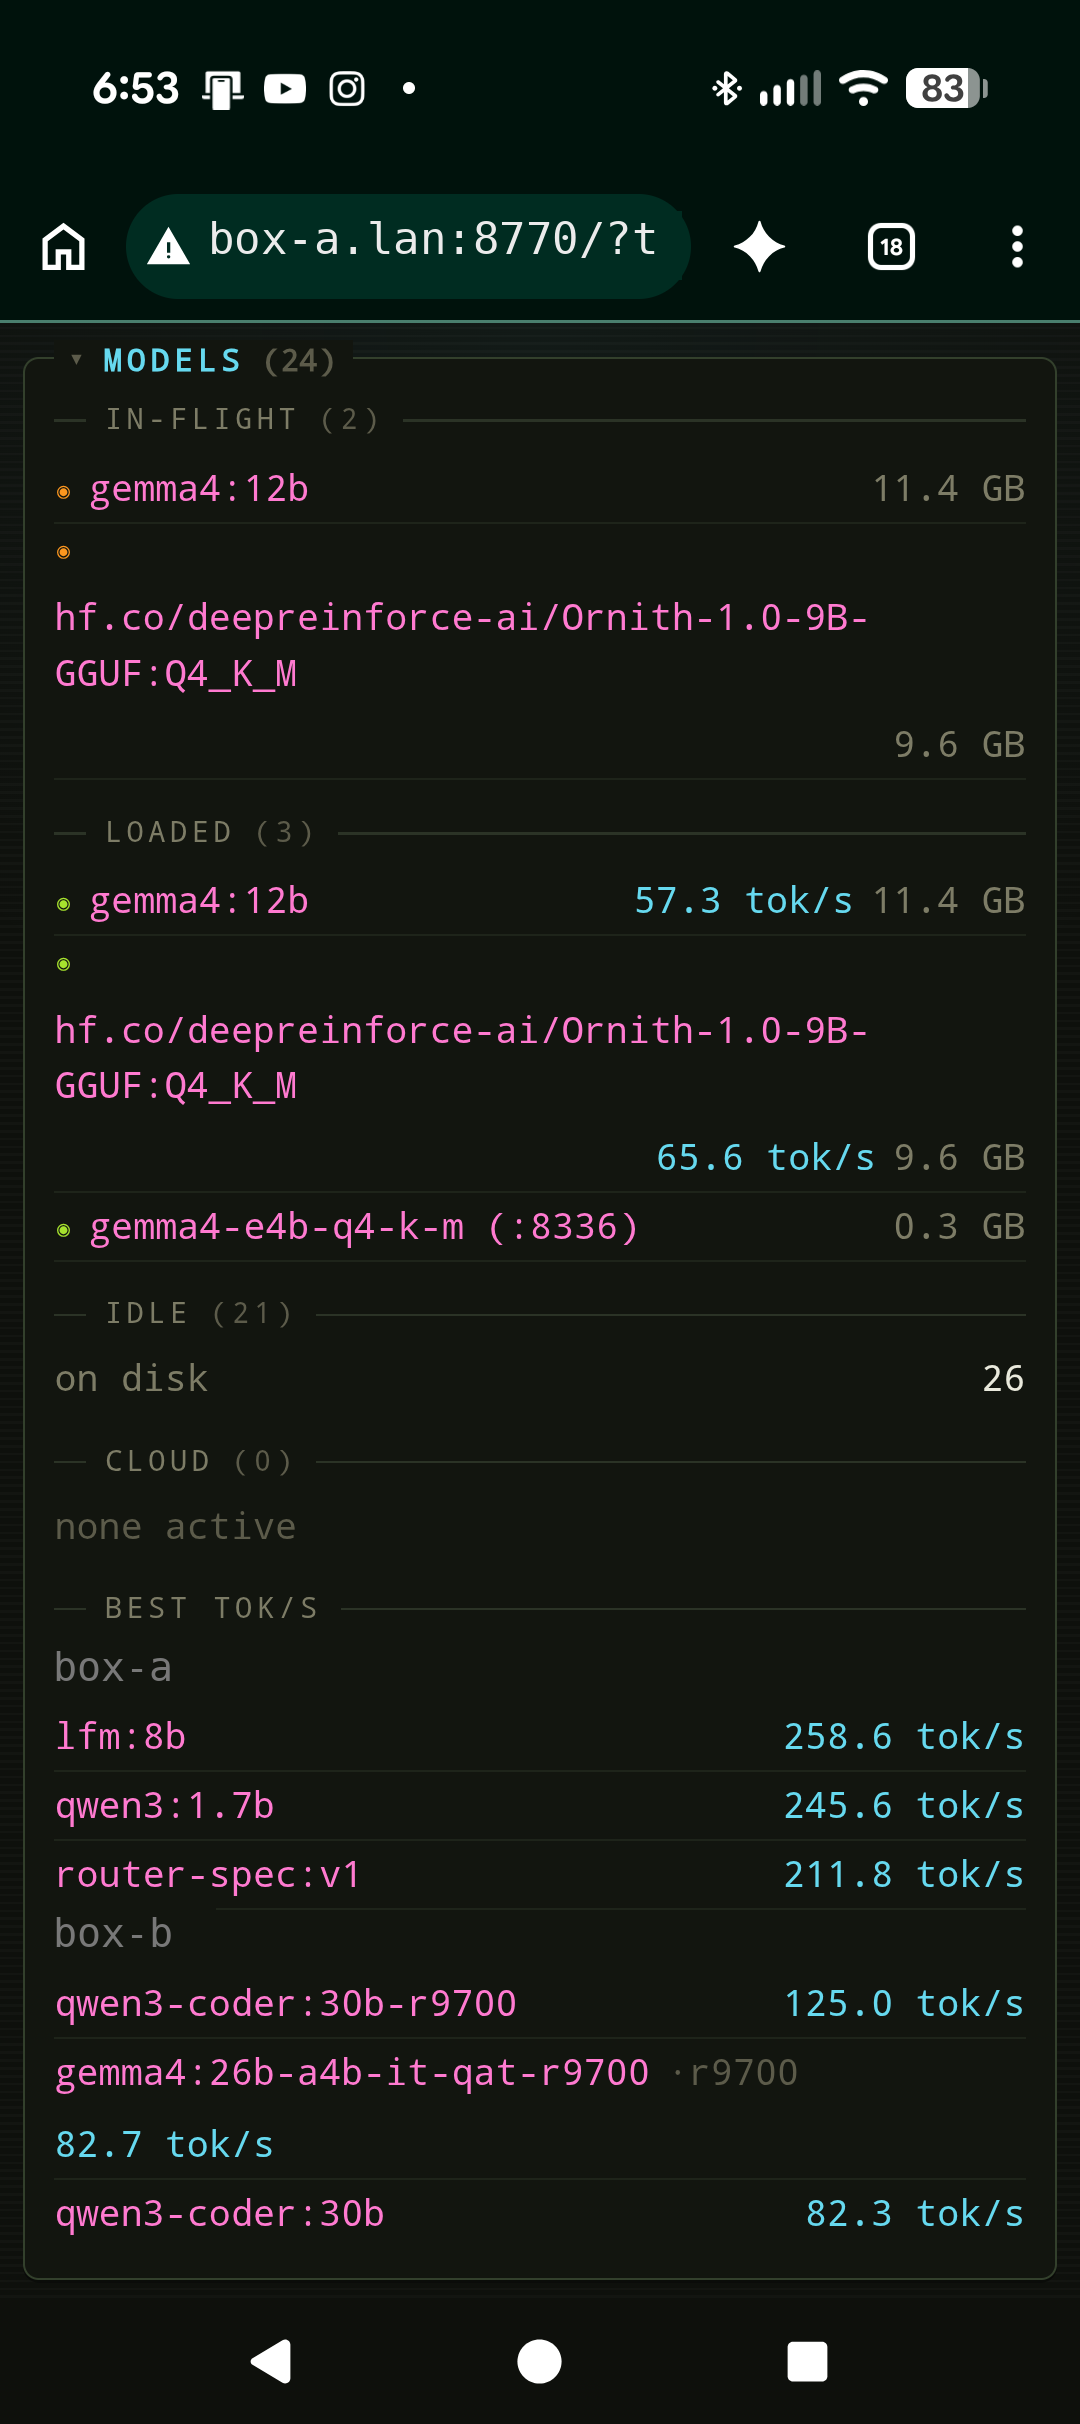
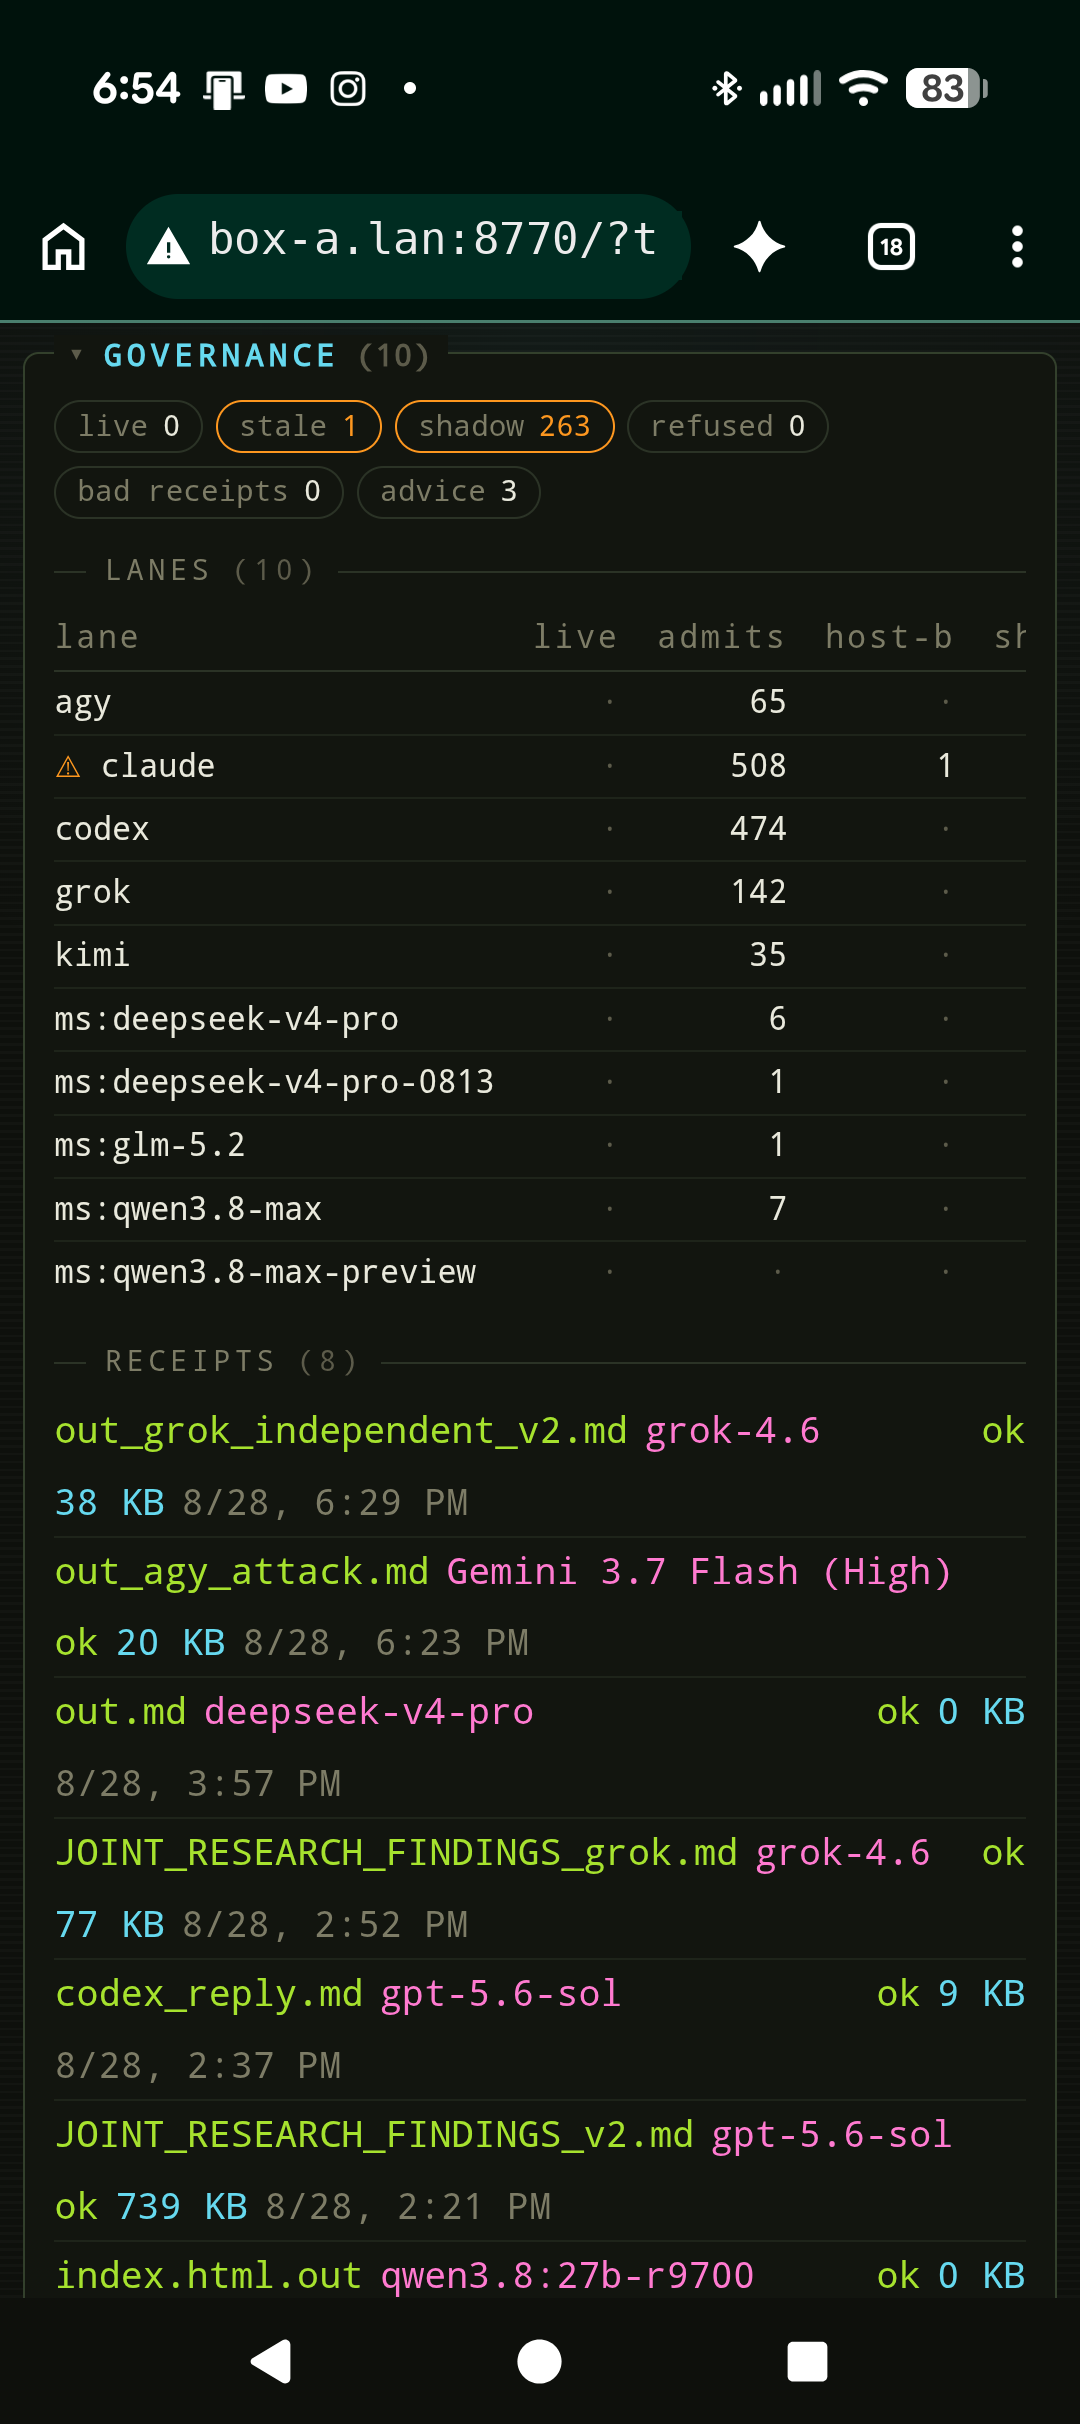
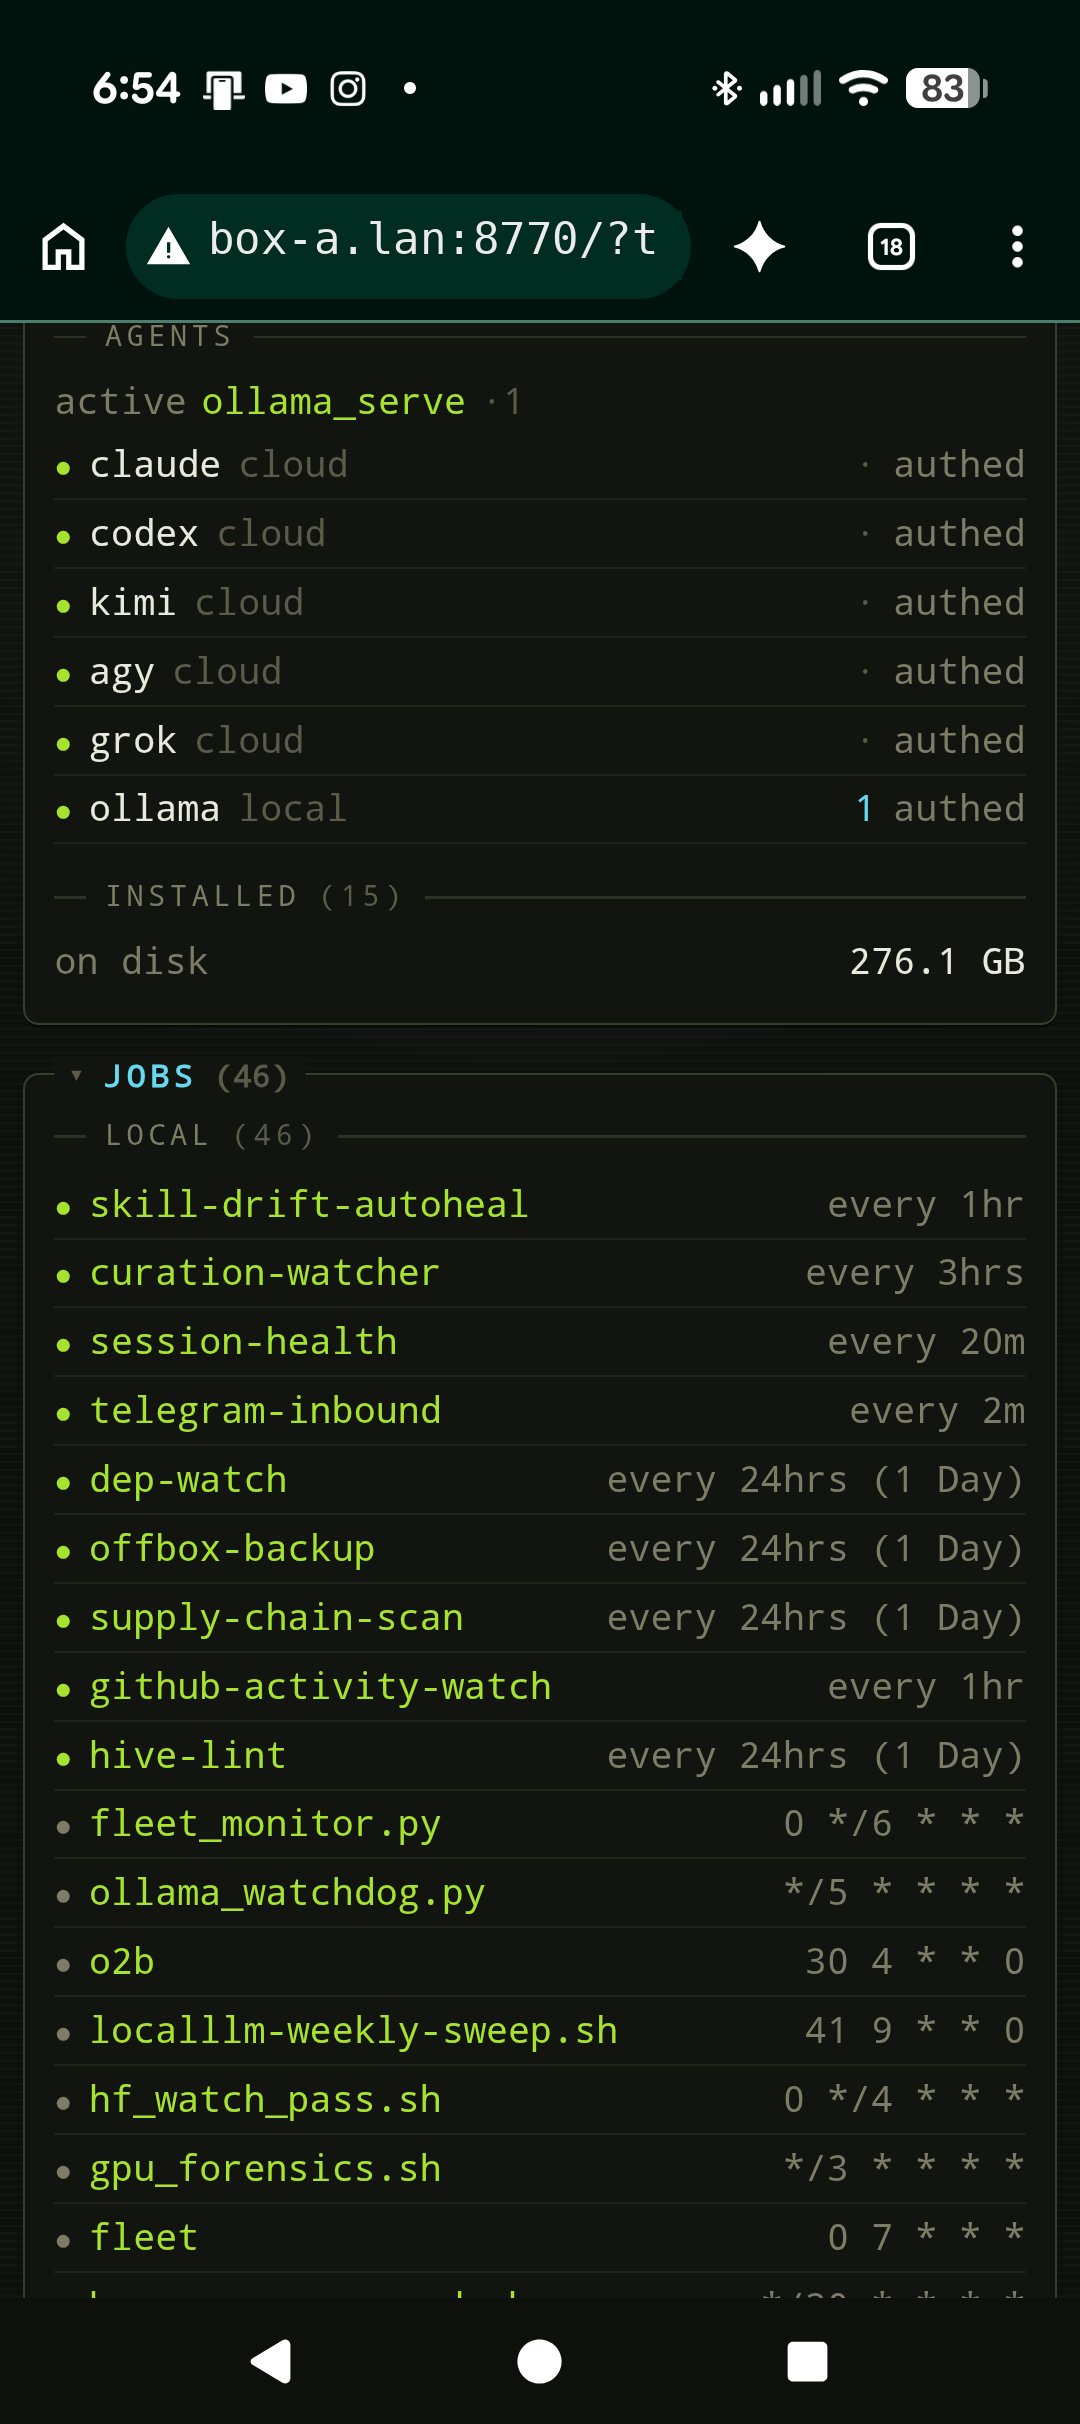
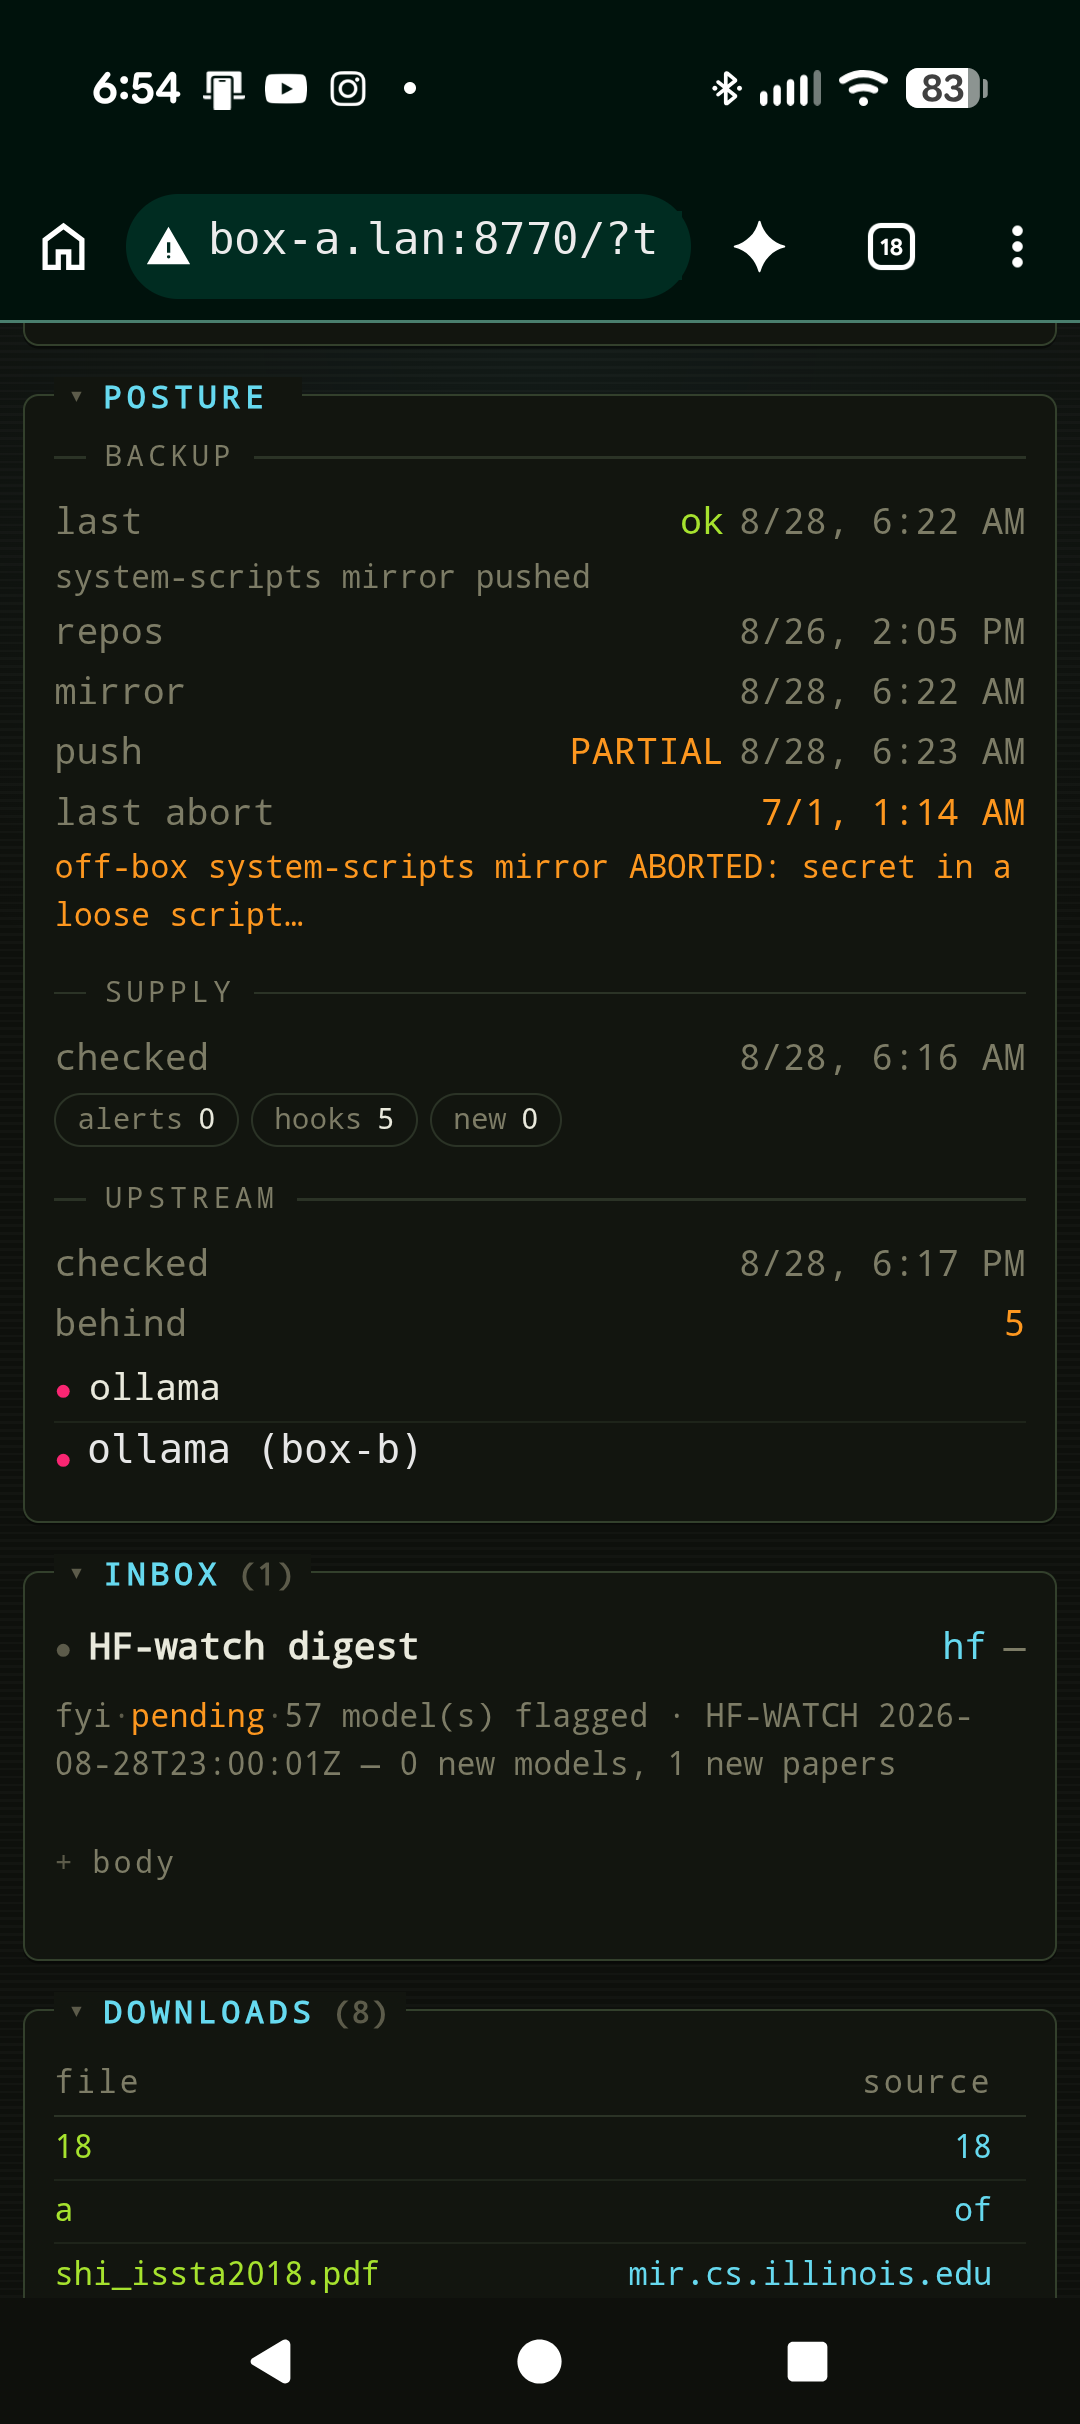
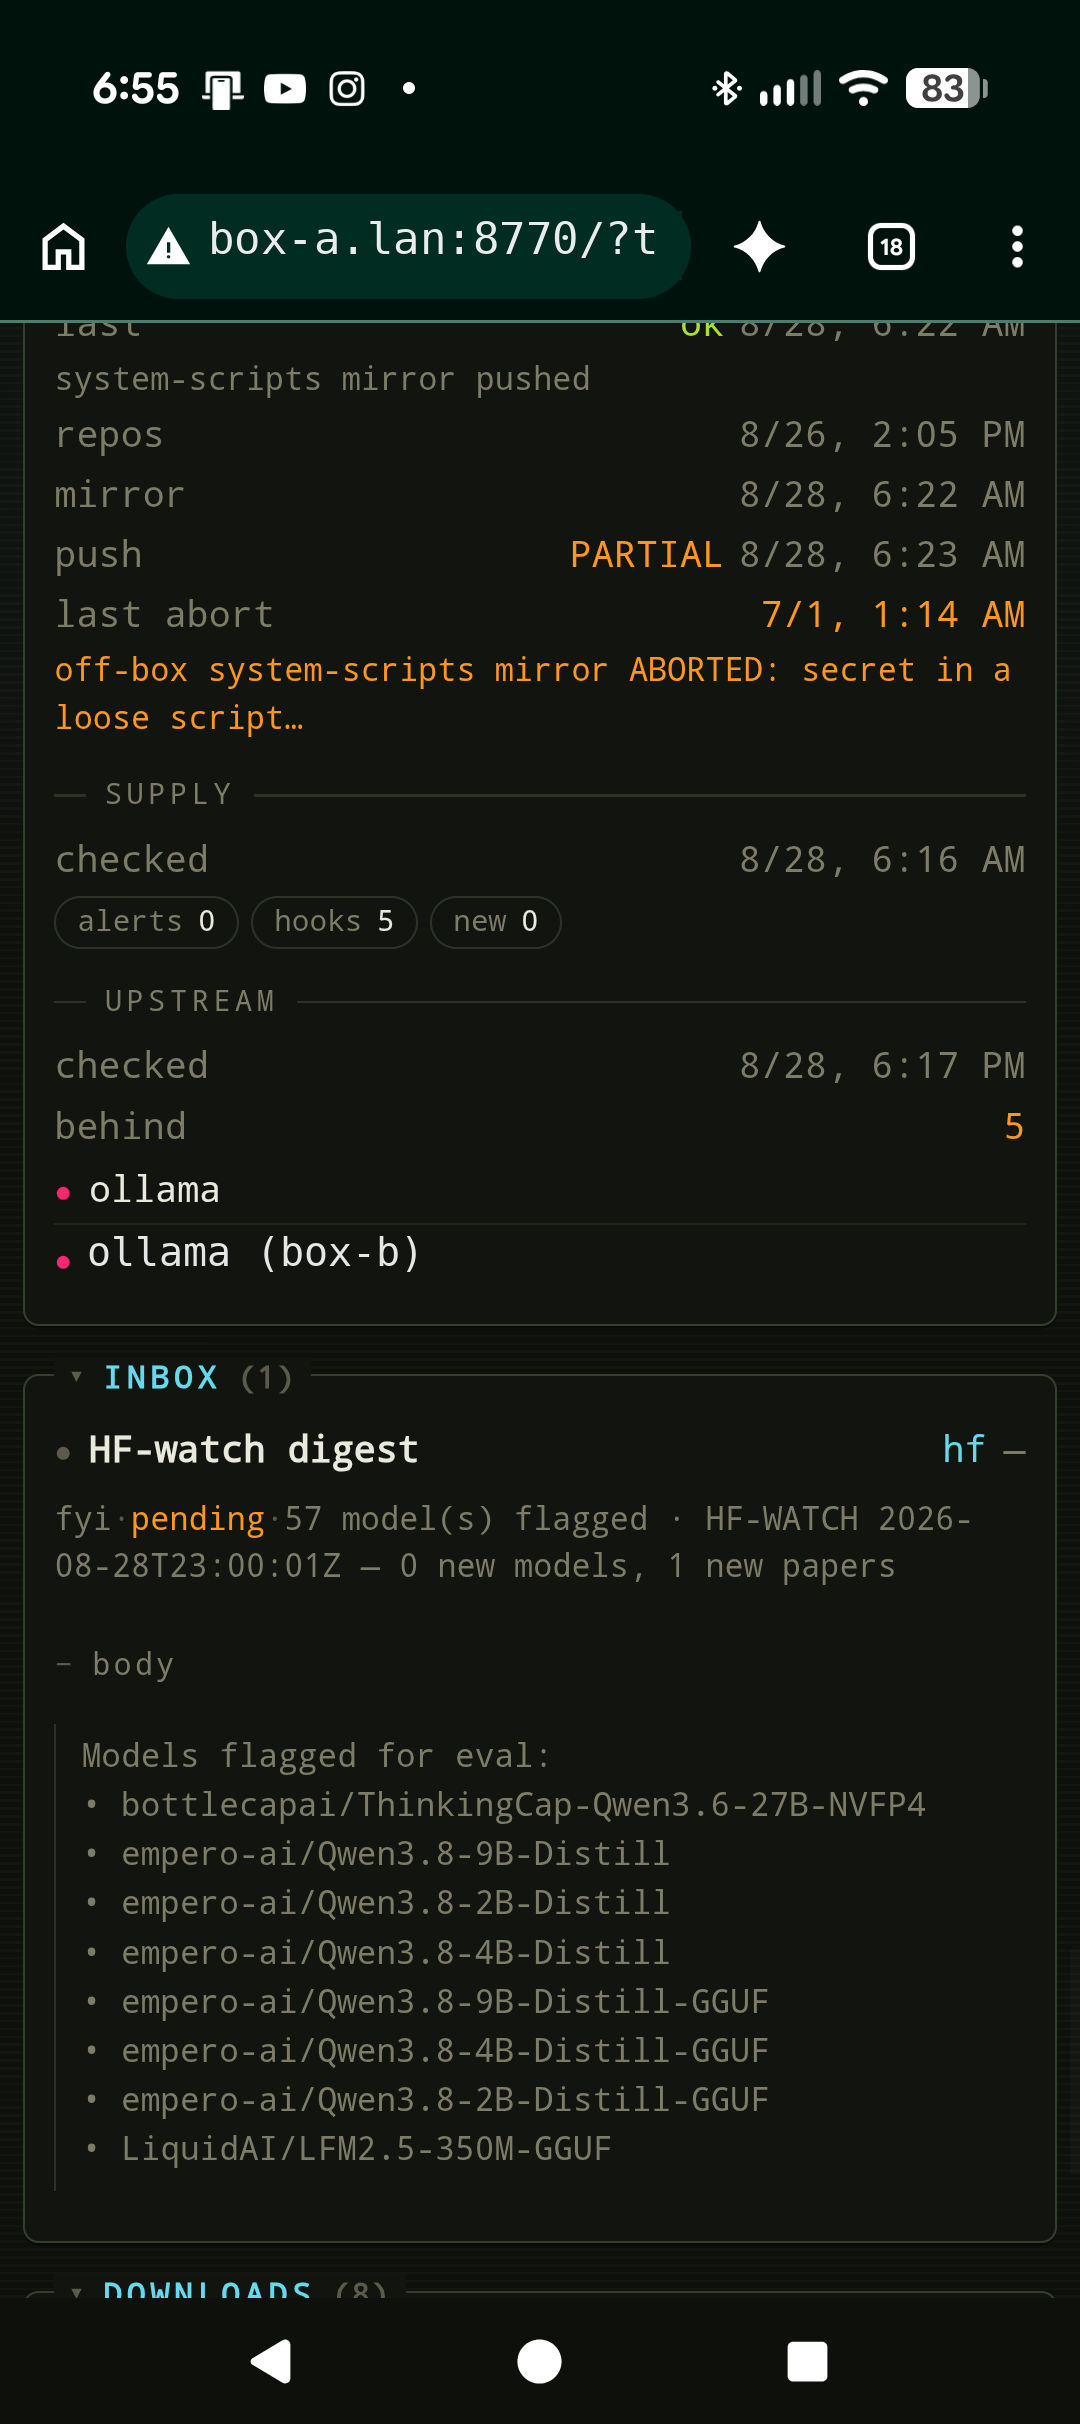
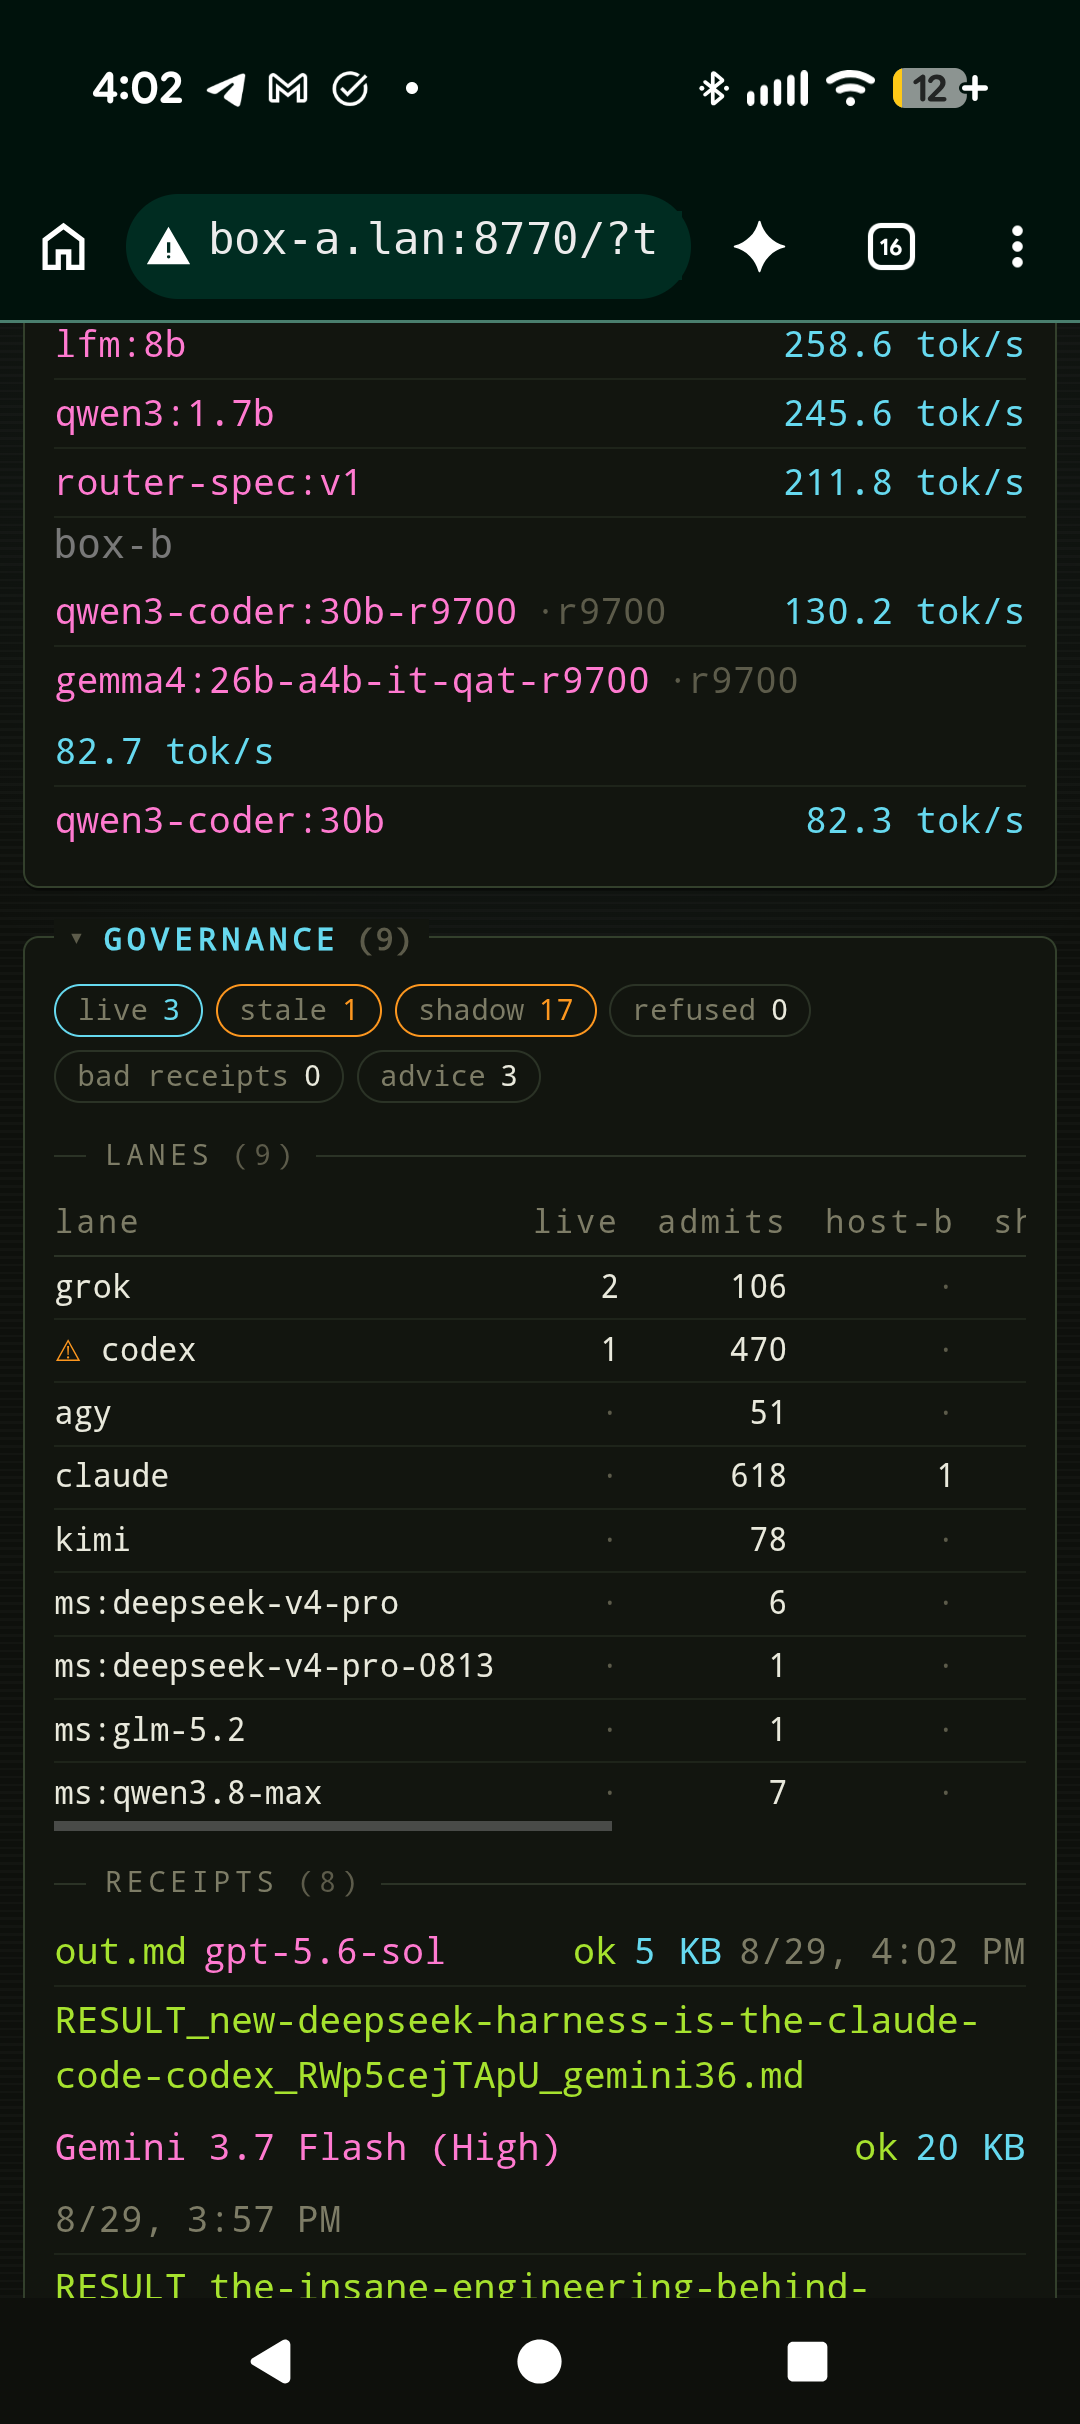
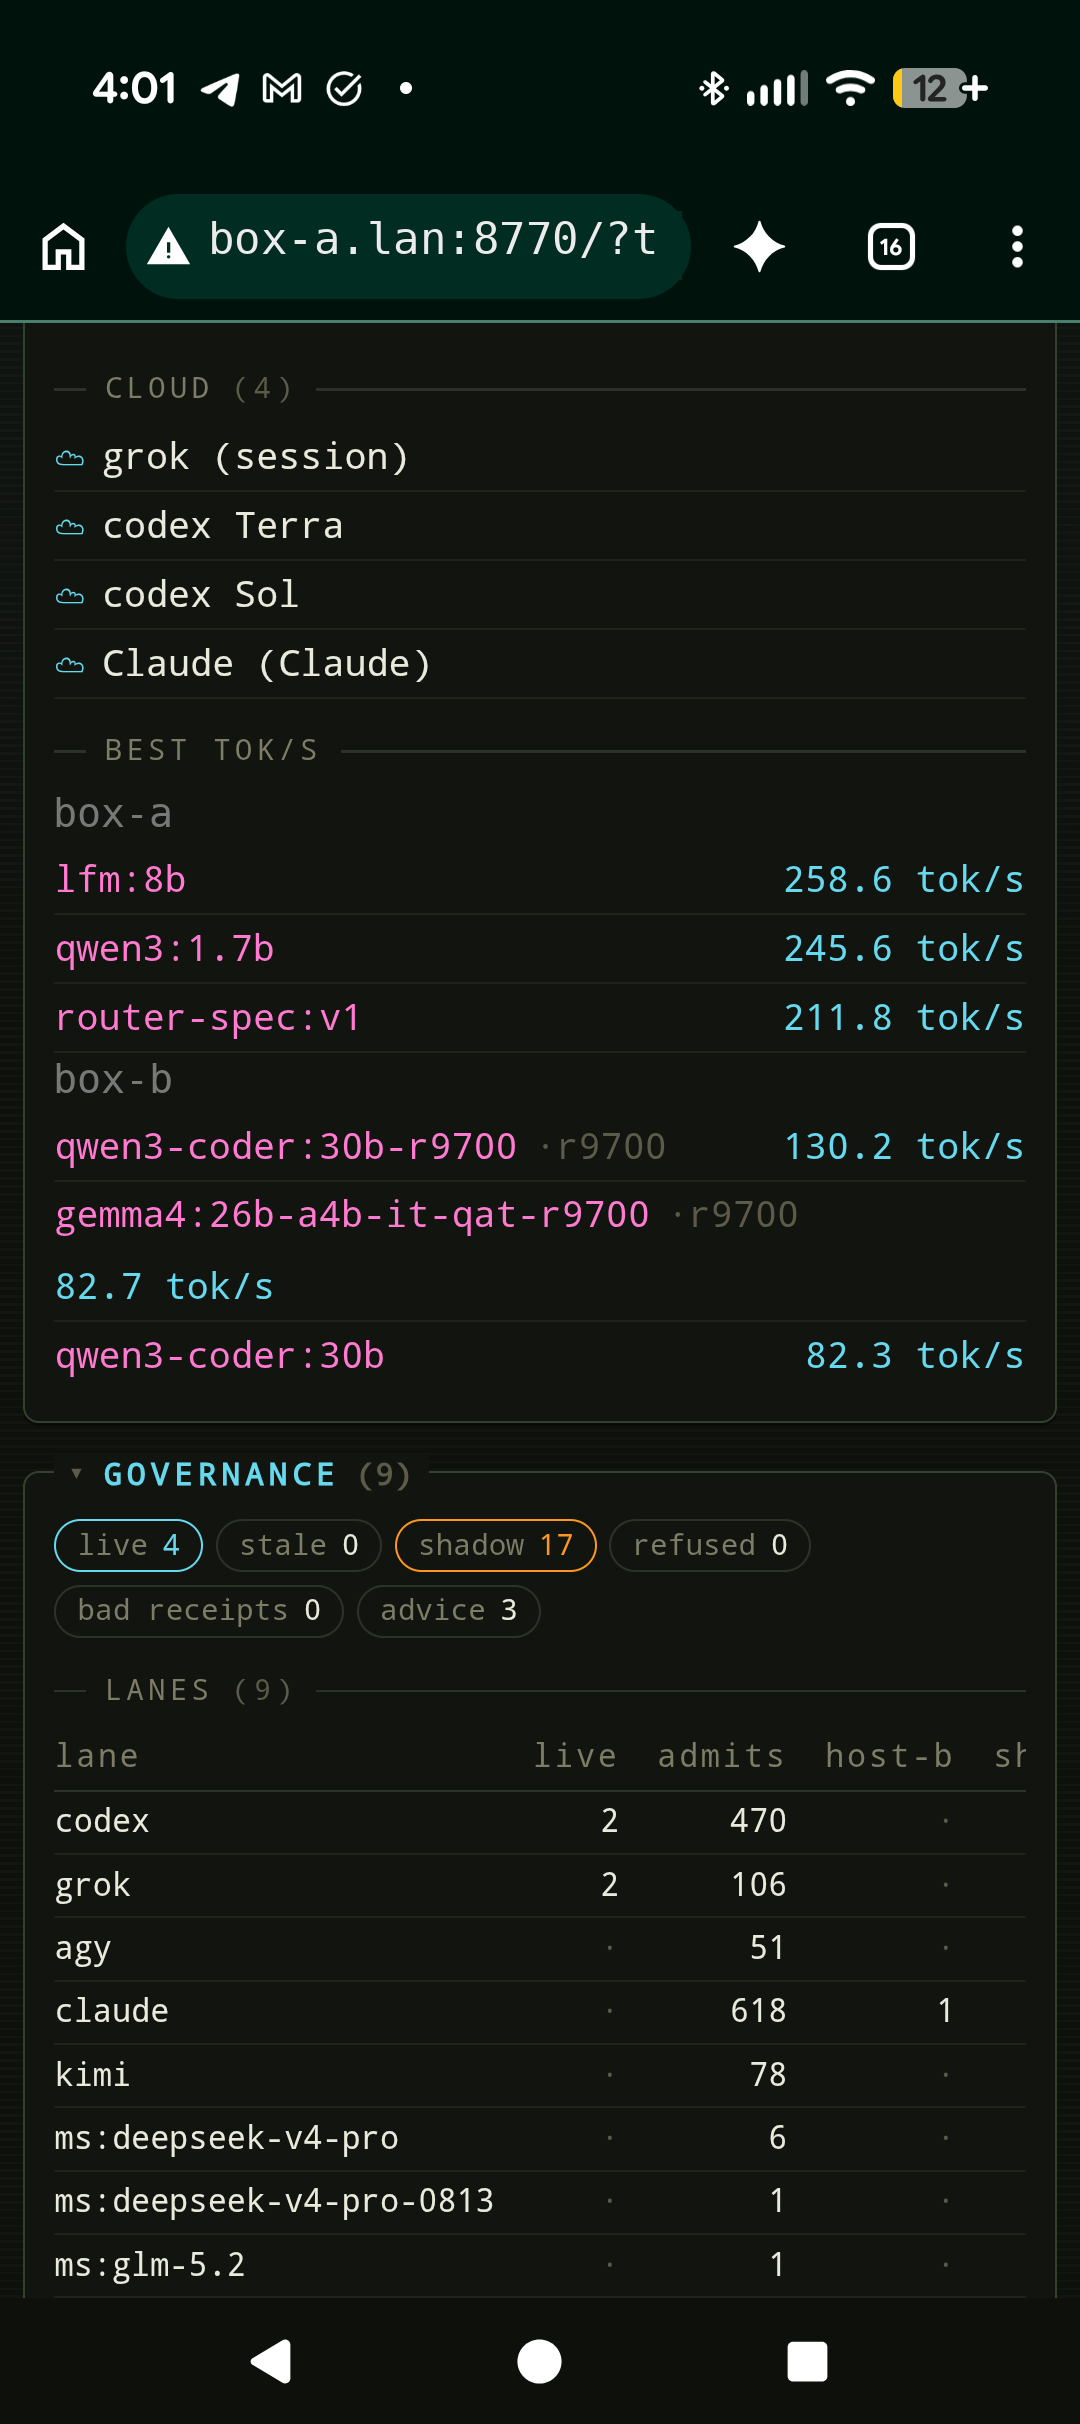
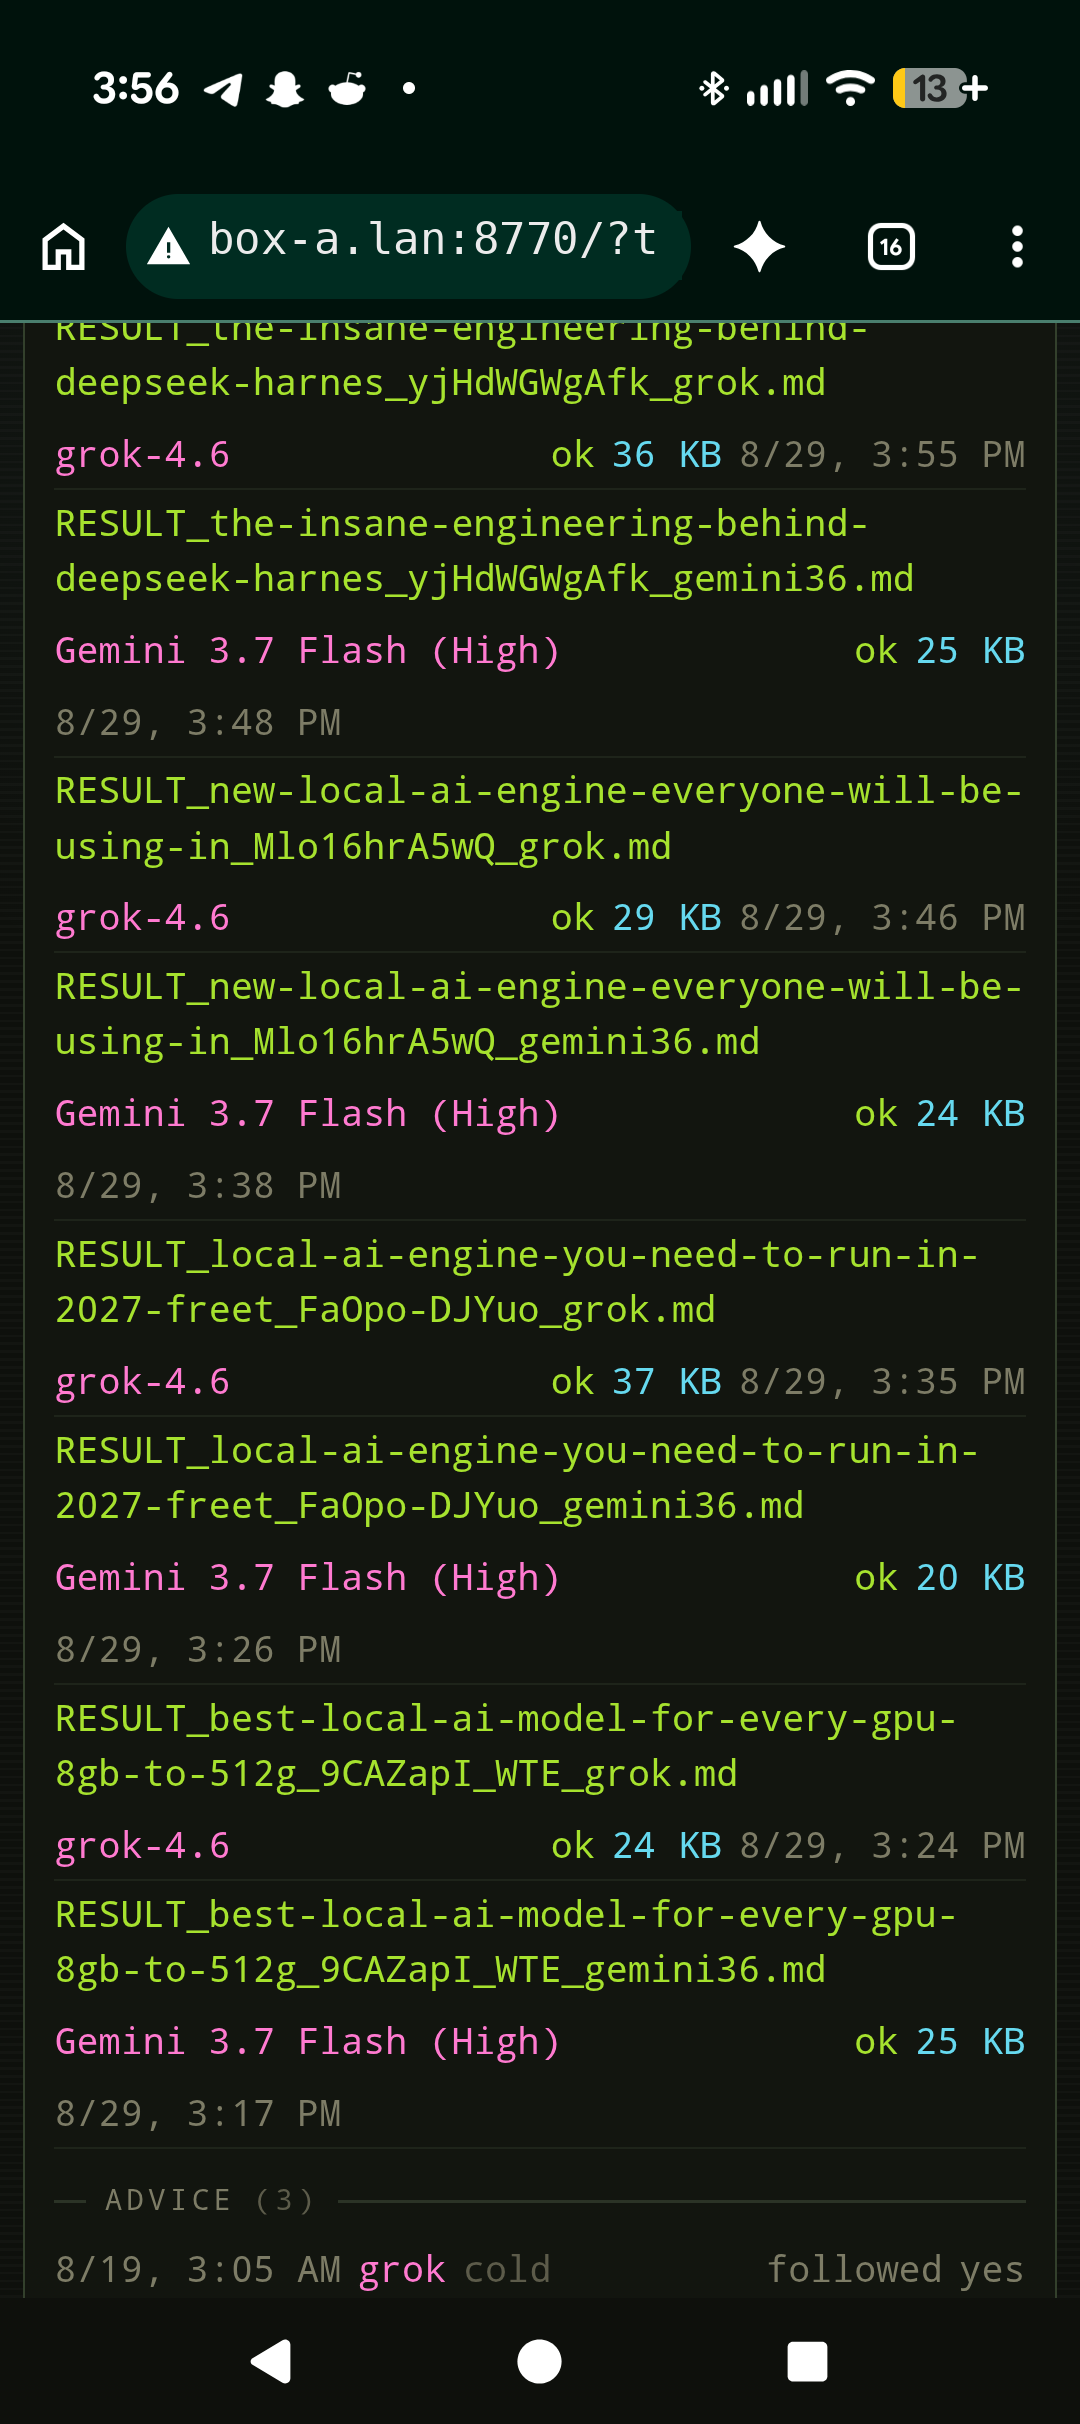
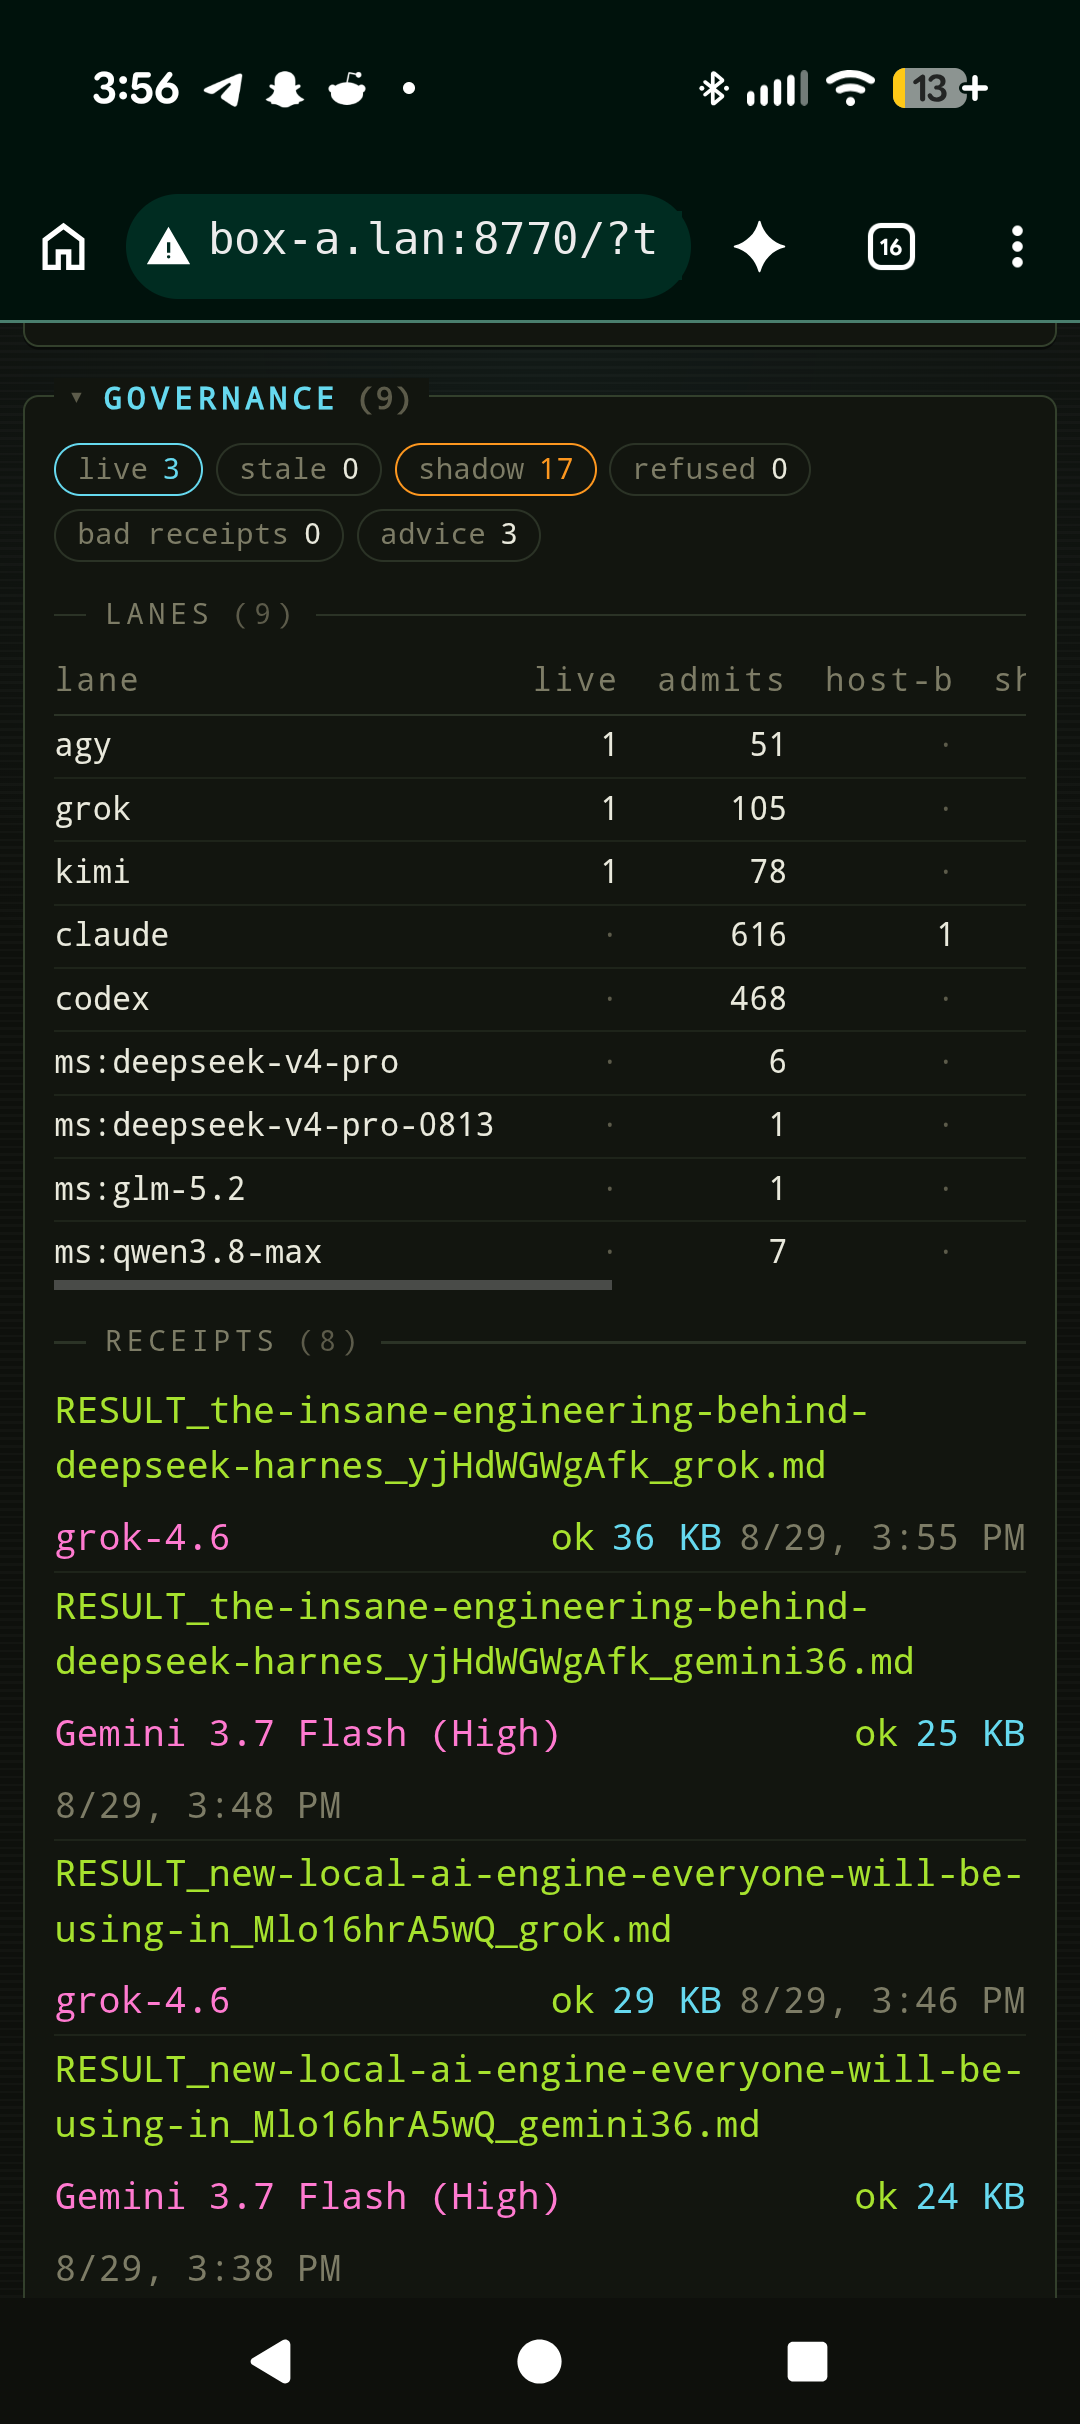
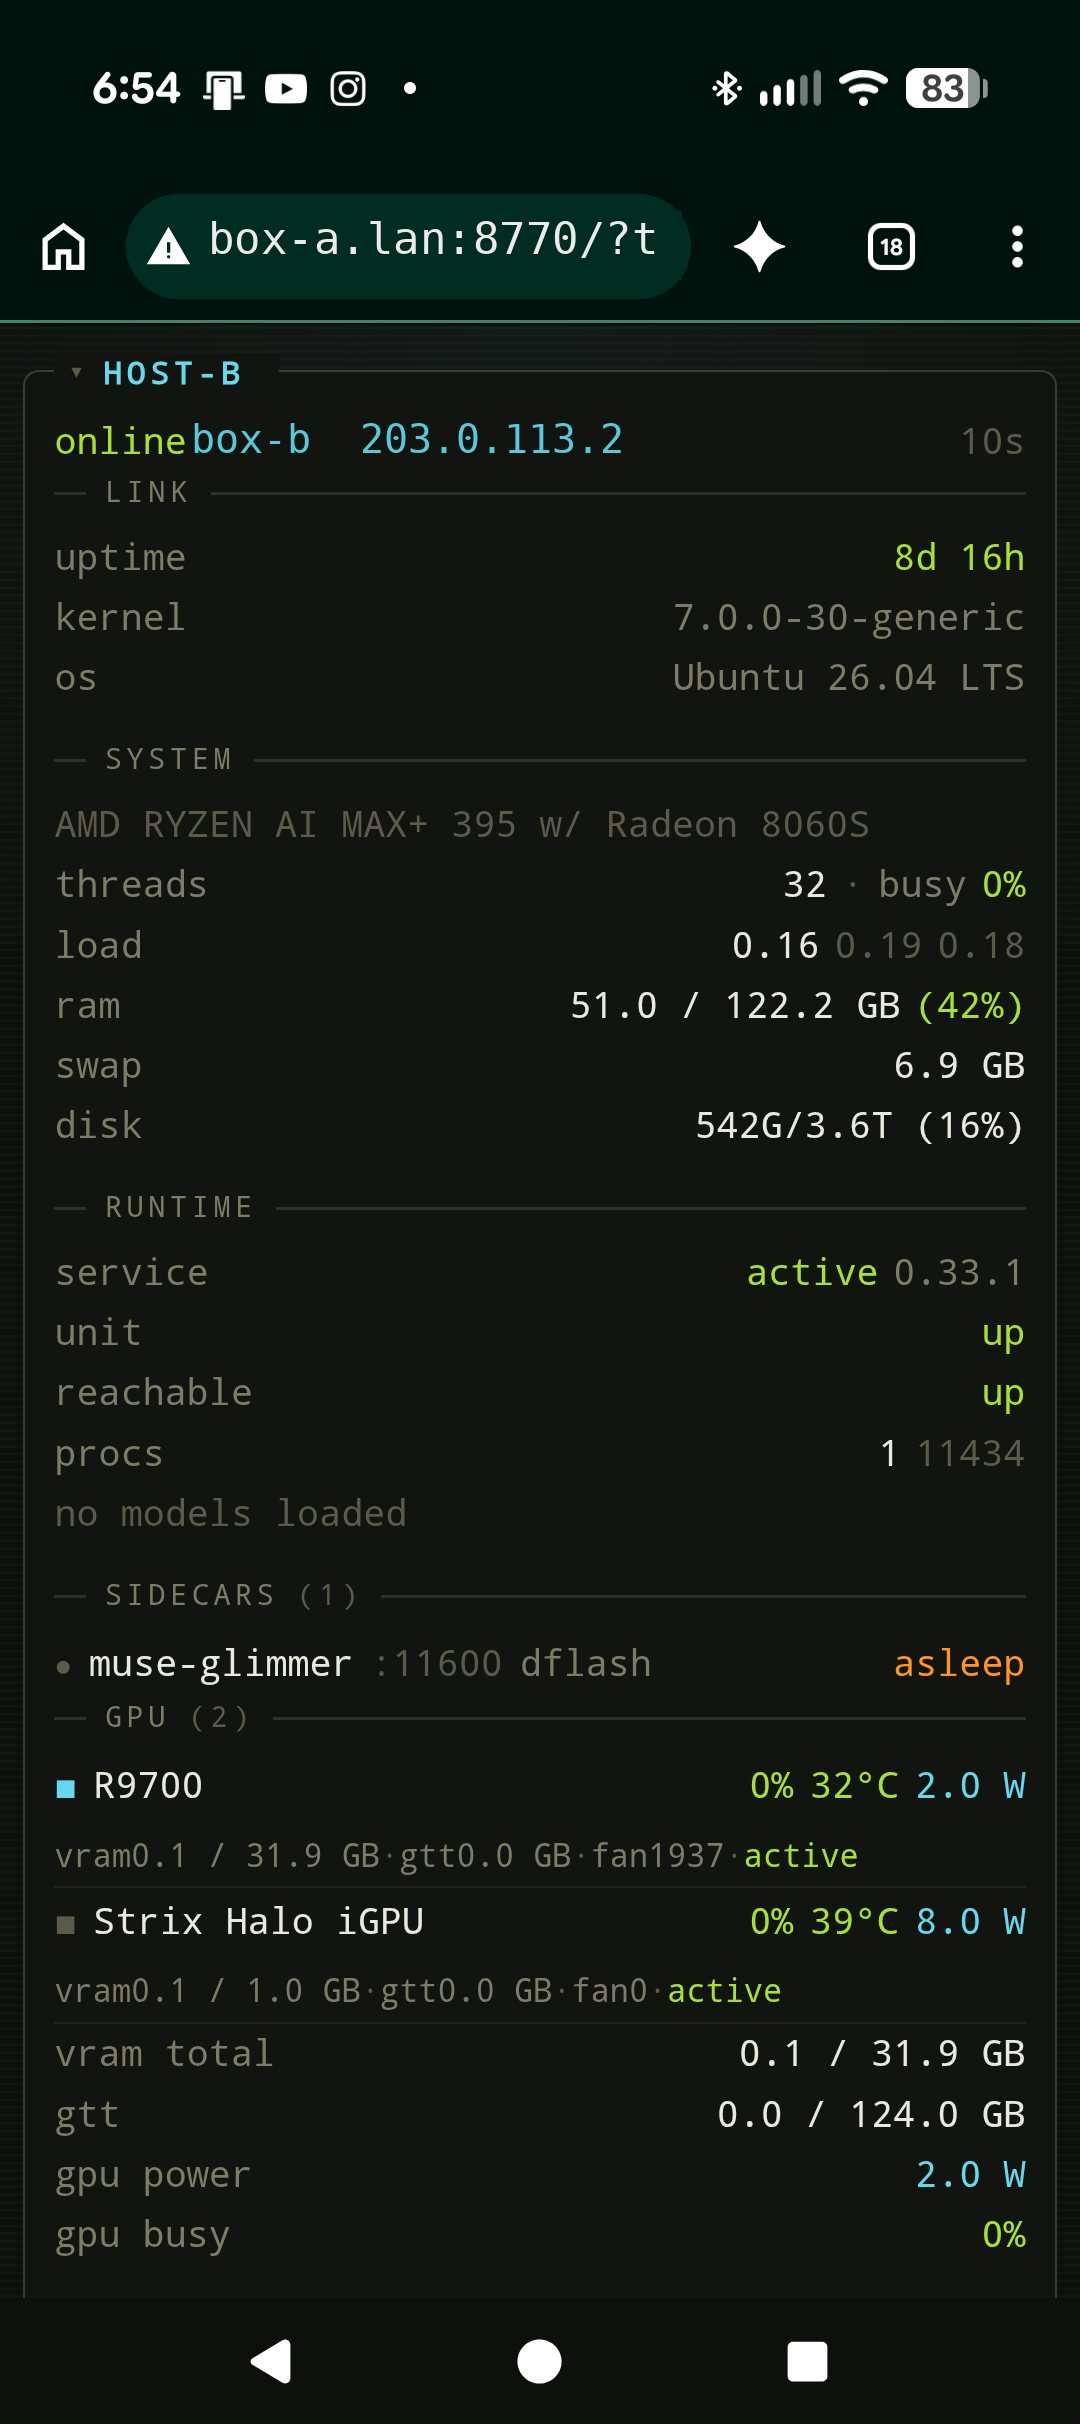
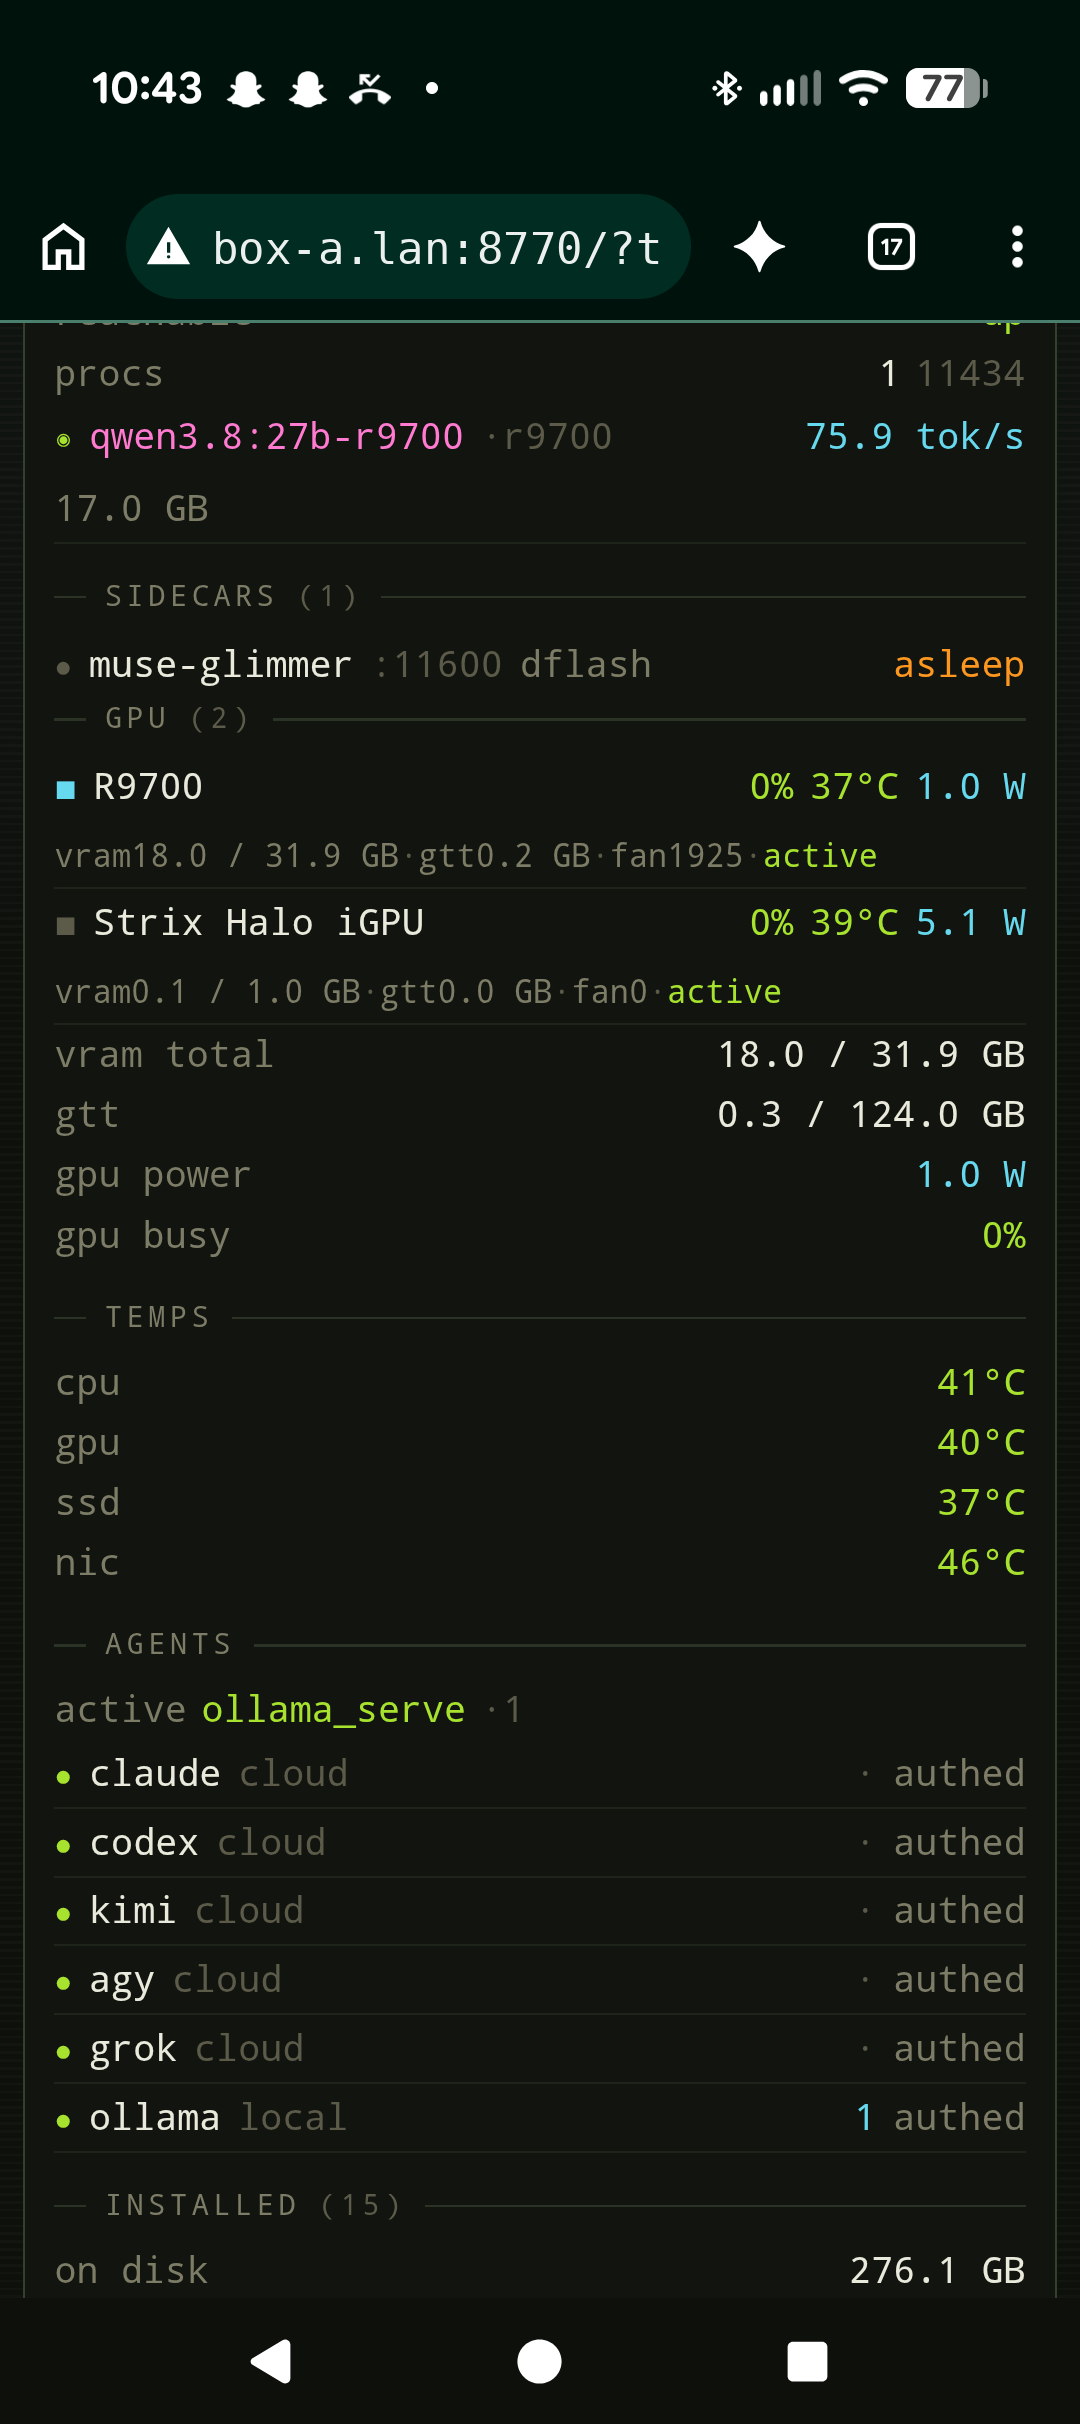
Host names, LAN addresses and box nicknames are substituted, not masked: the address bar readsbox-a.lan and remote addresses use the RFC 5737 documentation range, which is the same replacement
this repository's own publish scanner treats as sanctioned. What is substituted is the VALUE.
Field and key NAMES stay intact, because a key name is the interface a delegate codes against:
aliasing the name instead of the value produces code that compiles against a schema that does
not exist, which is a second failure bought for nothing. Every reading is real. As with the
terminal screenshot above, this is a newer in-house build than the tui/ sources exported here — the
exported tui/fleet_tui/serve.py wraps textual-serve and gives an adopter the same
serve-to-the-LAN capability, not this exact layout.
Research team
Research is a chain of inspectable artifacts, not an answer a model says confidently. The roles,
independence rule, receipt fields, failure handling, and security boundaries are canonical inspecs/research-team-protocol.md.
| Role | Responsibility | Boundary |
|---|---|---|
| Orchestrator | Frames the question and keeps the second brief blind. | Judgment remains the user's, and accountable. |
| Independent research legs | Retrieve evidence and retain separately named RESULT artifacts. | Agreement is not source verification. |
| Reconciler + verifier | Preserves dissent, then checks claims against the evidence pack. | The verifier is not the producing leg. |
| Actionability pass | Maps findings to the project’s closed vocabulary. | It does not turn a finding into truth. |
Video research
A video or talk backlog becomes dispatched multi-leg research briefs; legs return contract-checked RESULTs, a reconcile produces one FINAL, and per-project actionability is rated against a closed vocabulary. Findings render as cards on one self-contained hub page, because research you cannot re-find or audit is research you do not have.
Conceptual — see the status table: backlog diff -> stage briefs -> dispatch >=2 legs -> reconcile -> actionability ratings -> hub cards -> (rarely) a Solo-Rich Report
Solo-Rich Reports — why they exist
Most findings belong on a card. A finding earns a standalone richly-presented page only by clearing a measurable 2-of-3 gate: cross-leg convergence, actionable density, or real captured media. “Seems interesting” as a trigger produces exactly the bloat this tier exists to avoid; see guard/specs/SPEC_solo_rich_report.md and templates/solo-rich-report.md.template.
What's runnable vs contract-only
| Surface | Status |
|---|---|
| Overview + hub template | Template/reference |
ACTIONABLE_ADDENDUM.md |
Contract |
SPEC_solo_rich_report.md + solo-rich template |
Contract + template |
SPEC_odyssey_hub.md |
Design guidance for a DIFFERENT hub (its RAW/RECONCILED data model is NOT the video hub) |
stage_video_research.py + video_backlog_diff.py |
Runnable, adapter-config required (EDIT ME markers + VIDEO_ROOT) |
check_leg_contract.py + actionable_rollup.py |
Runnable — RESULT-contract check and per-project actionability rollup |
vision_ingest.py / vision_motion.py / vision_semantic.py |
Root pipeline modules addressed by fixed path from guard/ and guard/mutation_harness.py; exercised by the guard layer, not standalone entry points |
| Deterministic hub/solo-rich renderers | Not supplied yet (follow-up) |
Security and delivery integrity
| Defense | Component | Adopter proof it can fail | Invocation boundary |
|---|---|---|---|
| Retain worker output | dispatch-wrapper |
empty output or nonzero exit with an artifact | The template marks artifacts; it does not invoke transaction or contract checks. |
| Check result vocabulary | check_leg_contract.py |
missing relevance line or invented verb | Run after a RESULT is produced. |
| Atomic replacement | artifact_txn.py |
validator or commit failure | Separate component, not wrapper wiring. |
| Detect contract drift | contract_agreement.py |
one of four vocabulary surfaces diverges | Pre-dispatch/release guard, not evidence verification. |
| Treat a leg as adversarial | research protocol | retained artifact contradicts a report | Operating pattern, not an enforced guard. |
The research skills describe failure modes—premise leakage, consensus laundering, skipped verification,
and invalid evaluation signals—not capabilities automatically granted by copying a directory.
If you only take one thing: retain independent artifacts and make a different worker verify claims before actionability.
Set it up with your own AI
Clone this repository, then point your orchestrator at adopt/README.md. The agent will inventory the host, propose a local configuration from those observations, show the user the plan and diffs before any service, cron entry, or shell hook, and run the available verification steps. The adoption path degrades to a single box with no GPU or cloud CLI; absent capabilities are recorded rather than guessed. The adopt/ documents are written for an agent with shell access.
Read adopt/README.md and follow it in order. Inventory this host before prescribing configuration. Show me the plan and diffs before installing any cron entry, service, or shell hook, then retain the literal verification output.
Activate the publication hook
Cloning this repository installs no Git hook, and running pytest does not install one either. guard/hooks/pre-push is tracked source; Git does not track its hooks directory, so a fresh clone has no publication gate until one is installed on purpose. Two policy inputs have to be provisioned first, and neither travels with a clone: the scanner's identity terms in _tools/identity_terms.txt (gitignored — copy _tools/identity_terms.example.txt and fill it with your own terms, one per line) and the approved commit identities in this repository's local Git config (git config --local --add fleetops.approvedIdentity '<owner-email>' — a GitHub handle such as <owner-gh> is not automatically the right e-mail). With both in place, install into Git's effective hook path, confirm the installed bytes match the tracked hook, and rehearse a clean acceptance and a planted refusal in an isolated repository before relying on it:
cp _tools/identity_terms.example.txt _tools/identity_terms.txt   # then edit it: your terms, one per line
git config --local --add fleetops.approvedIdentity '<owner-email>'
bash guard/hooks/install.sh --pre-push-config          # preflight, install pre-push only, verify byte parity
bash guard/hooks/install.sh --check-pre-push-config    # read-only: preflight + byte parity; rerun before a push
The installer refuses, installing nothing, when either input is missing, when an approved-identity file or FLEETOPS_APPROVED_IDENTITIES would shadow the config route, or when a different hook already occupies the destination. The detailed sequence — prerequisites, precedence between the identity sources, handling an existing hook, the isolated rehearsal with its expected accepted and refused outputs, and rollback — is Activating the publication hook in guard/README.md. Once active, the hook scans each selected outgoing commit's tree and full message and checks the author, committer and Co-authored-by/Signed-off-by trailer e-mails against the approved list. It is a local hook, not a server-side gate: it does not stop anyone who deliberately bypasses local hooks, and it refuses to run from a shallow clone — clone without --depth, or run git fetch --unshallow first.
Measured on two boxes
What you'd actually need to reproduce this. The tier that matters is VRAM, and it is a cliff
rather than a slope — a model either fits or it doesn't:
- One 16 GB card is not sized from weight files. On Box A, named models in this band have weight
files of 5.2–15 GB: LFM2.5-8B (5.2), Ornith-9B (5.6), gemma4:12b (7.6), deepseek-r1:14b (9.0),
gemma4:26b-a4b-it-qat (15). Do not infer 16 GiB fit or KV-cache headroom from those sizes — the
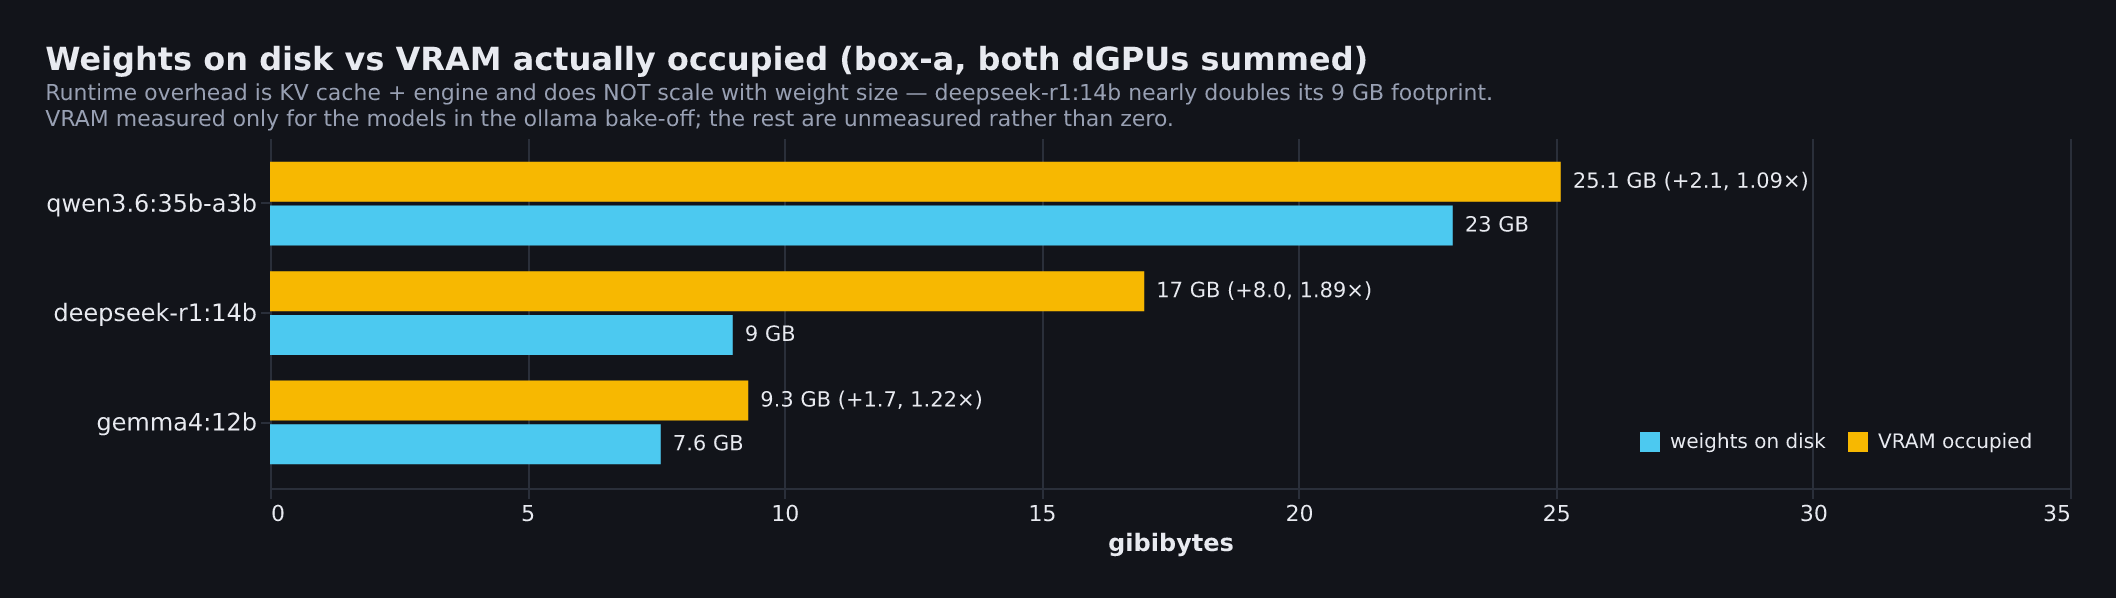
third chart is the evidence: a 9 GB model (deepseek-r1:14b) occupies 17.0 GiB loaded. Use the
CSV's measured loaded footprint at the intended context length.gemma4:26b-a4b-it-qat,qwen3-coder:30b, andgemma4:31b-it-qatall havedevice=dgpu-arows in the same log; one-card
placement is a measured run property, not a weight-size guarantee. The review leg is re-derived as
hardware and roster change (best model on the fastest capable GPU, never pinned to one tag). This
export does not establish a general minimum configuration. - The second 16 GB card is what this dual-5060-Ti box needed for the ~18–23 GB-weight MoEs.
qwen3.6:35b-a3bis 23 GB of weights and occupies 25.1 GiB loaded (CSV split 13675 / 12025
MiB). That measured footprint exceeds one 16 GiB card; the third chart plots it. Same two-card
pattern, different totals: Ornith-35B 11839 / 11323 MiB; GLM-4.7-Flash 11447 / 10789 MiB.qwen3-coder:30bandgemma4:31b-it-qatran on one card (device=dgpu-a) in the same CSV — they
are not the two-card story. A single 32 GB card is a different layout. On decode the two-card rows
land at ~105–115 tok/s (the higher figures that used to sit here were prompt-processing, not
decode). - Runtime overhead does not scale with weight size. The third chart's three rows add 1.7, 8.0
and 2.1 GiB on top of files of 7.6, 9.0 and 23 GB respectively — the largest model there carries
nearly the smallest overhead. Budget it per model from the log; it is not a percentage. - CPU is not the bottleneck for GPU-resident inference; it matters for loading and for the
orchestration around the models. System RAM matters more than core count. The throughput charts were
measured with 32 GB, which was adequate but not generous once several services and a browser were
running alongside; this box now has 64 GB, and the power-study numbers were taken on that. - Model weights are large. Hundreds of GB of models and working state on the internal NVMe here (not inventoried in this export).
- Box A is an AM4 board (MSI B550 Tomahawk Max) feeding one card at PCIe 4.0 x8 and the
other at PCIe 3.0 x4. Every box-a number in the charts was measured through exactly those
links. The memory behind them is not one configuration: charts 01–05 ran on the mismatched 32 GB kit
at 2933 MT/s, and the power study and chart 06 ran on the matched 64 GB kit at 3200 MT/s (the
hardware table gives both, with the 2026-09-06 boundary); the cross-box and
device-split panels also carry box-b values, which run on that machine's own unified-memory path.
This log has no x16 or different-platform control, so it cannot say what the links do or do not
slow, and it cannot call the VRAM cliff the only gate. VRAM is the hard fit/no-fit cliff on this
log. RAM, serving stack (CUDA vs Vulkan/RADV), and which device the run landed on also move the
rates.
This operating log now records box-a and box-b: different vendors, serving stacks, and device
paths. Every CSV row has box, device, quant, serving_stack, quality_score, verdict columns —
many values are blank, because a blank is more honest than a value reconstructed after the fact —
and n_runs_for_model so the sample size stays attached to the number. Some rows are single-run.
This is not a controlled cross-vendor benchmark; it is a transparent record for operating decisions,
with its limits visible.
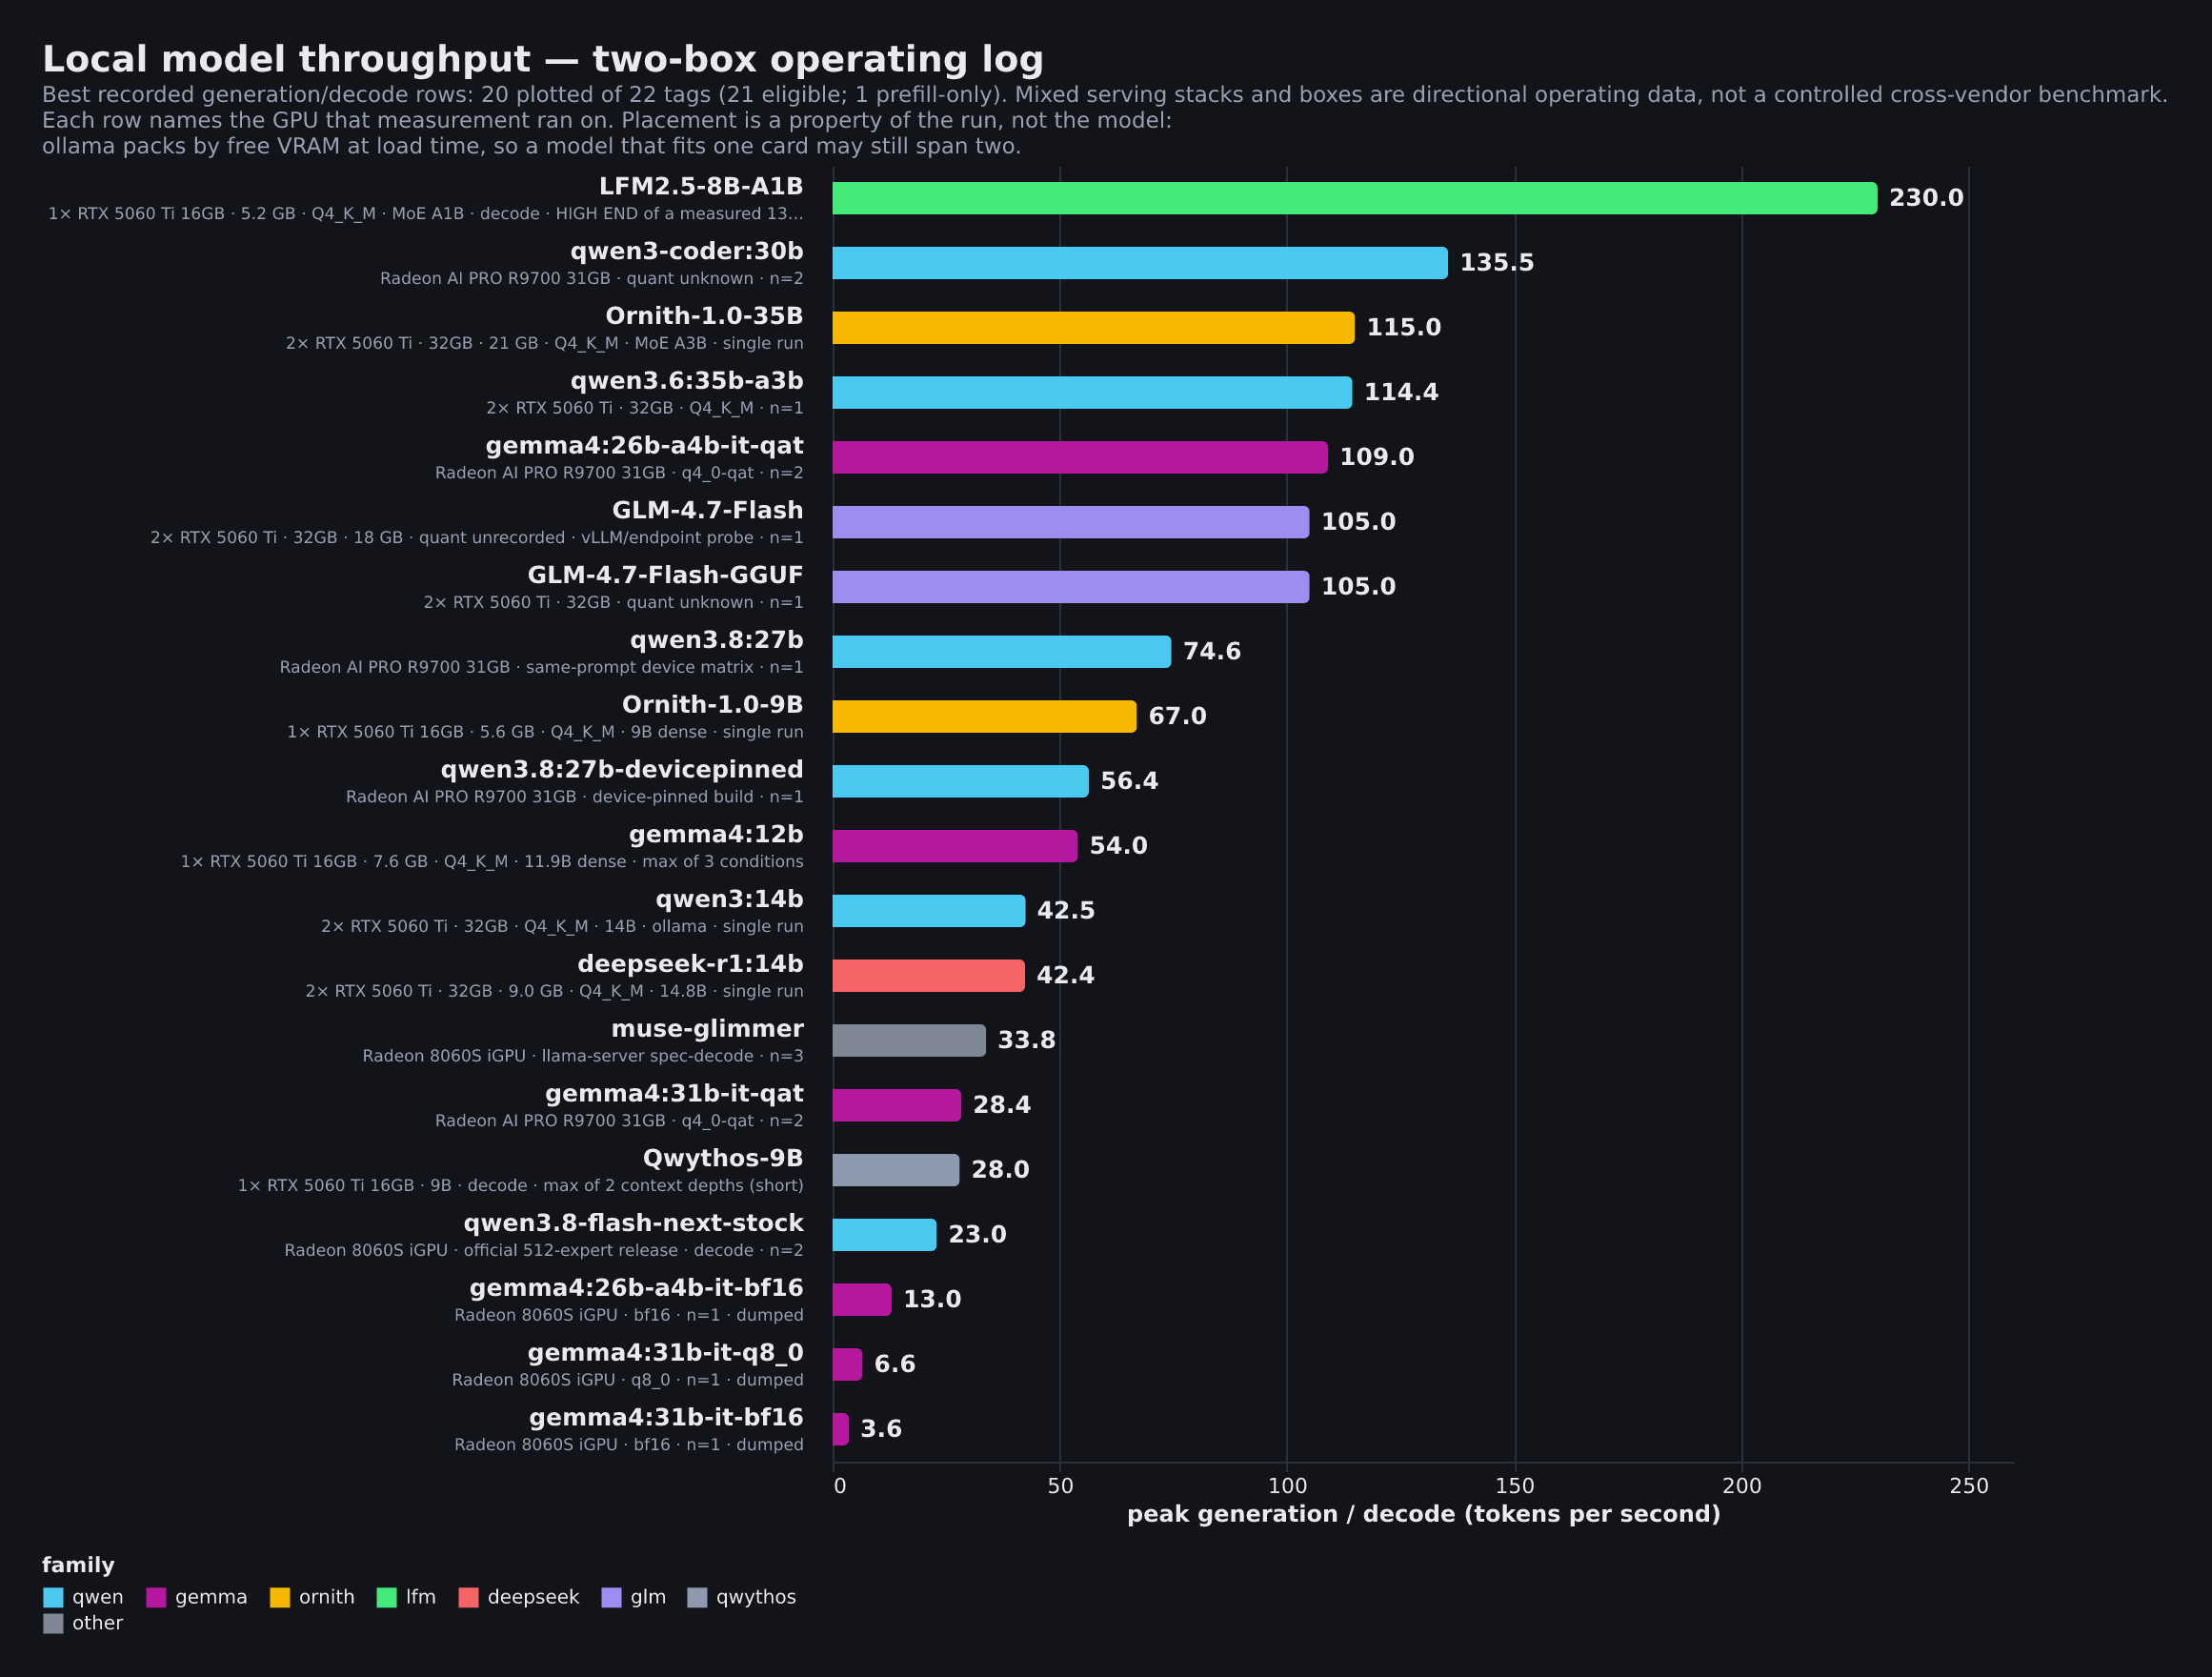
Best recorded row per model — each row names the GPU that measurement actually ran on,
then quantisation and run count. Placement is a property of the run rather than of the model:
ollama packs by free VRAM at load time, so a model small enough for one card may still be split
across two. Measured 2026-08-22 on Box A: ornith:9b is 5.6 GB and fits one card comfortably, yet
loaded as 5435 / 5315 MiB across both, while lfm:8b at 5.2 GB stayed on a single card.
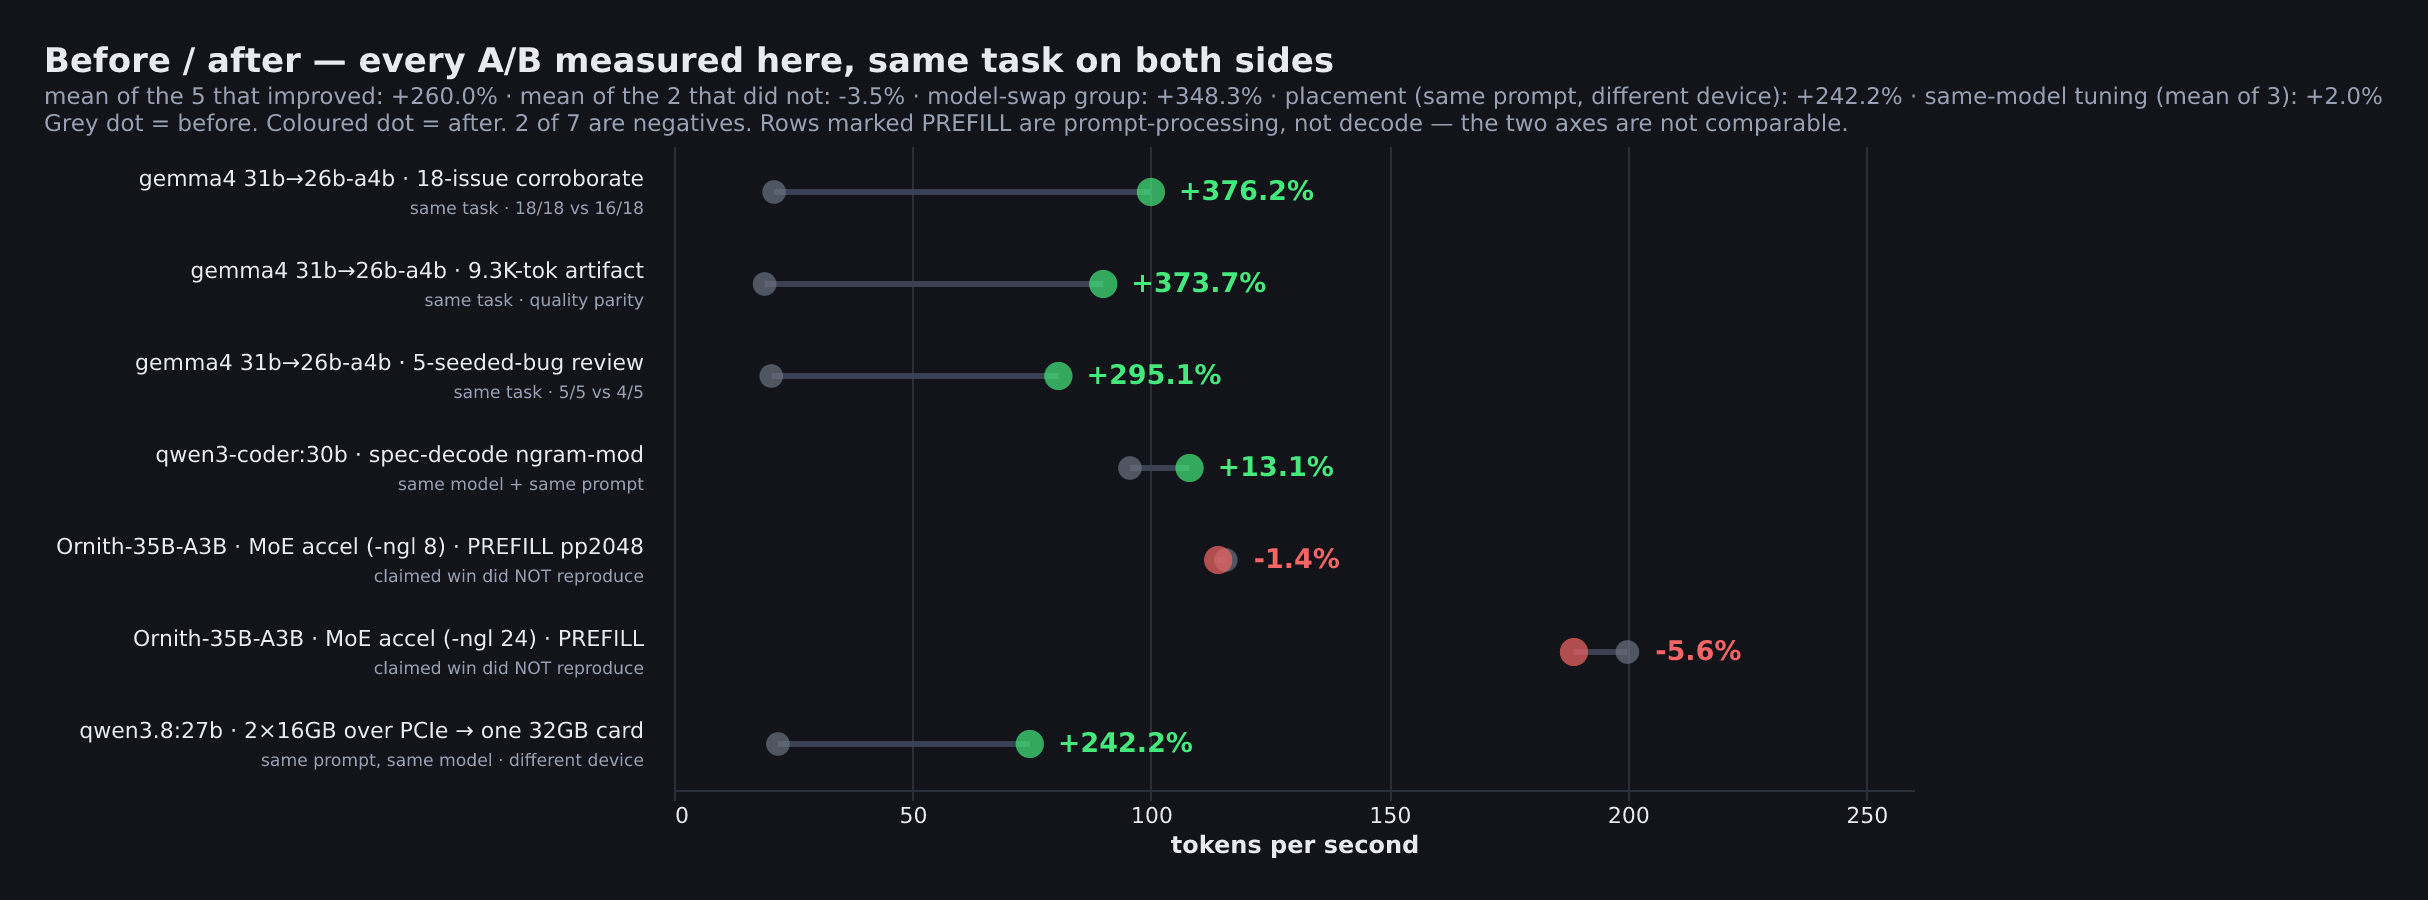
Before / after. Seven A/B pairs, grouped by what actually changed between the two runs: the
model, a flag on one model, or the device it landed on. Each pair holds the rest constant, and the
deltas below are the ones the chart already shows.
Model-swap (30.7B dense → 25.2B MoE): +376.2% / +373.7% / +295.1% tok/s on 18-issue
corroborate (21 → 100), the 9.3K-tok artifact (19 → 90), and the 5-seeded-bug review (20.4 → 80.6).
Group mean +348.3%. Seeded-bug recall on the two sets the chart labels: 18/18 vs 16/18 and 5/5 vs
4/5; the long-artifact row is quality parity. Auditor wall-clock on the 5-bug set: 41.2s → 20.5s.
Same-model tuning, three rows: +13.1% speculative decoding on qwen3-coder:30b (95.6 → 108.1
tok/s, n=2, same prompt), and −1.4% and −5.6% on llama.cpp pp2048 prefill (stock vs
MoE-offload accelerator, -ngl 8 and 24). Group mean +2.0%. Decode was not the prefill
measurement; the claimed offload win did not reproduce. The two red rows stay red.
Placement is its own group, one row: the same prompt and the same model on a different device.qwen3.8:27b runs 21.8 → 74.6 tok/s (+242.2%) moving off two 16 GB cards over PCIe onto a single
32 GB card. Nothing about the model or its flags changed, which is why it is not in either group
above.
The model-swap group's mean tok/s lift (~4.5×) is larger than that spec-decode lift (~1.13×) by about
4×. The two interventions did not share a task set; that comparison is the chart's group split.
The lane has since been re-derived on newer hardware under the standing rule: the best model on the
fastest capable GPU, thinking on for audit passes. The current pick is a different dense model from
the 30.7B replaced above — a dense 27B. On the same review prompt, same discrete card, measured
2026-08-29 20:31: 58.8 tok/s (dense 27B) vs 62.2 tok/s (25.2B MoE tagged 26b), within ~6%, timed
with the serving runtime's per-run stats (e.g. ollama run <tag> --verbose). The run count on those
CSV rows is blank because it was not recorded. That ~6% is this audit prompt only. The
peak-throughput chart, on the same card, shows the MoE at 109.0 tok/s and the dense model at 58.8 — a
different condition, nearly 2×. With reasoning enabled, seeded-bug review on this pair scored 5/5 and
the run surfaced seven further real bugs, at 1.8–4.6× wall time. The dense model is the slower of the
two on the audit prompt and is the audit pick on that quality result, not on speed. The 31b→26b A/B
rows above are the evidence the routing-swap first rested on; they are a different dense model.
A record that only keeps its wins is not a record.
Weights vs VRAM actually occupied. Runtime footprint does not scale with weight size —deepseek-r1:14b occupies 1.89× its 9 GB of weights once loaded, while qwen3.6:35b-a3b
occupies 1.09× its 23 GB. Sizing VRAM from model size alone goes badly wrong on the small model.
This panel is box-a-only, where those measurements exist.
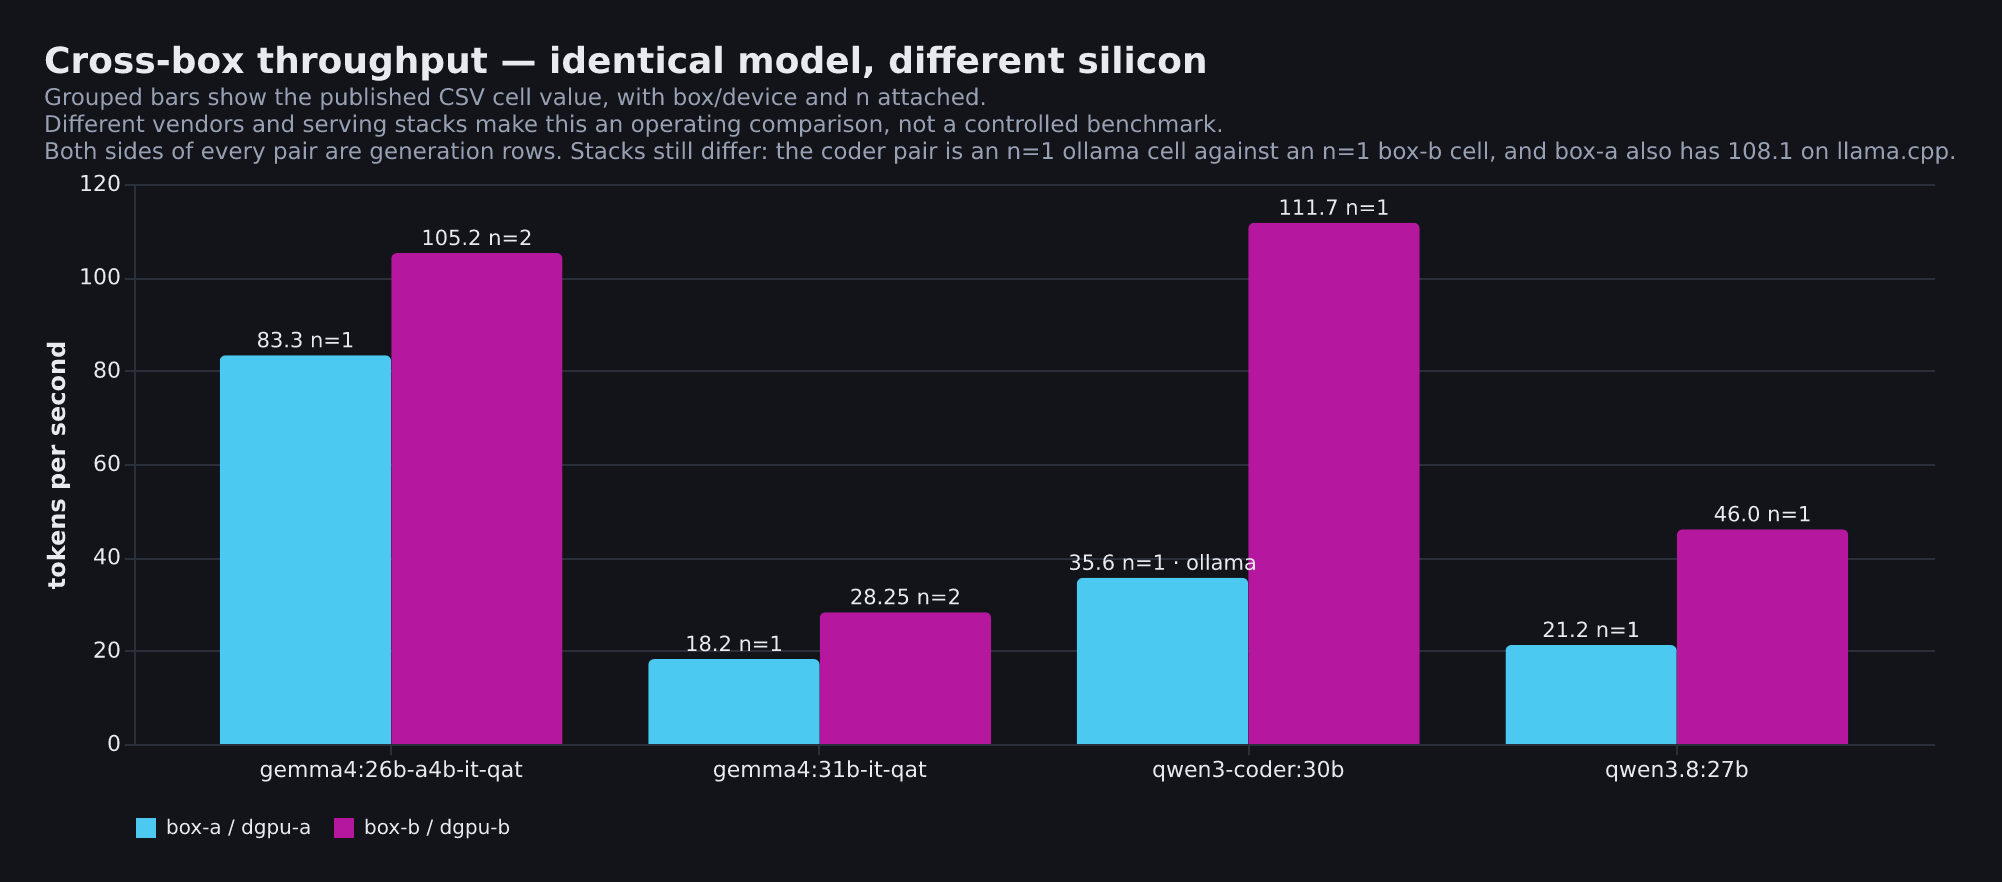
Cross-box. The headline comparison places identical model tags on box-a and box-b, grouped by box/device.
The bars do not turn differing stacks into a controlled benchmark.
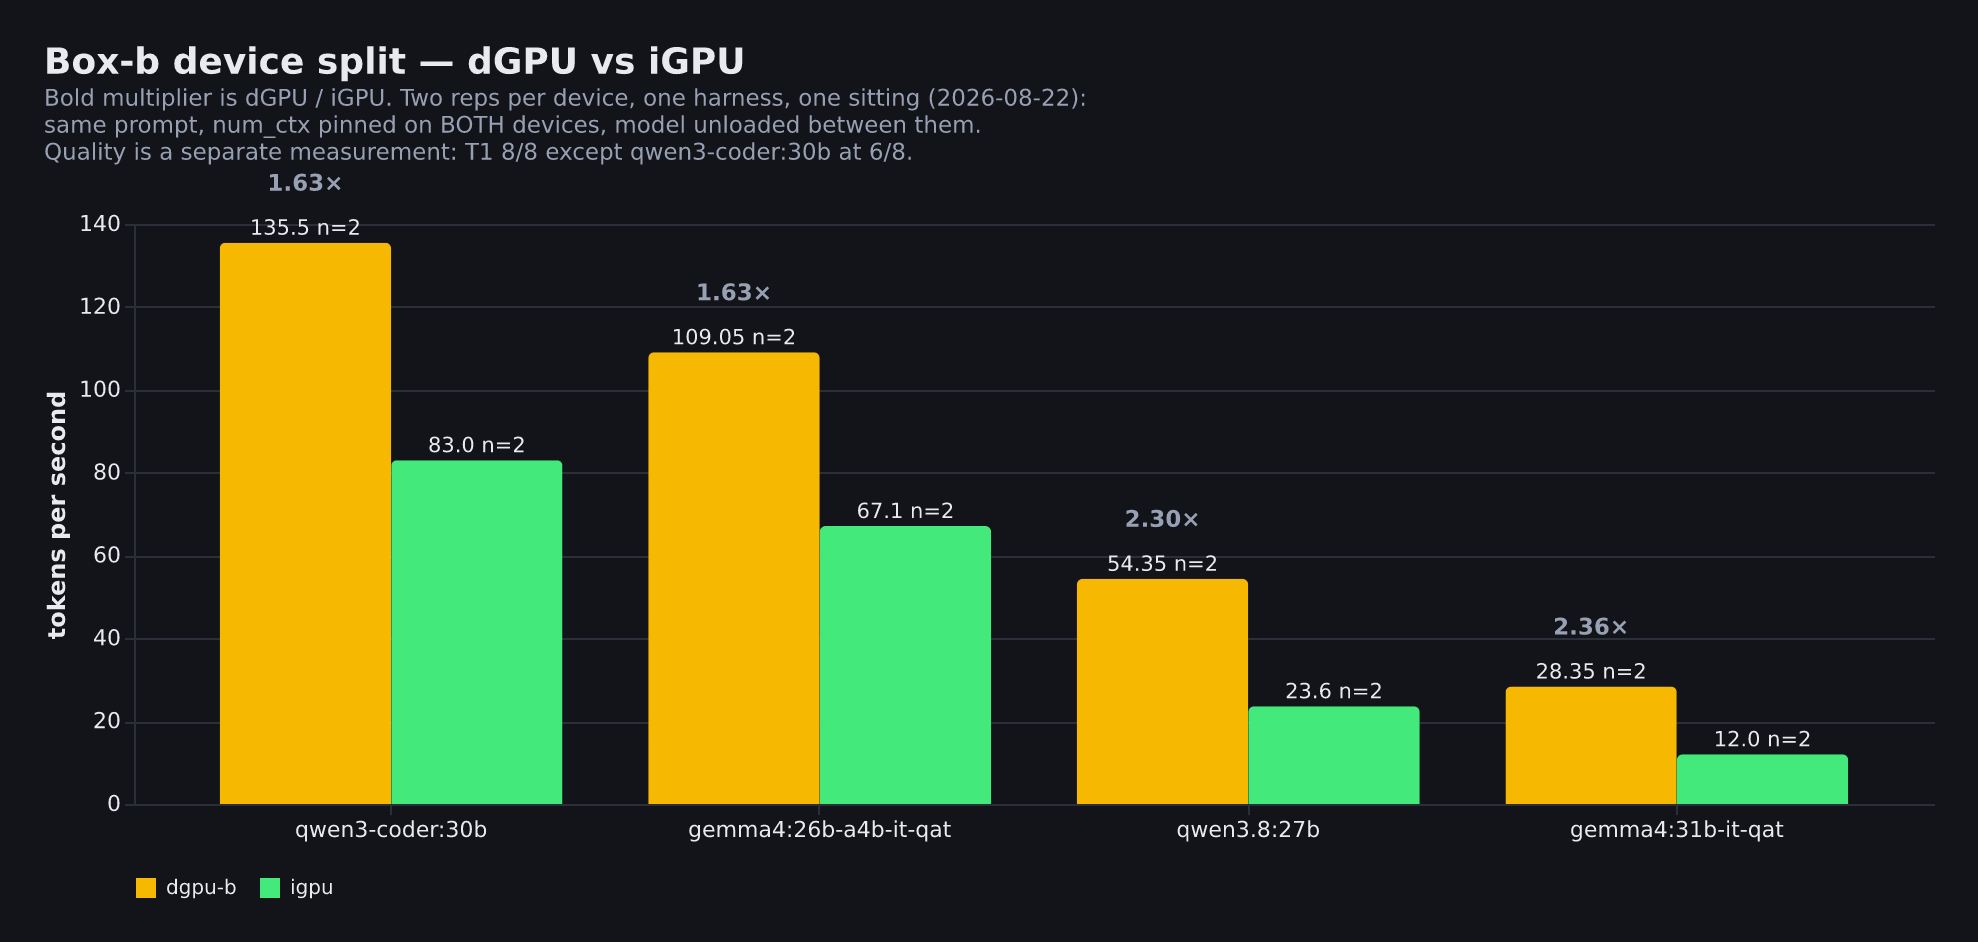
Box-b device split. Four models, each measured on both of Box B's GPUs in one sitting by the same
harness — same prompt, context pinned on both devices, model unloaded in between so the second
reading cannot silently reuse the first device. Each bar states its sample size.
bench/device_split_bench.py is the written-down method for those eight cells — the originals came from an ad-hoc command on the second box, and this file is that protocol recorded so the comparison can be
re-run rather than taken on trust. It drives one model onto each GPU through options.main_gpu,
discards a warm-up so model-load time is not counted as decode rate, and unloads between devices —
without that, the second request quietly reuses the copy already resident on the first device and the
run reports that device twice, which is the exact failure the benchmark exists to detect.
bench/make_charts.py regenerates all six images from the two CSVs, and fails closed before rendering:
exit 1 on chart/data disagreement or invalid power-study data, exit 2 when either source CSV is absent — unverifiable is not the same as clean.
Power before tuning: stock measurements, undervolt pending
I wanted to know whether undervolting could make inference faster, cooler and quieter than stock or overclocking, and whether MoE and dense models would respond differently. I measured stock first. I have not applied an undervolt, and I have neither tried nor planned an overclock.
I used gpu_bench.py, stdlib Python against ollama's generate API, with think:false, temperature 0 and seed 0. Each short test has n=5 after one discarded warm-up; throughput is the median. The retained runs report 65 prompt tokens for decode and 8796–8799 for the nominal 8k prefill. A per-run nonce was added after a repeated prompt was served from cache at 109k tok/s. That run was discarded before the retained set, so it is not among the published records; the fix it forced is. I sampled telemetry at 1 Hz; median power and clock statistics use active samples only (GPU utilization ≥10%), while maximum power and temperature use the entire request window. Hashes cover thinking plus response. Nonced prefill has no hash comparison, not a passing correctness check.
I ran gemma4:26b-a4b-it-qat (MoE, 25.2B total / 4B active, QAT) and qwen3.8:27b (dense, Q4-class) on both boxes using ollama 0.33.2. Both Box A cards carried each model over CUDA. Box B used discrete-card-pinned aliases over Vulkan (RADV GFX1201), not ROCm, not CUDA: discrete R9700 on PCIe x16 Gen5, not the iGPU unified-memory path. Its integrated GPU was excluded. These are operating measurements from different devices and stacks, not a controlled vendor comparison.
Box A's memory changed before this study: it now carries 4 × 16 GB at 3200 MT/s (64 GB) where the
throughput charts above were measured on a mismatched 4 × 8 GB kit running at 2933 MT/s (32 GB). Every Box A
measurement dated 2026-09-06 or later, this study included, is on the 64 GB configuration. I have not
re-measured the older charts on the new memory, so do not read a difference between this section and
chart 01 as an effect of anything I changed on the GPUs.
Box A: 2 × RTX 5060 Ti 16 GB, stock, 2026-09-06. Watts below are the sum of both cards, each capped at 180 W. Rates are tok/s; clock is MHz; temperature is the maximum reported GPU temperature.
| Configuration / requested generation cap | n | Prompt median | Generation median | W median / max | Max °C | Clock median / min | Hashes |
|---|---|---|---|---|---|---|---|
| MoE decode / 256 | 5 | 2114 | 106.4 | 146 / 149 | 53 | 2790 / 2752 | 5/5 identical |
| Dense decode / 256 | 5 | 350 | 23.0 | 190 / 196 | 69 | 2782 / 2745 | 5/5 identical |
| Dense prefill 8k / 32 | 5 | 1294 | 22.2 | 307 / 328 | 84 | 2745 / 2677 | n/a: nonce |
| MoE prefill 8k / 32 | 5 | 4214 | 87.2 | 187 / 250 | 76 | 2767 / 2700 | n/a: nonce |
I recorded clocks_event_reasons=0x0 in every Box A sample across these configurations. Dense 8k prefill was the nearest to its limits: maximum per-card draw 165 W against 180 W, maximum temperature 84 °C and fans reaching 100% (n=5). I saw no reported throttle reason in this sweep; that is not a claim about every possible workload. I will leave Box A unchanged.
Box B: Radeon AI PRO R9700 32 GB, stock, 2026-09-06, Vulkan (RADV GFX1201), not ROCm. Watts are discrete-board power against a 300 W cap. Temperatures are junction readings, not directly comparable to Box A's GPU temperature. Rates are tok/s; clock is MHz.
| Configuration / requested generation cap | n | Prompt median | Generation median | W median / max | Max junction °C | Clock median / min | Hashes |
|---|---|---|---|---|---|---|---|
| MoE decode / 256 | 5 | 1921 | 110.0 | 227 / 231 | 52 | 3394 / 3259 | 5/5 identical |
| Dense decode / 256 | 5 | 466 | 53.5 | 300 / 304 | 73 | 2751 / 2541 | 5/5 identical |
| Dense prefill 8k / 32 | 5 | 880 | 70.7 | 299 / 303 | 87 | 2655 / 2154 | n/a: nonce |
| MoE prefill 8k / 32 | 5 | 3385 | 101.1 | 287 / 300 | 82 | 2850 / 1603 | n/a: nonce |
| Dense decode, 15-minute sustain / 512 | 107 | 426 | 48.5 | 299 / 316 | 87 | 2656 / 519 | 107/107 identical |
In that Box B sustain run (n=107 requests), first-minute decode was 48.61 tok/s at 2684 MHz and last-minute decode 48.49 tok/s at 2656 MHz. Junction temperature peaked at 87 °C; memory temperature reached 88 °C, and the recorded maximum fan speed was 3273 rpm. The original summary took the maximum over all sensors and called it 88 °C; I keep the junction and memory readings separate here. I saw essentially flat first-to-last-minute throughput over those 15 minutes. The sustain requested up to 512 generated tokens and returned 398 in each retained request, versus 256 in each short decode request. It used longer generations than the short decode test, so I do not call their different medians thermal droop. Repeated hashes establish output repeatability for this prompt, not general model accuracy.
On the evening of 2026-09-06 I rebooted Box B with amdgpu.ppfeaturemask=0xfff7ffff, adding only the overdrive bit 0x4000 to the previous 0xfff7bfff. This exposed pp_od_clk_voltage: OD_VDDGFX_OFFSET stayed at 0 mV (available range −200..0), and OD_SCLK_OFFSET stayed at 0 MHz (−500..+1000). The reported maximum cap rose from 300 to 330 W; the applied cap stayed 300 W. The kernel logged “Overdrive is enabled.” I changed access to the controls, not voltage, clocks or the applied power cap.
My Box B dense-decode parity check after that reboot (n=3, 256 generated tokens per run) recorded 54.1 tok/s (53.9–54.1), prompt median 444 tok/s, 299 W median / 308 W maximum and clock 2790 MHz median / 2496 minimum, with maximum junction temperature 63 °C. All 3/3 golden hashes were identical to stock. That is consistent with retained stock behavior in this check; it is not an undervolt gain or a statistical equivalence test.
My reading, not a tuning result: batch-1 decode is expected to be memory-bandwidth-bound, while long-prompt prefill is more compute-bound. MoE decode touches fewer active bytes per token, so I expect less sensitivity to core voltage and clock than dense. The stock data makes dense work on Box B the useful candidate: dense decode sat at 300 W median versus MoE decode at 227 W (n=5 each), and its long prefills approached the cap. MoE prefill's 287 W median / 300 W maximum (n=5) does not establish that it was continuously cap-bound. The sustained dense run reached 87 °C junction and 88 °C memory, with essentially flat first-to-last-minute throughput.
My expectation, without undervolt samples: I expect little or no speed change on Box A. On Box B, a voltage offset at the same 300 W cap might retain speed with less heat and fan demand, or help a workload constrained by that cap. No acoustic measurements were taken. A speed benefit needs a binding limit; even an efficiency benefit needs power draw to reduce. This is not evidence for a fleet speed upgrade.
My planned Box B ladder is −60/−80/−100/−120 mV at 300 W, with greedy golden-output checks, kernel-log monitoring, a junction-temperature abort rule and a long hot run before accepting a setting. Silent output corruption matters even when nothing crashes. A lower power-cap arm is only a possibility; neither arm has run. Box A stays stock.
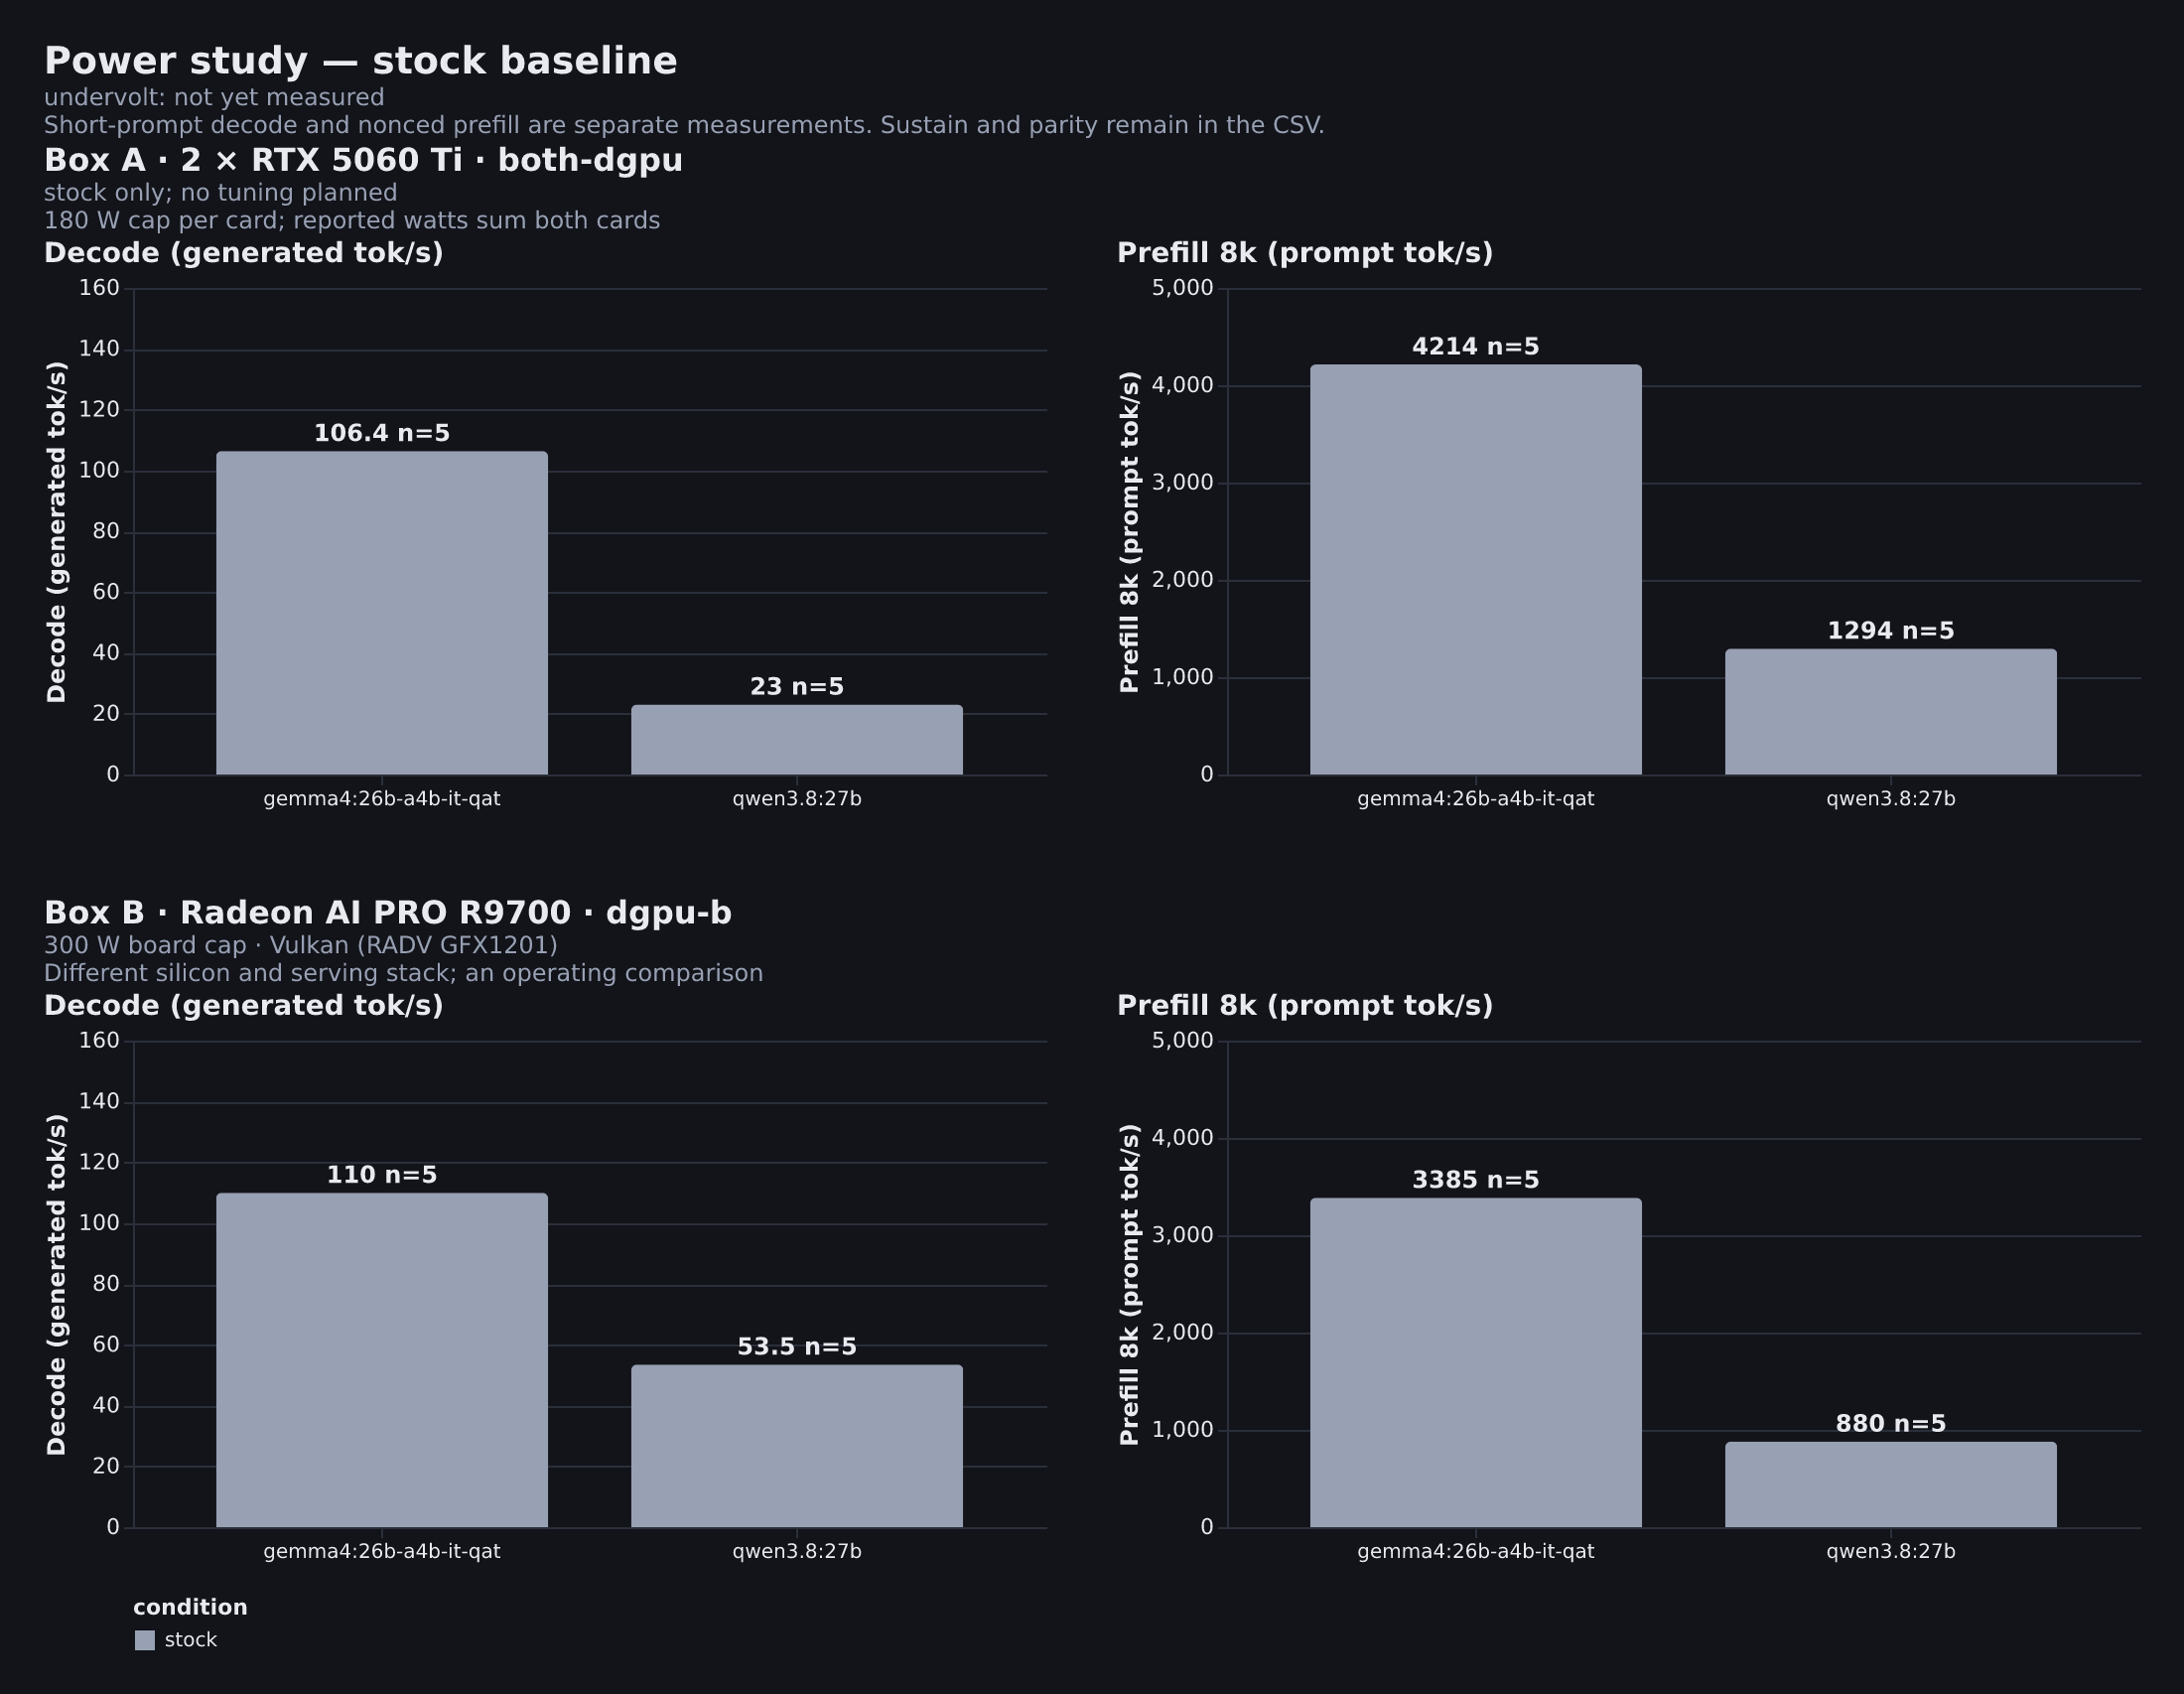
Chart 06 reads bench/power_undervolt.csv: one panel per box, with separate decode and prefill facets and sample sizes on every bar. Today it shows eight stock bars and “undervolt: not yet measured”; Box A is marked “stock only; no tuning planned.” I keep the sustain and post-reboot parity rows in the CSV, outside the plot. Actual comparison bars require measured ladder rows with setting-specific correctness and hot-run acceptance evidence.
I list the six instrument defects exposed by running the harness in bench/README.md.
The boxes
Published so a reader can size their own hardware against the numbers. Box A is deliberately
mismatched, mainstream, lane-starved hardware — that is the point, not an apology.
Box A — where the original charts were measured
| GPU | 2 × NVIDIA RTX 5060 Ti, 16 GB GDDR7 each (32 GB total) · Blackwell, compute capability 12.0 (sm_120) · driver 595.84 (stock power study, 2026-09-06; earlier charts recorded 595.71.05), CUDA 13.2 toolkit (one llama.cpp binary in the log was built against 13.3) |
| CPU | AMD Ryzen 7 5800XT — 8 cores / 16 threads, rated boost 4.8 GHz (≈4.97 GHz observed under PBO) |
| Motherboard | MSI MAG B550 TOMAHAWK MAX WIFI — AM4, a mainstream 2020-era board. One GPU runs at PCIe 4.0 x8, the other at PCIe 3.0 x4 (chipset slot). Neither gets a full x16 link. |
| RAM | 64 GB DDR4 (60.7 GiB usable) + 8 GB swap — 4 × 16 GB, all four DIMMs running at 3200 MT/s (MemTotal 63665876 kB; dmidecode reports Speed and Configured Memory Speed 3200 for every slot, measured 2026-09-07). This is the configuration for every measurement dated 2026-09-06 or later, which is the power study and chart 06. Before that it was 32 GB (30 GB usable) as 4 × 8 GB settling at 2933 MT/s, deliberately mismatched: 3 × DDR4-3200 CL16 single-rank + 1 × DDR4-3000 CL15 dual-rank, so the controller ran below both kits' ratings. Every Box A row in bench/local_model_throughput.csv, and the Box A share of charts 01–05, was measured on that older mismatched kit; the Box A source rows that carry a date fall between 2026-08-21 and 2026-08-23, all before the memory change; the rest of that log is undated in the CSV itself. Box B rows are a different machine and are unaffected by this box's memory. Both configurations are stated because the memory changed between the two sets of numbers. |
| Storage | 2 TB internal NVMe for models and working state; 1 TB USB-attached NVMe for backups |
| OS | Ubuntu 26.04 LTS, kernel 7.0.0-31-generic |
| GPU power | Applied stock limit 180 W per RTX 5060 Ti; both cards remain stock |
| Serving stack | ollama 0.33.2 over CUDA (stock power study, 2026-09-06) |
Box B — the second box (added 2026-08-22)
| APU | AMD Ryzen AI MAX+ 395 ("Strix Halo") — 32 threads, with integrated Radeon 8060S graphics |
| Discrete GPU | AMD Radeon AI PRO R9700 (Navi 48, RDNA 4, gfx1201) — ~31.9 GiB usable VRAM (32624 MiB measured; 32 GB SKU) |
| iGPU | Radeon 8060S on unified memory — the same pool as system RAM, so "VRAM" is an allocation, not a fixed partition |
| Memory | 122 GiB LPDDR5-8000, shared between CPU and iGPU |
| Chassis | GMKtec EVO-X3 mini-PC |
| Serving stack | ollama 0.33.2 over Vulkan (RADV GFX1201) (previously documented 0.32.15) — not ROCm, not CUDA; a different kernel path from Box A entirely |
| dGPU link | PCIe x16 Gen5 |
| dGPU power | Applied board cap 300 W (default 300 W; minimum 210 W); exposed maximum 330 W after enabling overdrive, previously 300 W |
| Kernel arg | amdgpu.ppfeaturemask=0xfff7ffff; only overdrive bit 0x4000 added to the previous 0xfff7bfff; voltage offset 0 mV (range −200..0), clock offset 0 MHz, cap 300 W |
| OS | Ubuntu 26.04 LTS, kernel 7.0.0-31-generic (Server Edition) |
Server Edition headless setup allows for the maximum amount of resources can be allocated to compute instead of a desktop. Box A controls Box B over ssh.
Why the two boxes are not a controlled comparison. They differ in vendor (NVIDIA/CUDA vs
AMD/Vulkan), memory architecture (discrete VRAM vs a unified pool), and serving stack. A row that is
faster on Box B is not evidence that AMD beats NVIDIA — it is evidence that this model, at this
quantisation, on this stack ran at that rate. The value of publishing both is the shape: which
models tolerate an iGPU, where the dGPU/iGPU gap actually lands, and which quantisations are worth
keeping. Read the device and serving_stack columns before comparing any two rows.
The gap splits by architecture, not by size. Across the four models measured on both devices,
the ratio lands in two tight groups — and they are not the groups you would guess from parameter
count:
| model | params | experts (GGUF metadata) | dGPU / iGPU |
|---|---|---|---|
qwen3-coder:30b |
30.5B | 128, 8 used | 1.63× |
gemma4:26b-a4b-it-qat |
25.2B | 128, 8 used | 1.63× |
qwen3.8:27b |
27.3B | none — dense | 2.30× |
gemma4:31b-it-qat |
30.7B | none — dense | 2.36× |
The expert counts are read from each model's GGUF metadata, not inferred from its name. The two
sparse models carry the same configuration — 128 experts, 8 used — from different vendors, and
land on the same ratio to two decimal places; both dense models sit near 2.3×.
The likely mechanism is that a sparse model does less arithmetic per token, so it is less punished
by the iGPU's weaker compute, while both architectures pay the same memory-bandwidth penalty — but
that is the explanation the numbers suggest, not something this benchmark isolates. Two models
per group is thin evidence for a rule. What it is good enough for is a routing default: if a job
has to run on the iGPU, prefer the sparse model.
The iGPU is the interesting result. A 26B MoE at 67 tok/s on integrated graphics — using a
slice of the same LPDDR5 the CPU is using — is the row most likely to change what someone buys, because
it needs no discrete card at all.
The guard ladder
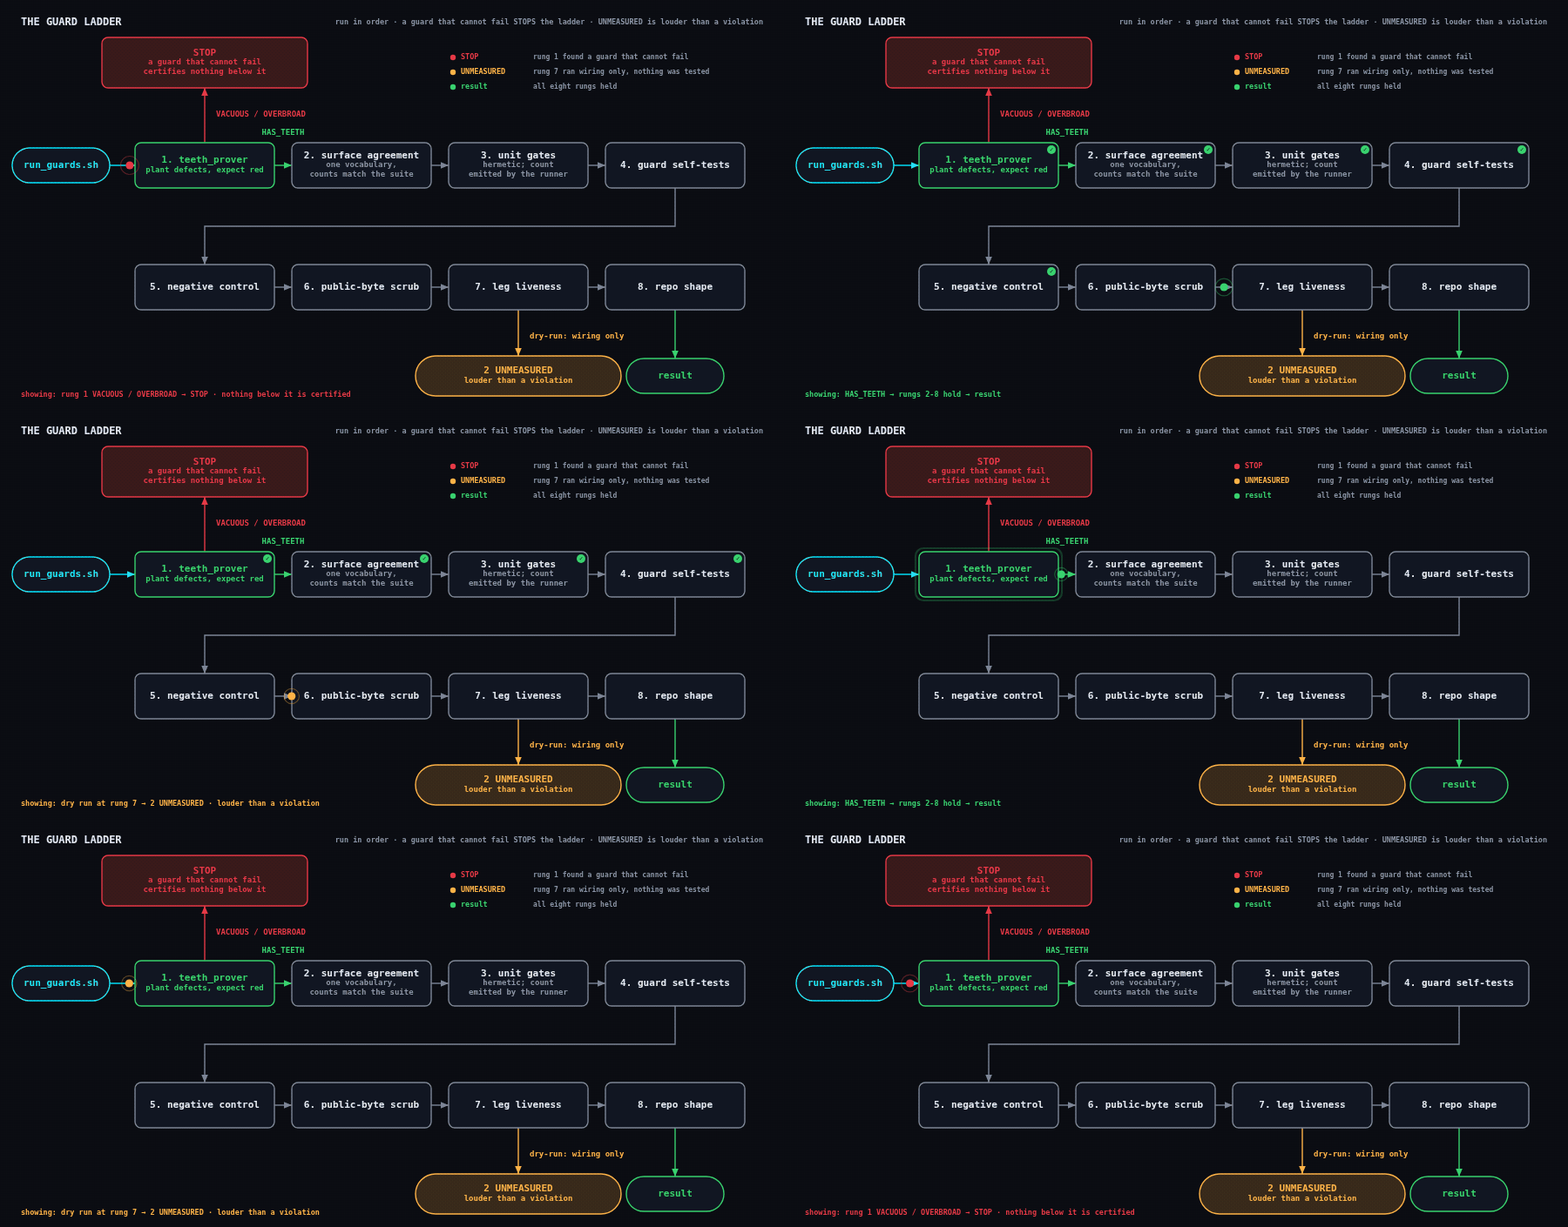
flowchart LR
    S([run_guards.sh]) --> T1["1. teeth_prover <br/>plant defects, expect red"]
    T1 -->|HAS_TEETH| T2["2. surface agreement <br/>one vocabulary, counts match the suite"]
    T1 -->|VACUOUS / OVERBROAD| X1["STOP - a guard that cannot fail <br/>certifies nothing below it"]
    T2 --> T3["3. unit gates <br/>hermetic; count emitted by the runner"]
    T3 --> T4["4. guard self-tests"]
    T4 --> T5["5. negative control"]
    T5 --> T6["6. public-byte scrub"]
    T6 --> T7["7. leg liveness"]
    T7 -->|dry-run: wiring only| UM(["2 UNMEASURED <br/>louder than a violation"])
    T7 --> T8["8. repo shape"]
    T8 --> OK([result])
    style X1 fill:#3a1a1a,stroke:#e63946
    style UM fill:#3a2a1a,stroke:#ffb347
The honesty stop gate — a guard that watches the agent's words
The ladder above proves artifacts can fail visibly. One guard turns the same law on the agent's own
claims: a Stop hook that refuses to end a turn asserting live state
("the job is running", "all three legs completed") the turn never measured. It reads the current turn,
finds live-state claims in the prose and verification commands in the tool calls, and blocks when a
claim has no same-turn, same-subject check — because reporting an intention as an observation feels
identical from the inside and no advisory rule catches it. It carries its own teeth (--self-test
proves it still blocks an unbacked claim and passes a backed one), and adapting it to another stack is
a guided step, not a copy-paste: skills/honesty-stop-gate forces
the adopting AI to confirm every verification command actually exists on the target box — a check
pointed at a missing command is a stair to nowhere that reads as coverage and delivers none.
Same teeth, different rung count
The laws are the same; consequence and reversibility decide the rung count. See the canonical
rigor spectrum before importing a larger inventory.
| Pattern-library workflow | User-facing app, updater, or long-lived corpus |
|---|---|
| Prove a few guards can fail; add a guard after a named failure mode. | Keep the same base, then add release rehearsals and broader invariants for the actual blast radius. |
| Accept a narrowly scoped check that rejects its unknowns. | Rehearse cross-surface and rollback failures before release. |
| Stop after five copied practices when the project is reversible. | Fund more rungs when users, self-updates, or irreversible corpus changes justify them. |
If you only take one thing: copy the five baseline practices in the rigor guide, then add rungs only for a named risk.
Two critical skill patterns
A report is not an artifact (from the dispatch/verification skills — both directions):
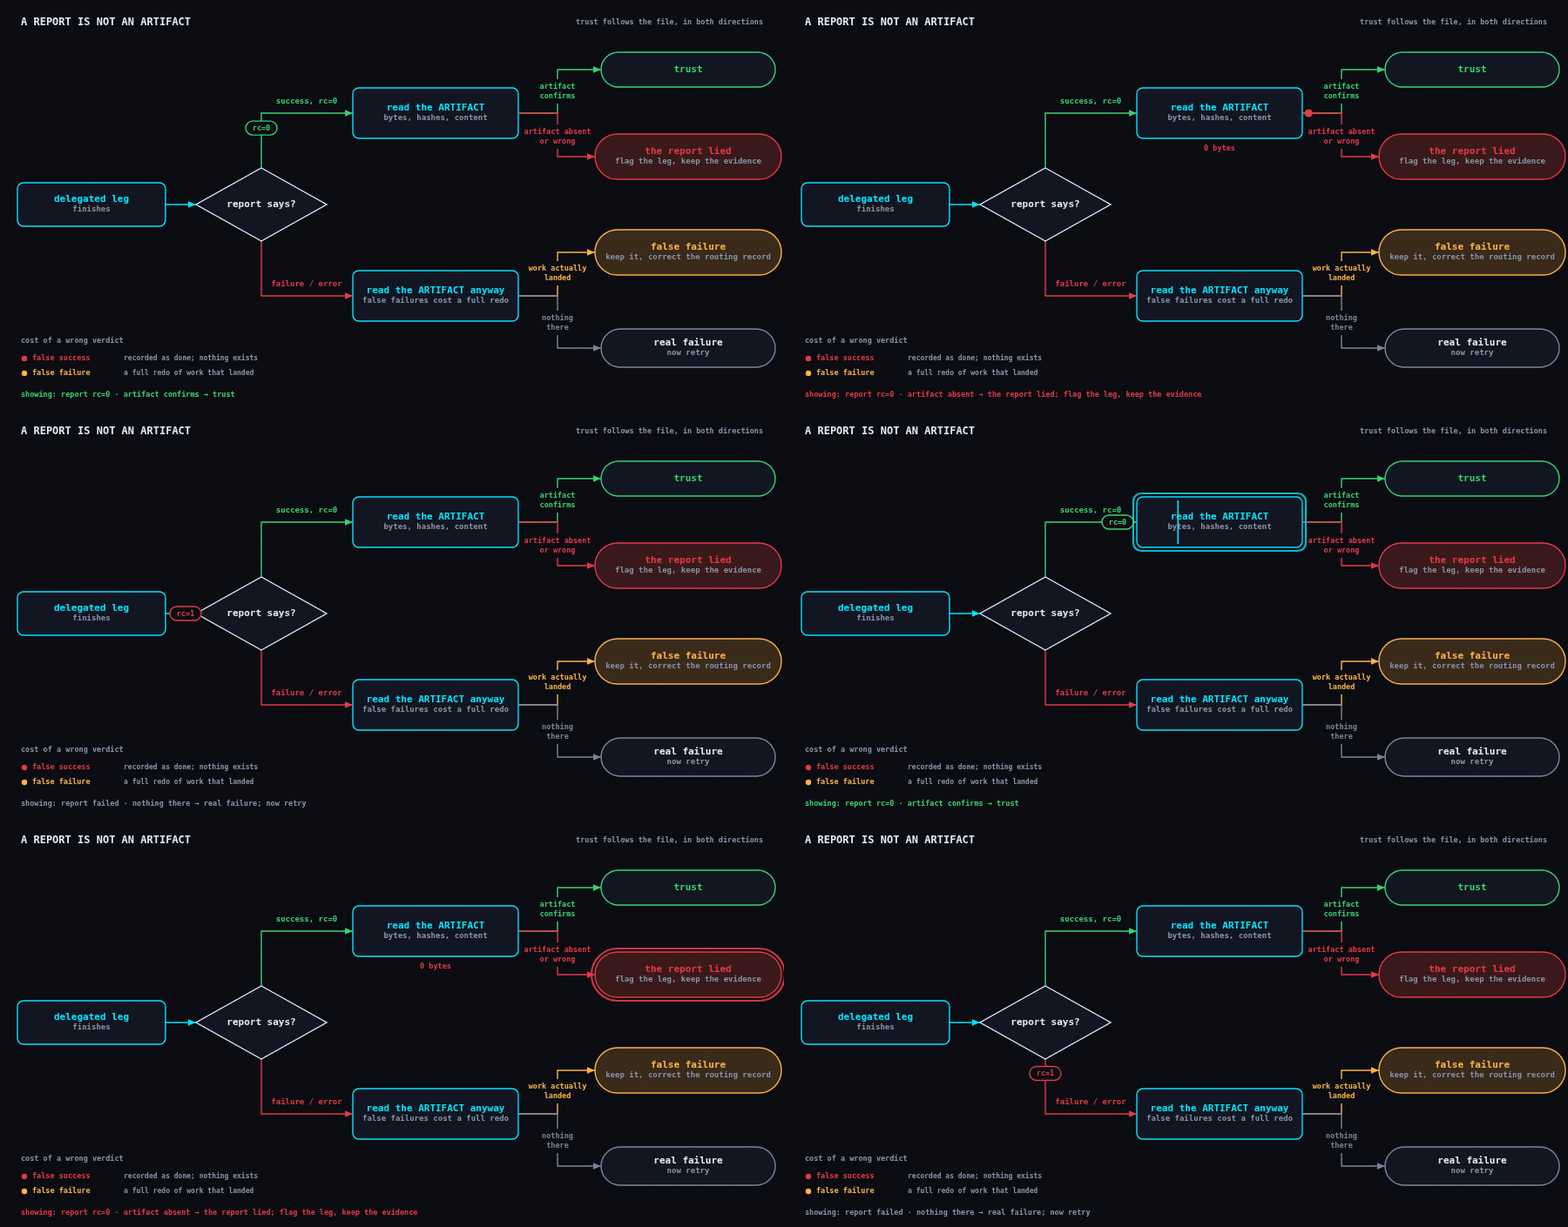
flowchart LR
    L[delegated leg finishes] --> R{"report says?"}
    R -->|"success, rc=0"| A1["read the ARTIFACT <br/>bytes, hashes, content"]
    R -->|"failure / error"| A2["read the ARTIFACT anyway <br/>false failures cost a full redo"]
    A1 -->|artifact confirms| OK([trust])
    A1 -->|artifact absent or wrong| BAD(["the report lied - flag the leg, keep the evidence"])
    A2 -->|work actually landed| SAVE(["false failure - keep it, <br/>correct the routing record"])
    A2 -->|nothing there| RETRY(["real failure - now retry"])
Why the routing table looks like that
Routine bounded labor is local-first; decompose before escalation; choose the cheapest capable role;
use cloud as support; apply token thrift to metered cloud work, not free local generation; and gate
effort bumps with evidence. The canonical procedures remain model-routing-table
and fleet-model-routing; use the routing decision record to record a local choice.
| Posture | Route | Stop paying for |
|---|---|---|
| One subscription, no GPU | Standing-effort subscription; draft/review as roles | unattended high-effort loops and spare APIs |
| +1 16 GB GPU | Local routine work; cloud review or hard/long work | paid boilerplate generation |
| +2nd cloud subscription | Use only for independent or capacity-bound work | duplicate default labor |
| Two boxes | Local labor on both; cloud support/escalation | cloud orchestration plus routine cloud legwork |
If you only take one thing: record why a route earned escalation and what evidence would change it.
Audit the test before trusting it (from skills/eval-integrity):
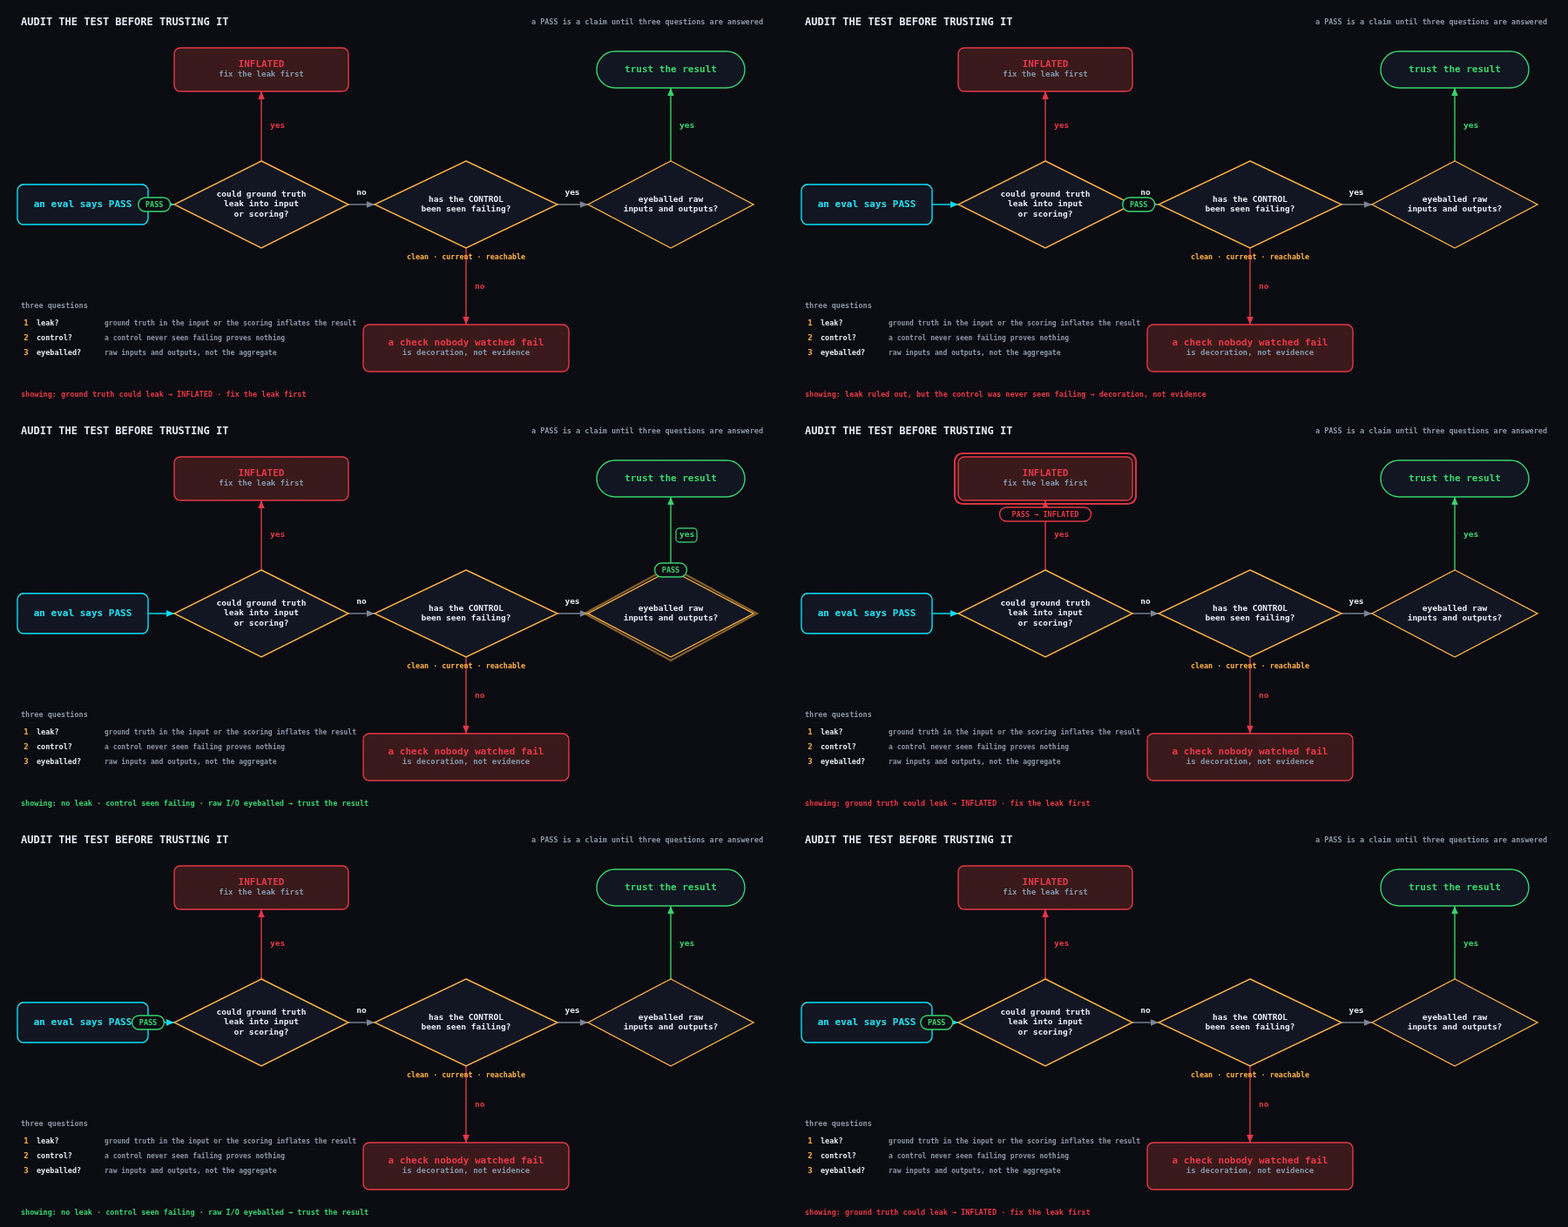
flowchart TD
    E[an eval says PASS] --> Q1{"could ground truth <br/>leak into input or scoring?"}
    Q1 -->|yes| INF["INFLATED - fix the leak first"]
    Q1 -->|no| Q2{"has the CONTROL been seen failing? <br/>clean - current - reachable"}
    Q2 -->|no| DEC["a check nobody watched fail <br/>is decoration, not evidence"]
    Q2 -->|yes| Q3{"eyeballed raw inputs <br/>and outputs?"}
    Q3 -->|yes| T([trust the result])
    style DEC fill:#3a1a1a,stroke:#e63946
    style INF fill:#3a1a1a,stroke:#e63946
Provenance & sanitization
Everything here was exported one-way from a private working system through a gated pipeline:
mechanical sanitization → provenance wall-check → zero-hit secret/personal-data scan → user review
per batch. Paths are genericized; network examples use RFC5737 documentation addresses; measured
numbers are labeled as measured on the reference setup.
Related: ParaKit — the desktop application whose
multi-agent development workflow drove most of these disciplines into existence.
Prior art & adaptations
Not everything here was invented from scratch. Much of this repo's value is in assembling, hardening,
and generalizing techniques — and several components are adapted from, or build on, existing
open-source work. Each is credited inline where it lives; consolidated here:
- Odyssey Hub (the proposed
odyssey_crawl_hub.py, not shipped;
design specification and its editorial presentation) — the deterministic "the model
emits markdown, a renderer styles it" design and its visual treatment are adapted from Odysseus,
PewDiePie's multi-agent workspace tool (specifically itsvisual_report.py). The name deliberately
stays in that family; the data model and the fleet pipeline around it are this repo's. - Solo-Rich Report — the long-form writer scaffold is adapted from Tongyi WebWeaver.
- Leg-failure classification — adapted from opencode's retry classifier (
session/retry.ts). guard/verification stack — adapted from the_breaker/layer of the desktop application this
project was exported from. (ParaKit)
If I've adapted your work and the credit here is wrong or missing, open an issue — I'd rather correct
it than leave it implicit.
License
MIT — see LICENSE.
Yorumlar (0)
Yorum birakmak icin giris yap.
Yorum birakSonuc bulunamadi