homelab-monitor
Health Gecti
- License — License: MIT
- Description — Repository has a description
- Active repo — Last push 0 days ago
- Community trust — 34 GitHub stars
Code Basarisiz
- rm -rf — Recursive force deletion command in .github/workflows/stats.yml
Permissions Gecti
- Permissions — No dangerous permissions requested
Bu listing icin henuz AI raporu yok.
Plug-and-play homelab dashboard in one container — GPU, local-AI VRAM, Docker, systemd, host health. Built-in read-only MCP server so AI agents can explore it too.
🛰️ HomeLab Monitor


One page for your whole home lab & AI rig — GPU, containers, services, disks. No agents, no Prometheus/Grafana, no cloud.
Your home lab grew into a couple of machines, a Pi, and a GPU that's mysteriously always busy. HomeLab Monitor gives you one self-hosted page that answers the real questions: which model is holding the GPU, which container is eating RAM, what's filling your disks, and is anything down — across every box over SSH: Linux, a Pi, even Windows. Readable from your phone over the VPN.
Get started
# Grab the compose file and go. No GPU required — the GPU panels just light up when one's present.
curl -fsSLO https://raw.githubusercontent.com/SikamikanikoBG/homelab-monitor/main/docker-compose.yml
docker compose up -d
Open http://<your-host>:9800 and you're done. Full options (from source, GPU toolkit, Windows/WSL2) → Install docs.
🆕 v0.14.0 — a built-in read-only MCP server: connect Claude (or any MCP client) to your homelab and explore it with full dashboard parity, no extra container. Release notes · changelog · MCP docs.
What you get
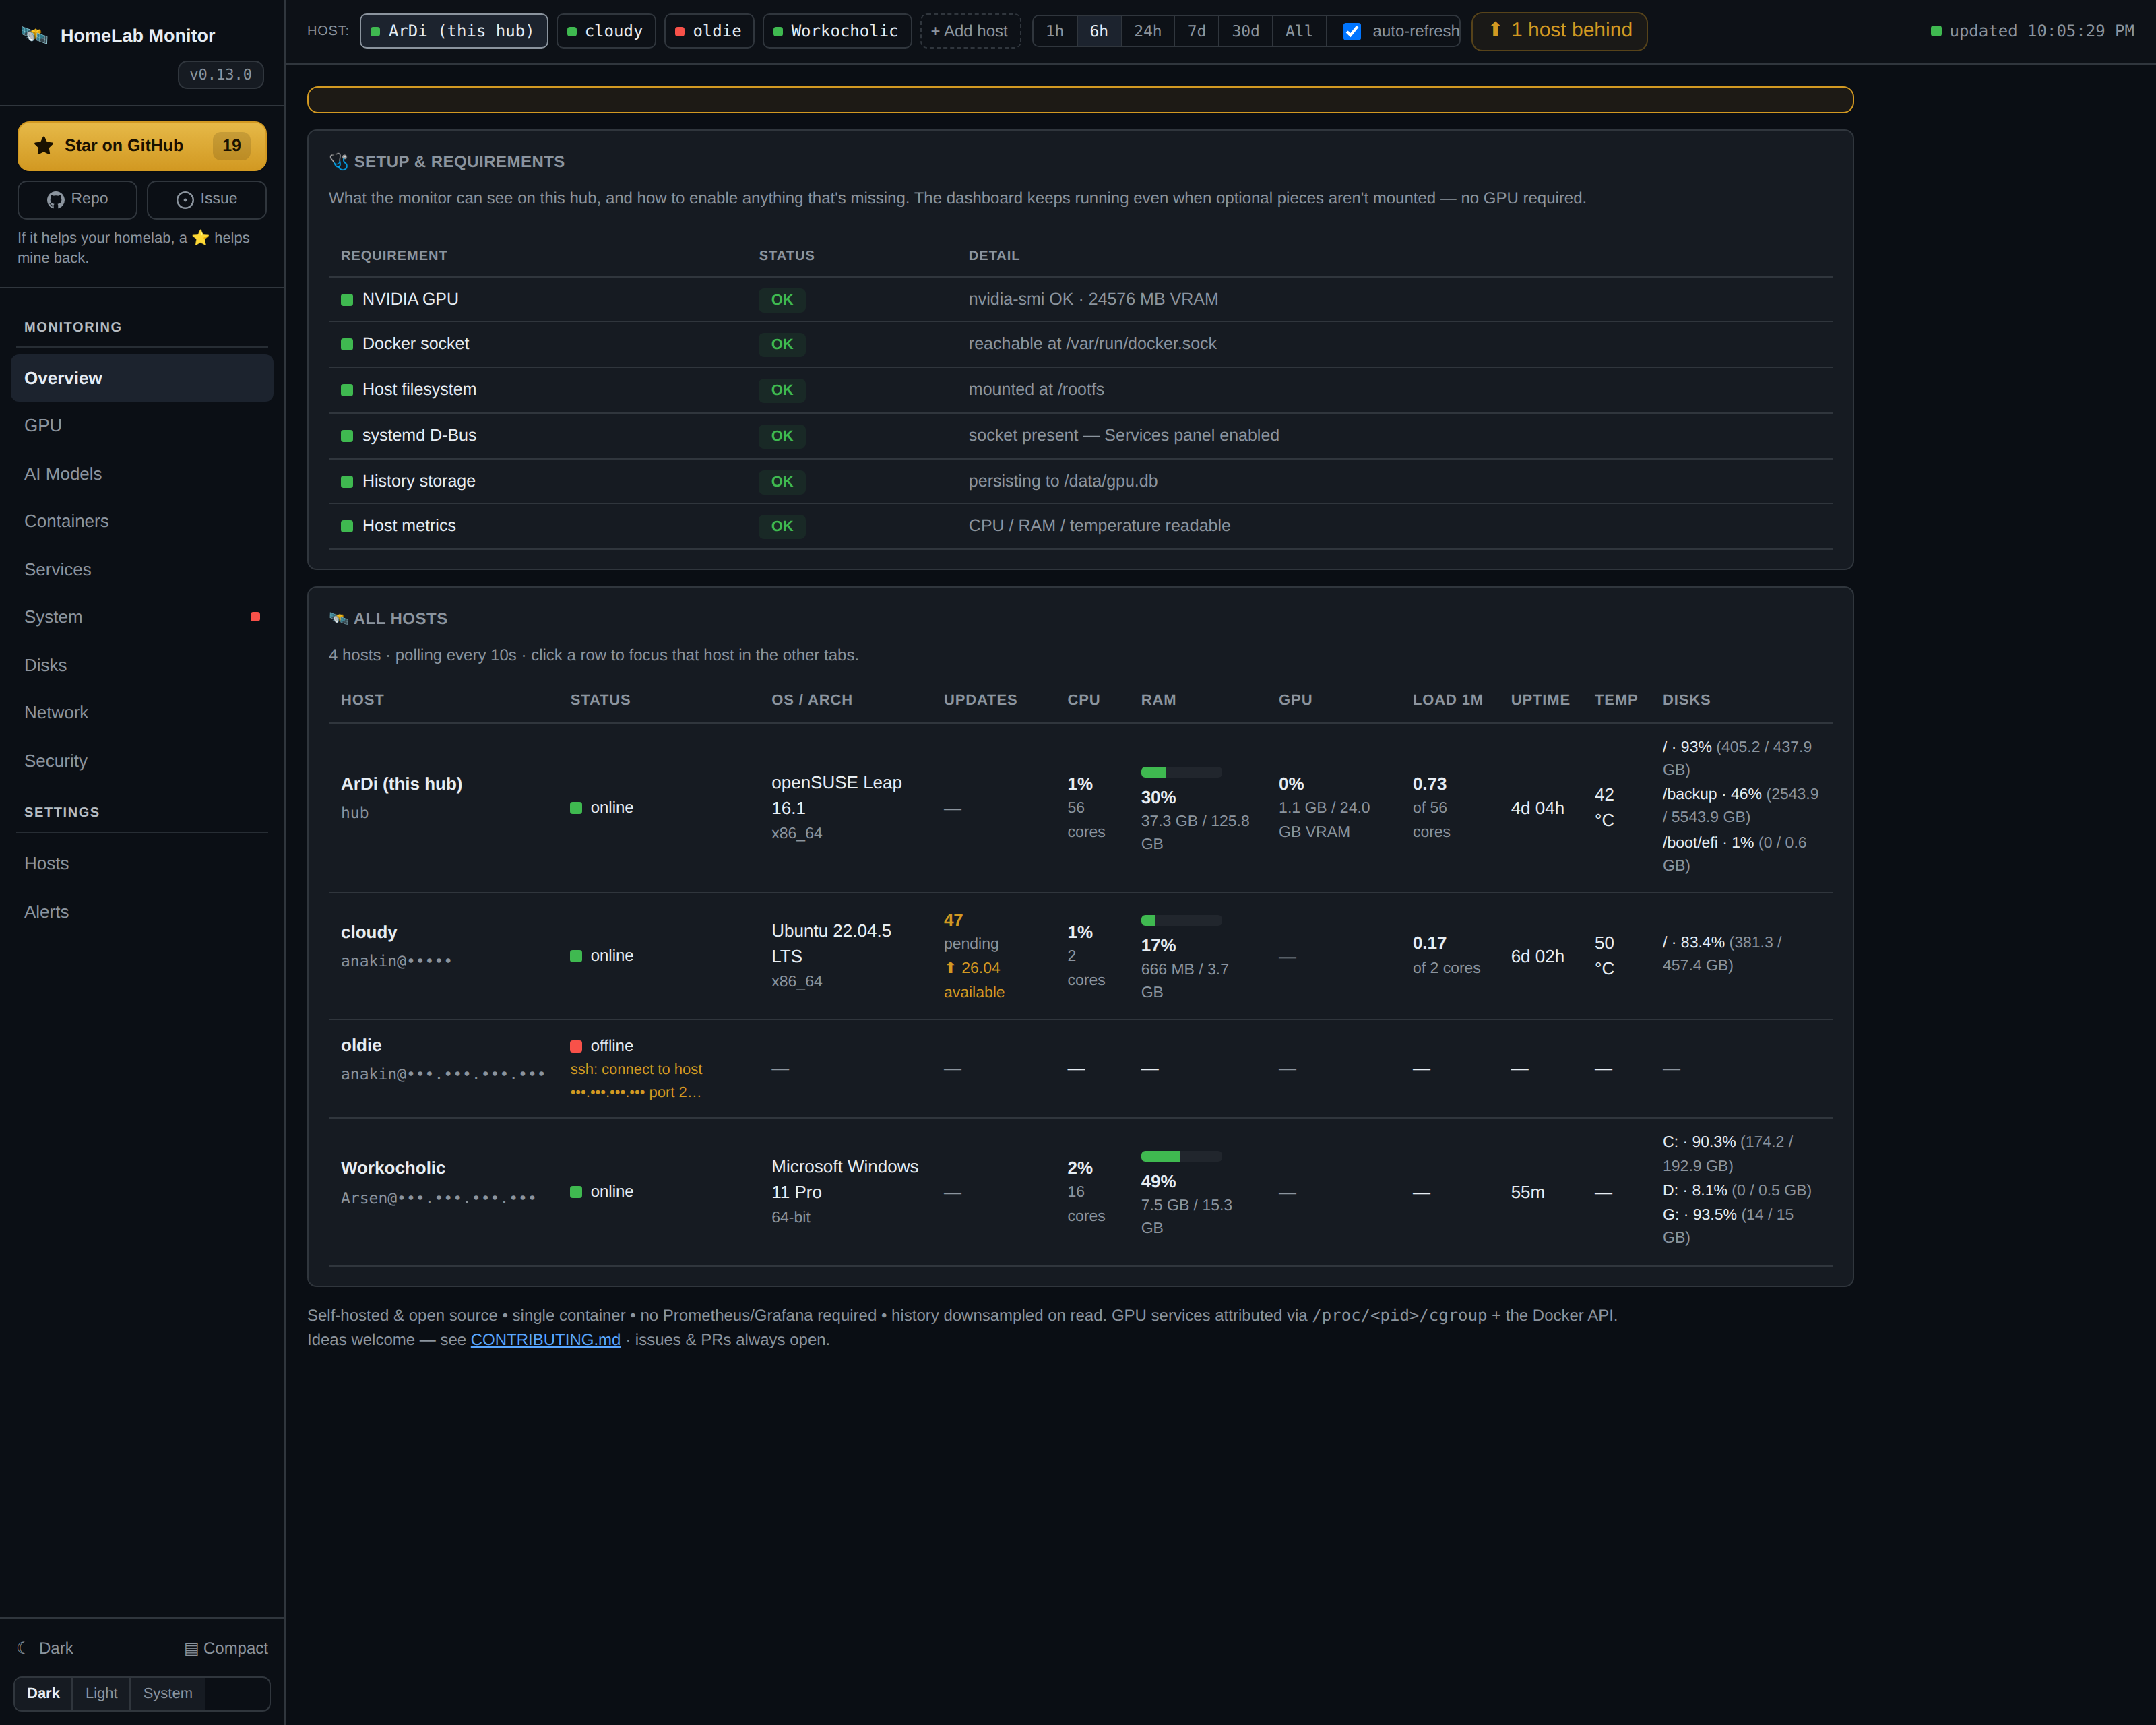
- GPU, demystified — live VRAM/util/power/temp, and which container is holding the card (auto-mapped).
- Containers, honestly — health plus RAM and VRAM in separate columns (real resident RAM, not page cache).
- systemd services — local or remote, your own units highlighted, failures first.
- WizTree-style disk treemaps — scan a filesystem, drill into folders, find the space hogs.
- Multi-machine over SSH — paste one key per box; Linux, a Pi, even Windows. No agents, no installs.
- Push alerts — Discord and ntfy.sh, edge-triggered so they don't spam.
Full tab-by-tab tour → Features.
Multi-machine, in two sentences
Open the Hosts tab, paste the hub's auto-generated SSH key onto each remote, and the hub starts polling it — no agents, just SSH + Python 3 (PowerShell on Windows). The hub pipes a small self-contained probe over SSH; nothing persists on the remote.
Onboarding, Windows setup, and the security model → Multi-machine docs.
Configuration
Set these under environment: in docker-compose.yml (all optional):
| Variable | Default | Meaning |
|---|---|---|
SAMPLE_INTERVAL |
10 |
Seconds between samples |
RETENTION_DAYS |
180 |
How long history is kept |
PRESSURE_FREE_MB |
2048 |
Free VRAM below this counts as "pressure" |
PORT |
9800 |
Dashboard port |
MCP_PORT |
9810 |
Port for the built-in read-only MCP server |
ENABLE_MCP |
1 |
Set 0 to run the dashboard without the MCP server |
WATCH_CONTAINERS |
— | Extra containers to scan for OOM (comma-separated) |
WATCH_SERVICES |
— | systemd units to always show, even vendor ones (comma-separated) |
CHECK_UPDATES |
true |
Set false to disable the daily GitHub-releases check (no outbound calls) |
History lives in ./data/gpu.db (a bind mount), so it survives restarts and upgrades. Alerts, the systemd D-Bus mount, and per-server tuning → Configuration docs.
Under the hood
The hub stitches nvidia-smi, the Docker API, model-server APIs (Ollama, vLLM, llama.cpp, A1111, …), systemd D-Bus, and /proc + /sys into one sampled view, persisted to SQLite and downsampled on read so a six-month range loads as fast as the last hour. Single page, vendored Chart.js, no build step.
- 30+ recognised model servers → Model servers
/metricsPrometheus endpoint + Grafana dashboard → Prometheus & Grafana- The full data pipeline + caller attribution → How it works
Connect an AI agent (MCP)
Your homelab is now legible to AI agents — point a client at one URL and it can see every host, container, GPU and disk. Read-only, no extra setup.
HomeLab Monitor isn't just a dashboard for you anymore; it's context for your AI agent too. A read-only MCP server is built into the same container (served on :9810) — so Claude, Claude Code, or any MCP client connects in one line and explores your whole lab through 12 named tools, with the same coverage you see on the dashboard: hosts, containers, systemd services, GPU and who's driving it, per-process RAM, AI model servers, disk treemaps, history and alerts.
# the dashboard is on :9800; the MCP server rides along on :9810
claude mcp add --transport http homelab http://YOUR-HUB:9810/mcp
Once connected, skip the tab-hunting and just ask — the agent picks the right tools:
- "My GPU's been pinned for an hour — which model server is loaded, and who's actually calling it?"
- "What's eating
/backup? Give me the biggest folders and flag anything that looks like runaway logs." - "Which host is lowest on RAM right now, and what's the top process holding it?"
- "I want to reboot and run an OS upgrade this weekend — which box needs it most, and what's a safe order given what's running on each?"
Read-only by design — there are no write tools, so an agent can look but never touch your fleet. Turn it off anytime with ENABLE_MCP=0. Full tool list & setup → MCP docs.
Security
This is a host monitor: it runs with host access and a read-only Docker socket, root mount, and D-Bus socket — a broad footprint by design. Keep it behind your LAN/VPN/firewall and don't expose it to the public internet. Details → docs.
⭐ Support the project
If HomeLab Monitor saves you a browser tab or two, a ⭐ on GitHub genuinely helps other home-labbers find it. Thank you!
Contributing
Issues and PRs are very welcome — especially new model-server probes, new monitors, and GPU back-ends. This is a hobby tool meant to help fellow home-labbers, so be kind. See CONTRIBUTING.md.
License
MIT — see LICENSE.
Yorumlar (0)
Yorum birakmak icin giris yap.
Yorum birakSonuc bulunamadi