PlatformUp2Date
Health Warn
- License — License: Apache-2.0
- Description — Repository has a description
- Active repo — Last push 0 days ago
- Low visibility — Only 5 GitHub stars
Code Fail
- rm -rf — Recursive force deletion command in ci/check-backend-build-version.sh
Permissions Pass
- Permissions — No dangerous permissions requested
No AI report is available for this listing yet.
Monitors your running application for version drift against the latest upstream release. Integrates with Prometheus, Grafana and MCP
 PlatformUp2Date



You run a platform, a home lab or just a pile of apps. They're all out of date... let's change that!
If an app exposes its version anywhere (an HTTP endpoint, a container image
tag, ssh/os-release, or even a Prometheus metric), its
version drift can be monitored.
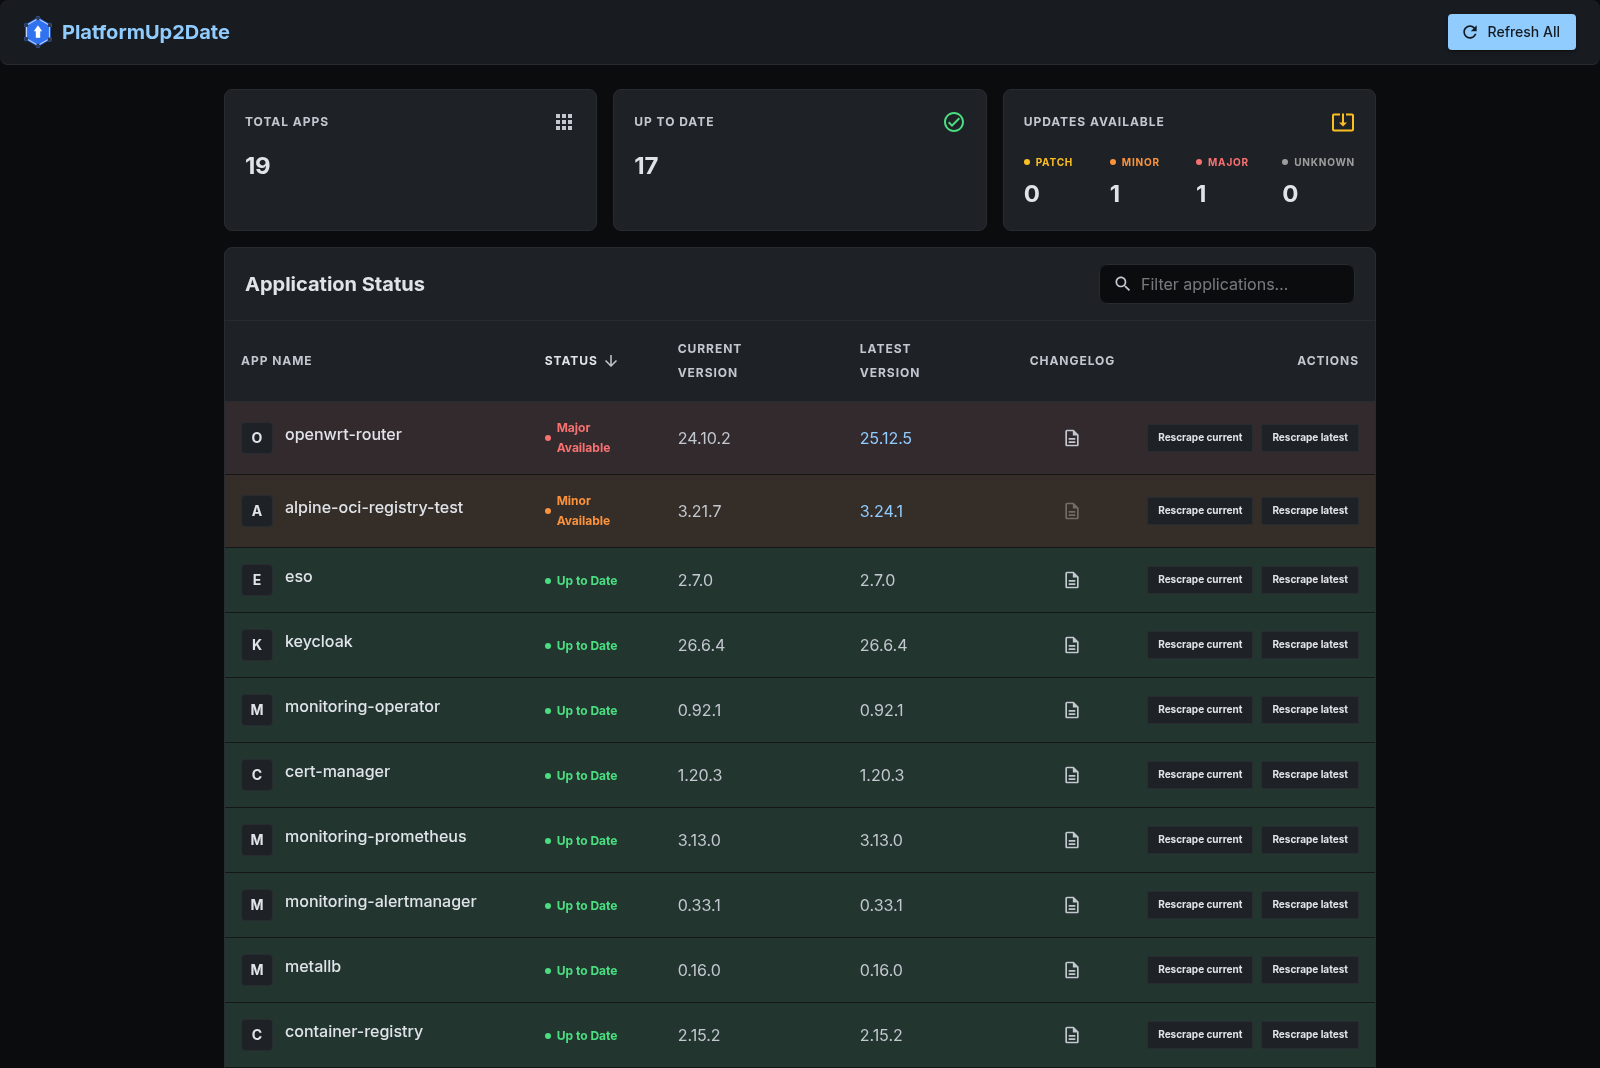
PlatformUp2Date monitors deployed applications against their latest upstream
releases and shows, per app, whether it's up-to-date or behind. "Current" is
always as close as we can get to the app's actually-observed running state, never a declared value
like a GitOps repo pin. "Latest" comes from an independent upstream source
such as GitHub Releases or a container registry's tag list. (SeeARCHITECTURE.md about how we reason here.)
Monitor version drift for
- Kubernetes deployments
- Docker Compose images
- VMs
- Bare-metal machines
- OpenWrt routers
- Random services you have no control over, purely to demonstrate your superiority at staying on top of things
- Coffee makers?
It integrates with Prometheus/Grafana and ships its own frontend — deploy it
or don't :) It also serves an MCP endpoint, so an AI agent
can ask what's outdated and read the changelogs while helping you upgrade.
Quick taste (no toolchain required)
All you need is Docker:
git clone https://github.com/sreyardship/PlatformUp2Date.git
cd PlatformUp2Date
docker compose -f compose.quickstart.yml up
Then open localhost:3000. You
should see three application rows:
- mastodon
currentis read from the public
chaos.social instance's API (an observed running
version, not a repo pin);latestcomes from GitHub Releases.
chaos.social upgrades conservatively, so this card is usually behind,
showing what drift detection looks like: a red/orange card with the
current and latest versions side by side, and a changelog link to the
release it's missing. - gitea
currentis read from the public
gitea.com SaaS instance's version API;latestcomes
from Gitea's official image tags on Docker Hub. gitea.com tracks upstream
closely, so this card is usually green (up to date). - demo-always-behind is not a live service:
currentis read from a
fixture file in this repo (docs/demo-current.json,
pinned to Prometheus 2.53.0) andlatestcomes from Prometheus's GitHub
Releases (3.x). This card is always behind by a major version, so the
quickstart shows a drift card even on a day when both live services above
happen to be current. Delete it when you add your own apps.
The first two are live third-party services, so their colors on any given day
depend on what they happen to be running. None of the three needs credentials.
Monitor your own apps
The quickstart mounts the sample config,deploy/k8s/base/platform-config.yaml,
into the backend. Add an entry under apps: and restart to watch something
of your own:
    - name: my-app
      changelog-url: https://github.com/me/my-app/releases/tag/v{version}
      current:
        type: http-json             # ask the running instance itself
        url: https://my-app.example.com/api/version
      latest:
        type: github-release
        repo: me/my-app
current and latest are independent, pluggable sources. Every source type
(http-json, http-header, http-prometheus, k8s-image, ssh-os-release,github-release, oci-registry, http-regex) and every key is documented indocs/configuration.md.
Documentation
docs/configuration.md— every version-source
type, every config key, version schemes, changelog-link templates.docs/deployment.md— running this for real:
Kubernetes (the primary target, though any OCI runtime works), HA and
replicas, Valkey, RBAC for thek8s-imagesource, Prometheus scraping,
alert rules, the Grafana dashboard.RELEASE.md— image channels (edge,sha-<short>, semver),
what each CI trigger publishes, and how a release is cut.ARCHITECTURE.md— the design principles behind the
substrate-agnostic version-source model.CONTEXT.md— glossary of project-specific terms.docs/adr/— architecture decision records for individual
design choices.
Metrics & Alerting
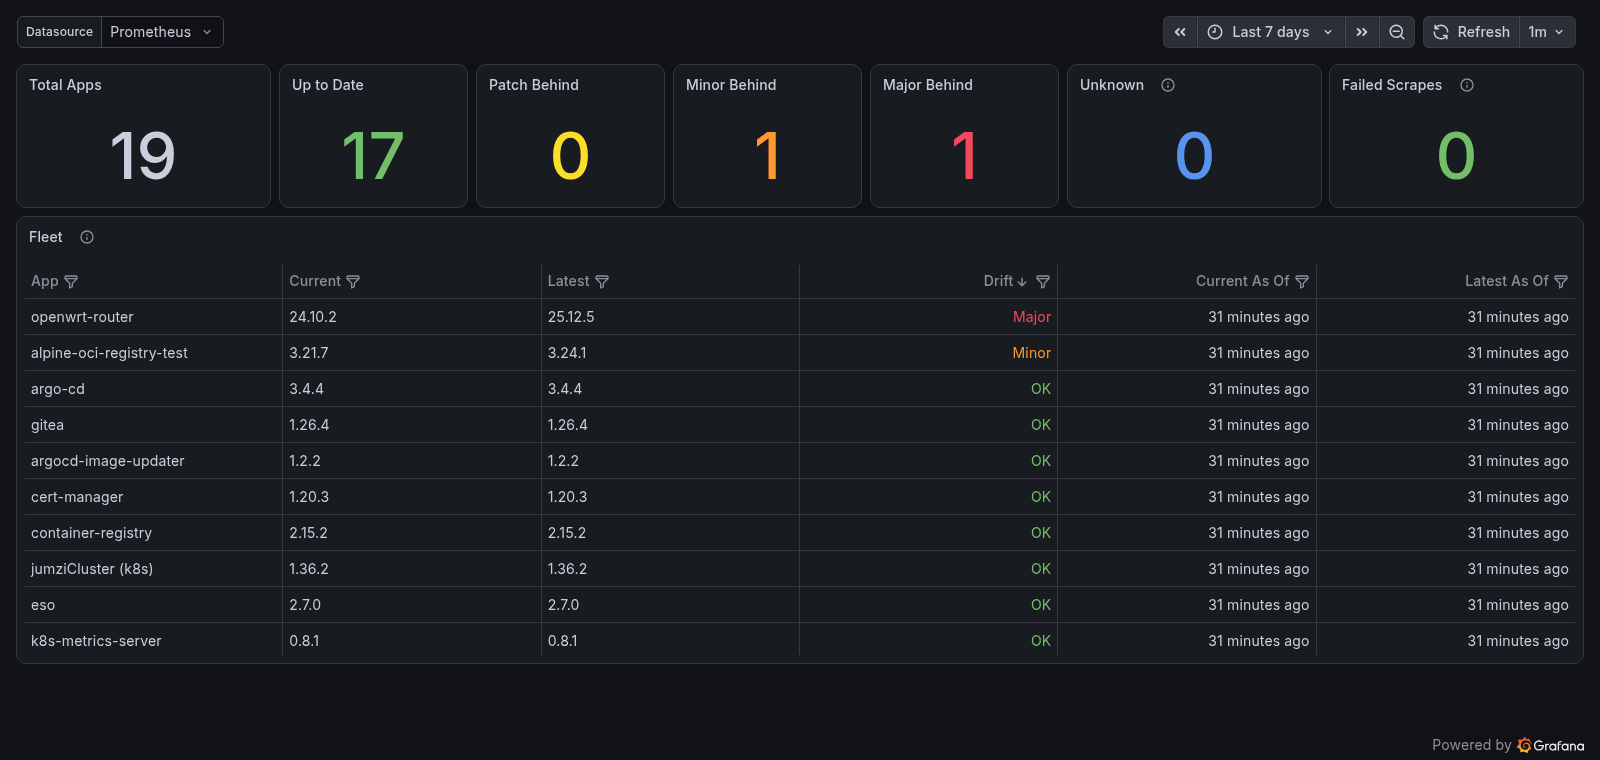
The backend exposes a Prometheus scrape endpoint at /metrics. Six metric families are exported:pu2d_version_drift_level, pu2d_application_info, pu2d_scrape_last_success_timestamp_seconds,pu2d_scrape_last_failure_timestamp_seconds, pu2d_config_error and pu2d_config_unnamed_apps
— see docs/deployment.md for the full list. The core one for version monitoring is a gauge:
# HELP pu2d_version_drift_level How far the deployed version is behind latest (0=current, 1=patch, 2=minor, 3=major)
# TYPE pu2d_version_drift_level gauge
pu2d_version_drift_level{app="argo-cd"} 3
pu2d_version_drift_level{app="git-tea"} 0
One gauge answers both questions: whether an app is outdated, and how far
behind it is. The value is the highest-significance difference between the
deployed and latest version; calver apps (e.g. Ubuntu's 24.04) report on
the same scale, graded by what the changed token means, and dotnet apps (e.g.
Sonarr's 4.0.20.3014) grade by changed component. The full grading rules
(pre-releases, build metadata, calver token classes, the dotnet revision) are indocs/deployment.md anddocs/configuration.md.pu2d_application_info carries the actual current/latest version strings and
covers every configured app, including ones that haven't resolved yet.
For more detail than the gauges carry, use the frontend or theGET /api/v1/version endpoint. For scraping setup, example alert rules, and
the bundled Grafana dashboard on a k8s cluster, seedocs/deployment.md.
MCP endpoint
The backend exposes a Model Context Protocol server
so an AI agent can ask "which monitored applications are out of date, how far behind,
and what changed between the versions?" without any custom integration. It is a third
read surface over the same data as /metrics and GET /api/v1/version: any
MCP-capable host can connect and discover the tools at runtime.
Transport is Streamable HTTP, served at /api/mcp on the backend's HTTP port. It runs
stateless (each request auto-initialises its own throwaway session), so the endpoint works
behind multiple replicas with no session affinity.
Tools
list_outdated_applications(minSeverity?)returns the applications running behind
their latest upstream release, each as{ name, current, latest, outdated, drift, changelogUrl, … }wheredriftisPATCH/MINOR/MAJOR. The optionalminSeverityargument
(PATCH|MINOR|MAJOR) filters by how far behind an app is; omit it to get every
app with any drift.get_application(name)returns the status of a single application by exact name,
or a tool error if it isn't monitored.list_applications_with_failed_scrapes()returns applications whose most recent
scrape of either the current or latest side failed. It excludes sides that have never
been attempted; a failed scrape describes the read, not the health of the application.list_misconfigured_applications()returns recorded configuration defects as{ application, scope, message }entries. The scope isCURRENT,LATEST,APP, orCHANGELOG; this is distinct from a transient failed scrape.trigger_scrape(): requests an immediate full scrape. It returns scrape telemetry,
including anoutcomeofSCRAPED,RATE_LIMITED, orIN_PROGRESS, rather than
application versions.scrape_applications(targets)requests a targeted scrape for a list of{ name, side }entries, wheresideiscurrent,latest, orboth. It uses a
separate targeted-scrape budget and returns per-target results when the scrape runs.
changelogUrl links the release notes of the latest upstream release (if the app has a
changelog-link template configured,null otherwise), so an agent can read what changed (breaking changes included) before
starting update work.
The drift verdict is computed server-side by the same tested semver logic that backs the
metrics gauge, so the caller never has to compare versions itself.
Connecting a client
Point any MCP client that supports remote Streamable HTTP servers at:
https://platformup2date.example.com/api/mcp
Most MCP-capable CLIs have a built-in subcommand for registering a remote HTTP
server (consult your client's docs); the shape is generally<your-mcp-client> mcp add --transport http platformup2date <url>.
Authentication
Every surface is open by default; protection is opt-in. The backend can act
as an OAuth 2.1 resource server against one shared OIDC issuer, with the MCP
endpoint (/api/mcp) and the web UI + REST API (/api/v1) each gated
independently by its own role:
OIDC_ISSUER=https://auth.example.com/realms/yourrealm
OIDC_AUDIENCE=platformup2date
MCP_OIDC_ROLE=pu2d-mcp   # gates /api/mcp
WEB_OIDC_ROLE=pu2d-web   # gates /api/v1, and thereby the web UI
An MCP client that supports the MCP authorization spec discovers the issuer
from the endpoint's RFC 9728 protected-resource metadata and logs in
natively, with no bearer token to fetch or attach by hand. For the web UI,
the React SPA itself becomes an OIDC client (Authorization Code + PKCE) via
two frontend variables, OIDC_AUTHORITY and OIDC_CLIENT_ID. /metrics
and /q/health are never gated.
The full contract (variable semantics, boot-failure rules, what each gate
does and doesn't cover) is indocs/configuration.md;
the cluster-level consequences (MCP's one extra ingress rule, IdP
prerequisites, edge-proxy interactions, dev-mode CORS) are indocs/deployment.md.
Contributing
See CONTRIBUTING.md
Reviews (0)
Sign in to leave a review.
Leave a reviewNo results found