artemis-studio
Health Warn
- License — License: Apache-2.0
- Description — Repository has a description
- Active repo — Last push 0 days ago
- Low visibility — Only 5 GitHub stars
Code Fail
- exec() — Shell command execution in .claude/skills/acceptance-test-authoring/references/javascript/extract-gherkin.cjs
- fs.rmSync — Destructive file system operation in .claude/skills/acceptance-test-authoring/references/javascript/extract-gherkin.cjs
- fs module — File system access in .claude/skills/acceptance-test-authoring/references/javascript/extract-gherkin.cjs
- exec() — Shell command execution in .claude/skills/acceptance-test-authoring/references/javascript/openspec-effective-paths.cjs
- fs module — File system access in .claude/skills/acceptance-test-authoring/references/javascript/openspec-effective-paths.cjs
Permissions Pass
- Permissions — No dangerous permissions requested
No AI report is available for this listing yet.
Cluster-wide management and observability for Apache ActiveMQ Artemis

Artemis Studio
One console for every Apache ActiveMQ Artemis cluster you run.
Live topology, every queue on every node in one table, message flow you can watch,
safe message operations, and SQL over your messages — all from a single instance.
An interactive 3 a.m. incident · about 2 minutes · runs in your browser








Docs ·
Quickstart ·
Flow ·
SQL Console ·
MCP ·
Roadmap
[!WARNING]
Alpha. Under active development and not yet feature-complete. Published images
are pre-stable dev builds (sudoit1/artemis-studio:dev; there is no:latestyet).
Expect breaking changes.
Why
It's 3 a.m. and ORDERS.DLQ is backing up somewhere in your cluster. The console that
ships with Artemis manages one broker at a time and has no idea a cluster exists, so you
open a tab per node, walk a JMX tree in each one, and read attributes until you find it.
Artemis Studio treats the cluster as the unit of everything. Every node of every
cluster is on one topology, with HA roles polled live, and every queue on every node is in
one table, sorted by depth, so the queue you were hunting for is the first row. One
instance serves as many clusters as you run. It works against your existing brokers:
beyond the management endpoints you almost certainly have already, broker.xml stays as it
is, and it never starts a broker of its own.
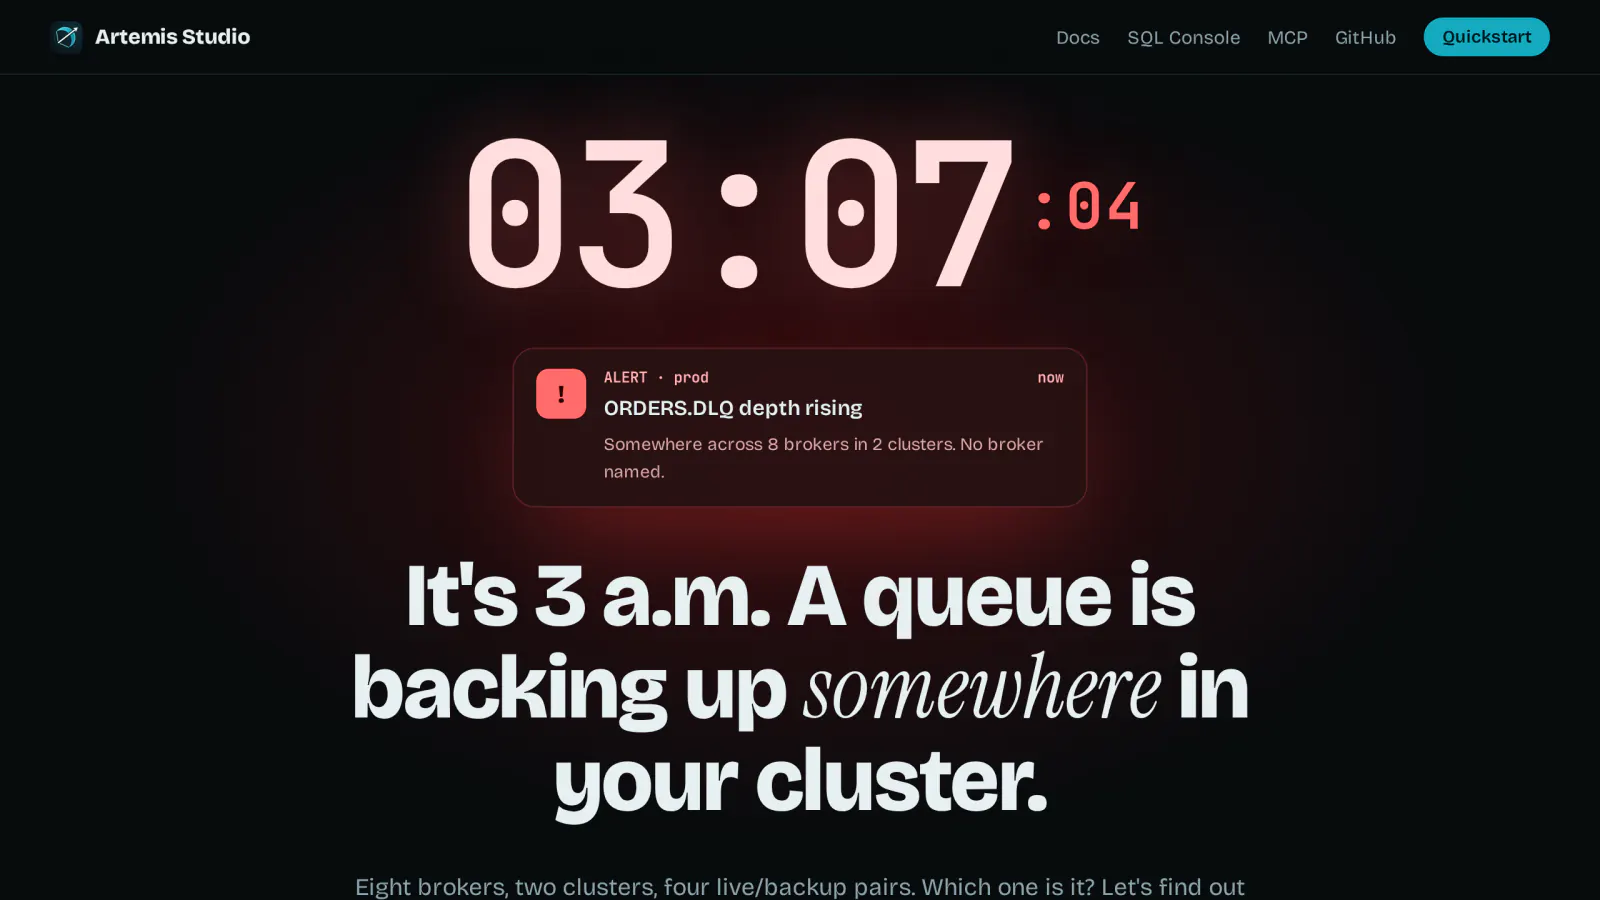
▶ Play the story: hunt for the queue yourself, one tab per broker, then watch
Studio find it on one screen.
What it does
| Cluster topology | Cross-node queues |
|---|---|
 |
 |
| Client and message flow | SQL Console |
 |
 |
| Plugins | Settings |
 |
 |
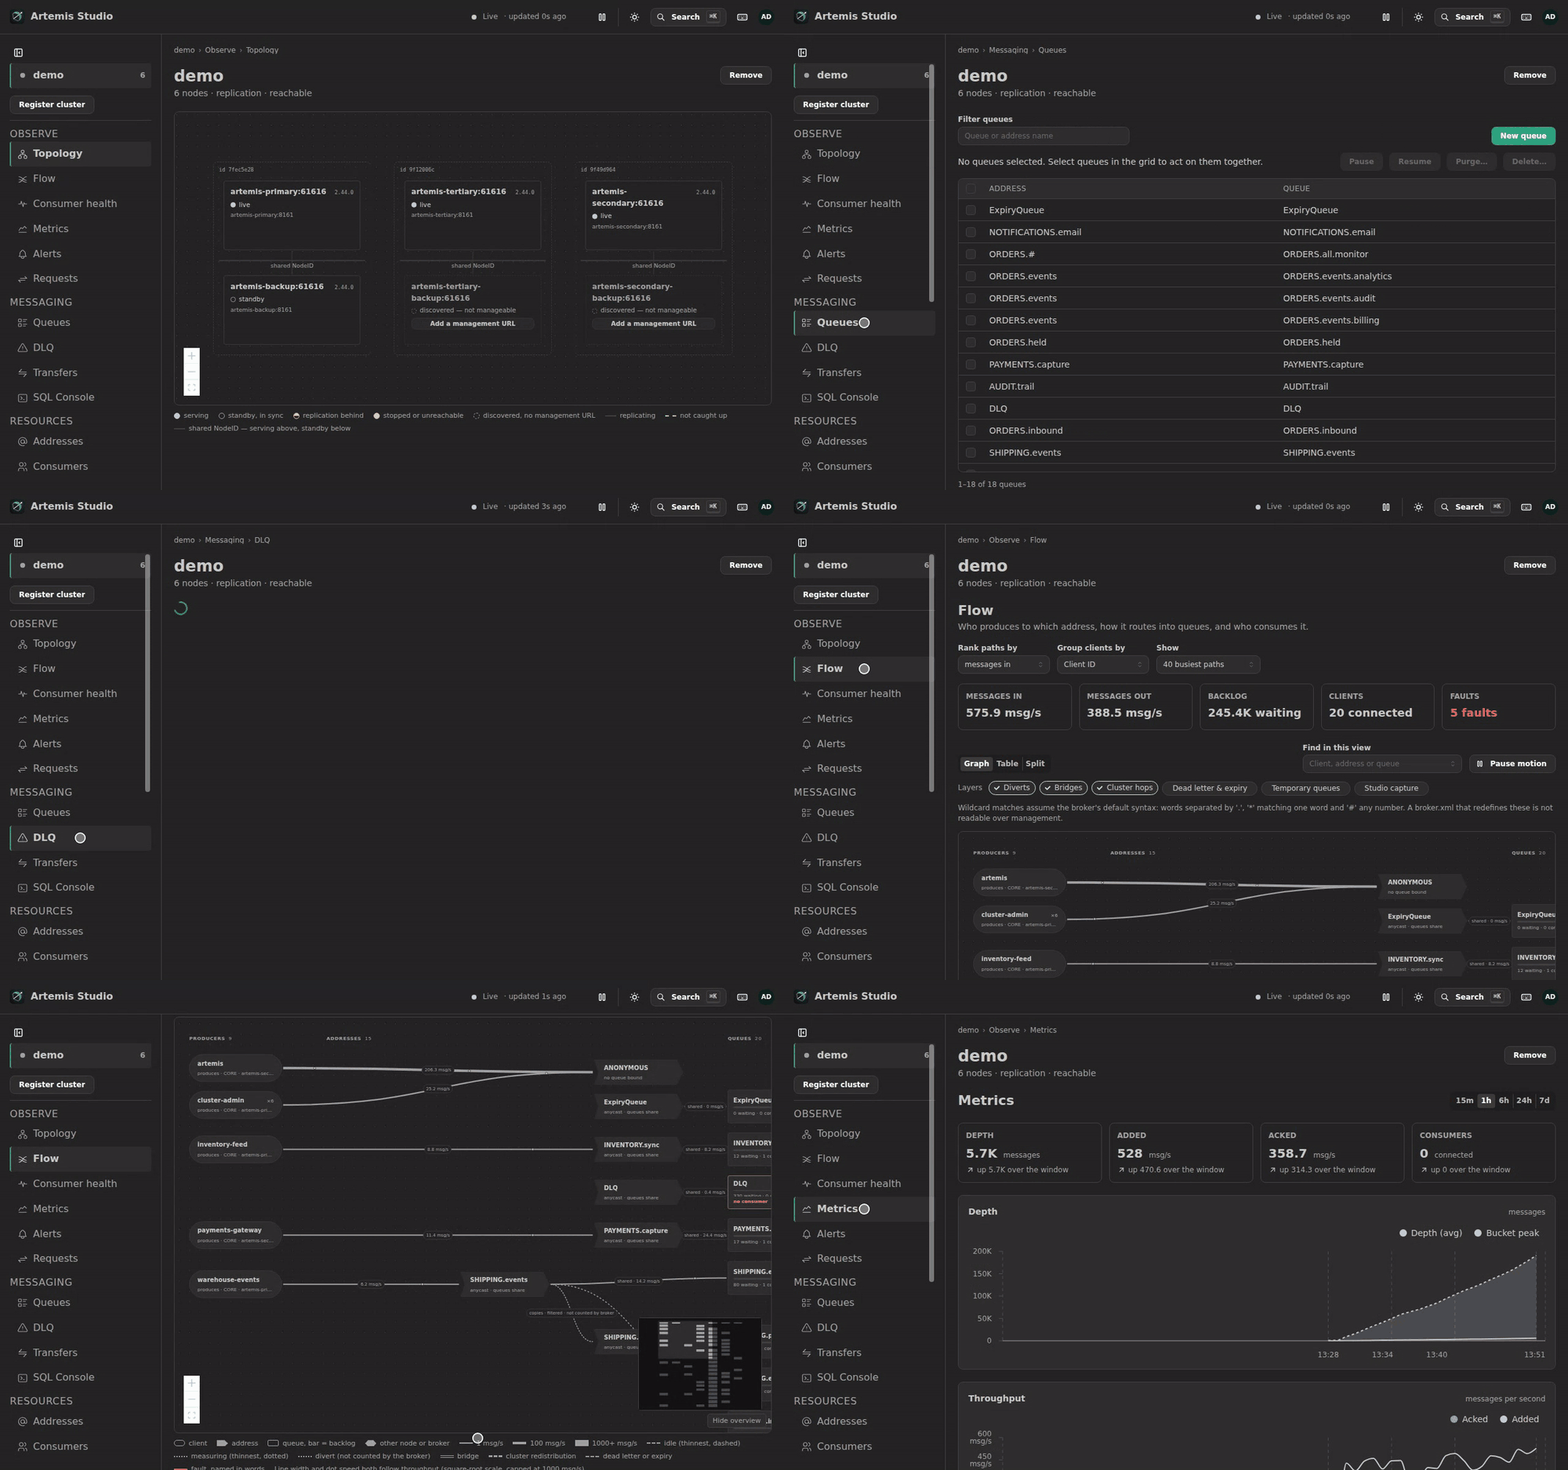
Topology — live/backup pairs and their replication state. The HA role is
polled from every node on every cycle and never read from configuration; two live
nodes in one pair raise a split-brain alert.Flow — which
application sends to which address, how that address routes through diverts,
bridges and cluster hops into queues, and who consumes them, at what rate. Faults
such as a backlog with no consumer are stated in words, and clients are sampled
only while someone is watching.SQL Console —
Artemis cannot tell you where order 4471 went. Its only server-side filter is a
JMS selector: headers only, never the body, one queue on one node at a time.
Studio can:SELECT * FROM "ORDER.*" WHERE body->>'orderId' = '4471' LIMIT 50The dialect is read-only
SELECT, checked against a fixed column catalogue, so a
query cannot change anything. Header predicates become a JMS selector and cost
nothing; body predicates scan, and the plan strip tells you which before the
query runs. A query over the cost ceiling is refused with its estimate rather
than quietly truncated. Add a live tail, or turn on
complete capture
for a queue: a broker-bounded copy that Studio drains, so a message consumed
between two polls can still be found.Cross-node resources — queues, addresses, consumers, sessions, connections
and producers in one virtualised table, each row attributed to its node and kept
current over SSE.Message operations — browse, send, move, retry, expire, delete and purge.
Every mutating call accepts?dryRun=true, bulk operations are capped on the
server, and outcomes are reported per node.Request-reply tracing — requests matched to their replies across addresses
and nodes, with latency and timeout statistics against the expectations you declare.Broker configuration
— declare the address settings, security settings, diverts, bridges and queues a
cluster should run, and compose the routing between them on a canvas. Apply them
canary-first, with every hazard stated before anything is written, or export them as
abroker.xmlfragment, and see where each node has drifted. On a first run Studio
offers the cluster's current state as revision 1; nothing is adopted without your
say, and a bridge is never adopted because the broker reports only part of one.Setup review — each
cluster's HA, clustering, durability and message-safety configuration checked against
known mistakes: a single replication pair that cannot win a quorum vote, redistribution
left at-1, a connector advertisinglocalhost, no dead-letter address. Every finding
carries the evidence per node and thebroker.xmlfix, and can be accepted as a known
risk, with a reason, on the record.Alert delivery —
Slack, Microsoft Teams, PagerDuty (incidents open and resolve with the alert), email and
signed webhooks, each tested before it is saved, with a delivery log that says why a
notification failed.Data governance
— sensitive headers and properties are masked, PII is classified automatically,
and redaction follows the viewer's role.Governance — authentication everywhere, roles and permissions scoped
global → environment → cluster, API tokens, optional OIDC/SSO, and an audit trail
that records every change and its outcome.MCP server — the same
capabilities for an AI assistant, under the same grants and the same audit trail.Plugins — install a
plugin's.jarfrom the UI: screens, API, assistant tools and data of its own, with
everything it can do shown before you confirm, and no restart unless it needs one.
Updates show what changes and roll back; a failing plugin never stops Studio. Start
a plugin from the template.
Run it
git clone https://github.com/sudoitir/artemis-studio && cd artemis-studio
just up          # Studio + Postgres, secrets generated, pinned to the latest release
Then open http://localhost:8080. just up prints the generated admin password
once, and you must change it when you first sign in.
just, or against your own Postgres
base=https://raw.githubusercontent.com/sudoitir/artemis-studio/main/deploy/compose
curl -sO "$base/compose.prod.yaml"
curl -s "$base/.env.example" -o .env   # then edit it
docker compose -f compose.prod.yaml --env-file .env up -d
docker run -p 8080:8080 \
  -e ARTEMIS_STUDIO_DB_URL=jdbc:postgresql://db:5432/artemis_studio \
  -e ARTEMIS_STUDIO_DB_USER=artemis_studio \
  -e ARTEMIS_STUDIO_DB_PASSWORD=... \
  -e ARTEMIS_STUDIO_SECRET_KEY="$(openssl rand -base64 32)" \
  sudoit1/artemis-studio:dev
Every variable, what a reverse proxy needs for the SSE stream, and how to recover a
lost first login are in the
configuration guide.
Built on four rules
- Broker-friendly by construction. Batched reads (one Jolokia POST per node,
never one per queue), tiered polling and a per-node rate limiter. Studio must never
be the reason a broker falls over. - Safe by default. Every destructive call can dry-run first, and purge and
delete ask you to type the resource's name. - HA state comes from the nodes, not from config. Only the live nodes know who
is live. - Honest capability gating. An unavailable feature says so and shows the exact
broker.xmlthat enables it. Nothing silently disappears.
Develop
You need JDK 25, Node 22, Docker and just.
A dev container is included (.devcontainer/).
just dev-up          # Postgres + a real Artemis primary/backup pair + Studio, from source
just dev             # or: backend :8080 + Vite :5173 together, with live reload
just verify          # everything CI runs
ADMIN_PASSWORD=… just demo adds a second and a third live/backup pair (three
primaries, so quorum voting keeps a majority when one pair is lost) and fills all
six nodes with realistic traffic: applications behind diverts, a bridge and cluster
hops, an address with no consumer whose backlog keeps growing, a real dead-letter
backlog and one stopped node. On a fresh stack the printed password is one-time, so
add NEW_ADMIN_PASSWORD=… on the first run and use that password afterwards. The
screenshots and clips above are recorded from this stack by just shots andjust demo-gif; nothing is staged.
Every feature goes through OpenSpec (/opsx:propose → apply → archive), and
significant decisions are recorded as ADRs. SeeCLAUDE.md and CONTRIBUTING.md.
Stack
Java 25 · Spring Boot 4.1 · PostgreSQL with Liquibase · React 19 + Vite + Mantine 9 ·
TanStack Router/Query/Table · React Flow · Jolokia over HTTP first, the Artemis Core
client second · SSE · one container image.
Architecture ·
all 88 decisions.
Releases
Every push to main that changes the application publishes a release, versioned with CalVer YYYY.MM.PATCH and
tagged three ways on Docker Hub: 2026.09.3 (immutable), 2026.09 (that month) anddev (the latest). There is no :latest until the first stable release. Each
release attaches the runnable jar with its .sha256, and its notes are generated
from the commit messages (changelog/).
Roadmap
| [x] | A · Improve CI/CD: Optimize CI/CD so source changes trigger image publishing, site changes trigger site deployment, and relevant checks run only when needed. |
| [x] | A · Cross-broker message transfer: move messages between queues on different brokers, forced redistribution of specific messages, and arbitrary queue-to-queue transfers across remote nodes |
| [x] | A · Alert delivery: webhook, email, Slack/Teams, and PagerDuty-compatible webhook channels |
| [ ] | A · Observability export: OpenTelemetry metrics |
| [ ] | A · Message lineage: track messages across queues, diverts, bridges, DLQs, and captured payloads |
| [x] | A · Consumer health: depth trends, consumption velocity, and slow-consumer root-cause context |
| [ ] | B · CLI: automation for clusters, queues, SQL queries, message operations, and API tokens |
| [ ] | B · Saved views: shareable views with role visibility and cluster-scoped defaults |
| [x] | B · Routing builder: visual builder for diverts, bridges, and transformers |
| [x] | B · Bulk operations: multi-queue operations with dry-run, capped execution, typed confirmation, and audit |
| [x] | B · Operator UX: row context menus, navigation enhancements, and flow-split monitoring views |
| [ ] | B · Performance hardening: SQL pushdown, SSE backpressure, virtualized grids, batched broker calls, and retention tuning |
| [ ] | C · Compliance tooling: content/PII search and predicate-based message deletion with audit |
| [ ] | C · SLA tracking: queue depth, request-reply latency, and consumption-violation tracking |
| [ ] | C · Environment promotion: compare and promote queues, addresses, and routing definitions across environments |
| [ ] | C · Static configuration verification: compare the parts of broker.xml the management API cannot apply — global-max-size, <ha-policy>, acceptors — against a declared expectation |
| [ ] | C · Capacity forecasting: predict queue growth and broker pressure from metric history |
| [ ] | C · Audit export: filtered audit-trail export and retention controls |
| [ ] | D · SQL processors: filter and transform, aggregation; joins only if a safe Artemis model is proven |
| [ ] | D · Message replay: replay captured payloads as single, batch, or transformed messages |
| [ ] | D · ArkMQ operator: Kubernetes-native cluster discovery and registration |
| [ ] | E · Schema detection: message schema inference and payload structure catalog |
| [ ] | E · Scheduled reports: CSV/JSON reports with distribution lists and alert-attached reports |
| [ ] | E · Claude Plugin: Code plugin with skills and MCP to assist in developing Artemis-based applications |
Licence
Apache-2.0, the same licence as Artemis itself.
Apache ActiveMQ and Apache ActiveMQ Artemis are trademarks of the Apache Software
Foundation. Artemis Studio is an independent project and is not produced by,
endorsed by, or affiliated with the Apache Software Foundation. References to
"Artemis" describe the broker this tool manages.
If this saved you time, a ⭐ helps others find it.
Reviews (0)
Sign in to leave a review.
Leave a reviewNo results found