ATSuite
Health Uyari
- License — License: Apache-2.0
- Description — Repository has a description
- Active repo — Last push 0 days ago
- Low visibility — Only 5 GitHub stars
Code Gecti
- Code scan — Scanned 12 files during light audit, no dangerous patterns found
Permissions Gecti
- Permissions — No dangerous permissions requested
Bu listing icin henuz AI raporu yok.
An Agent Infra Benchmark Suite for Agentic Tool Serving (AgentCore, Lambda, GCP, AgentRun, E2b etc.)
ATSuite
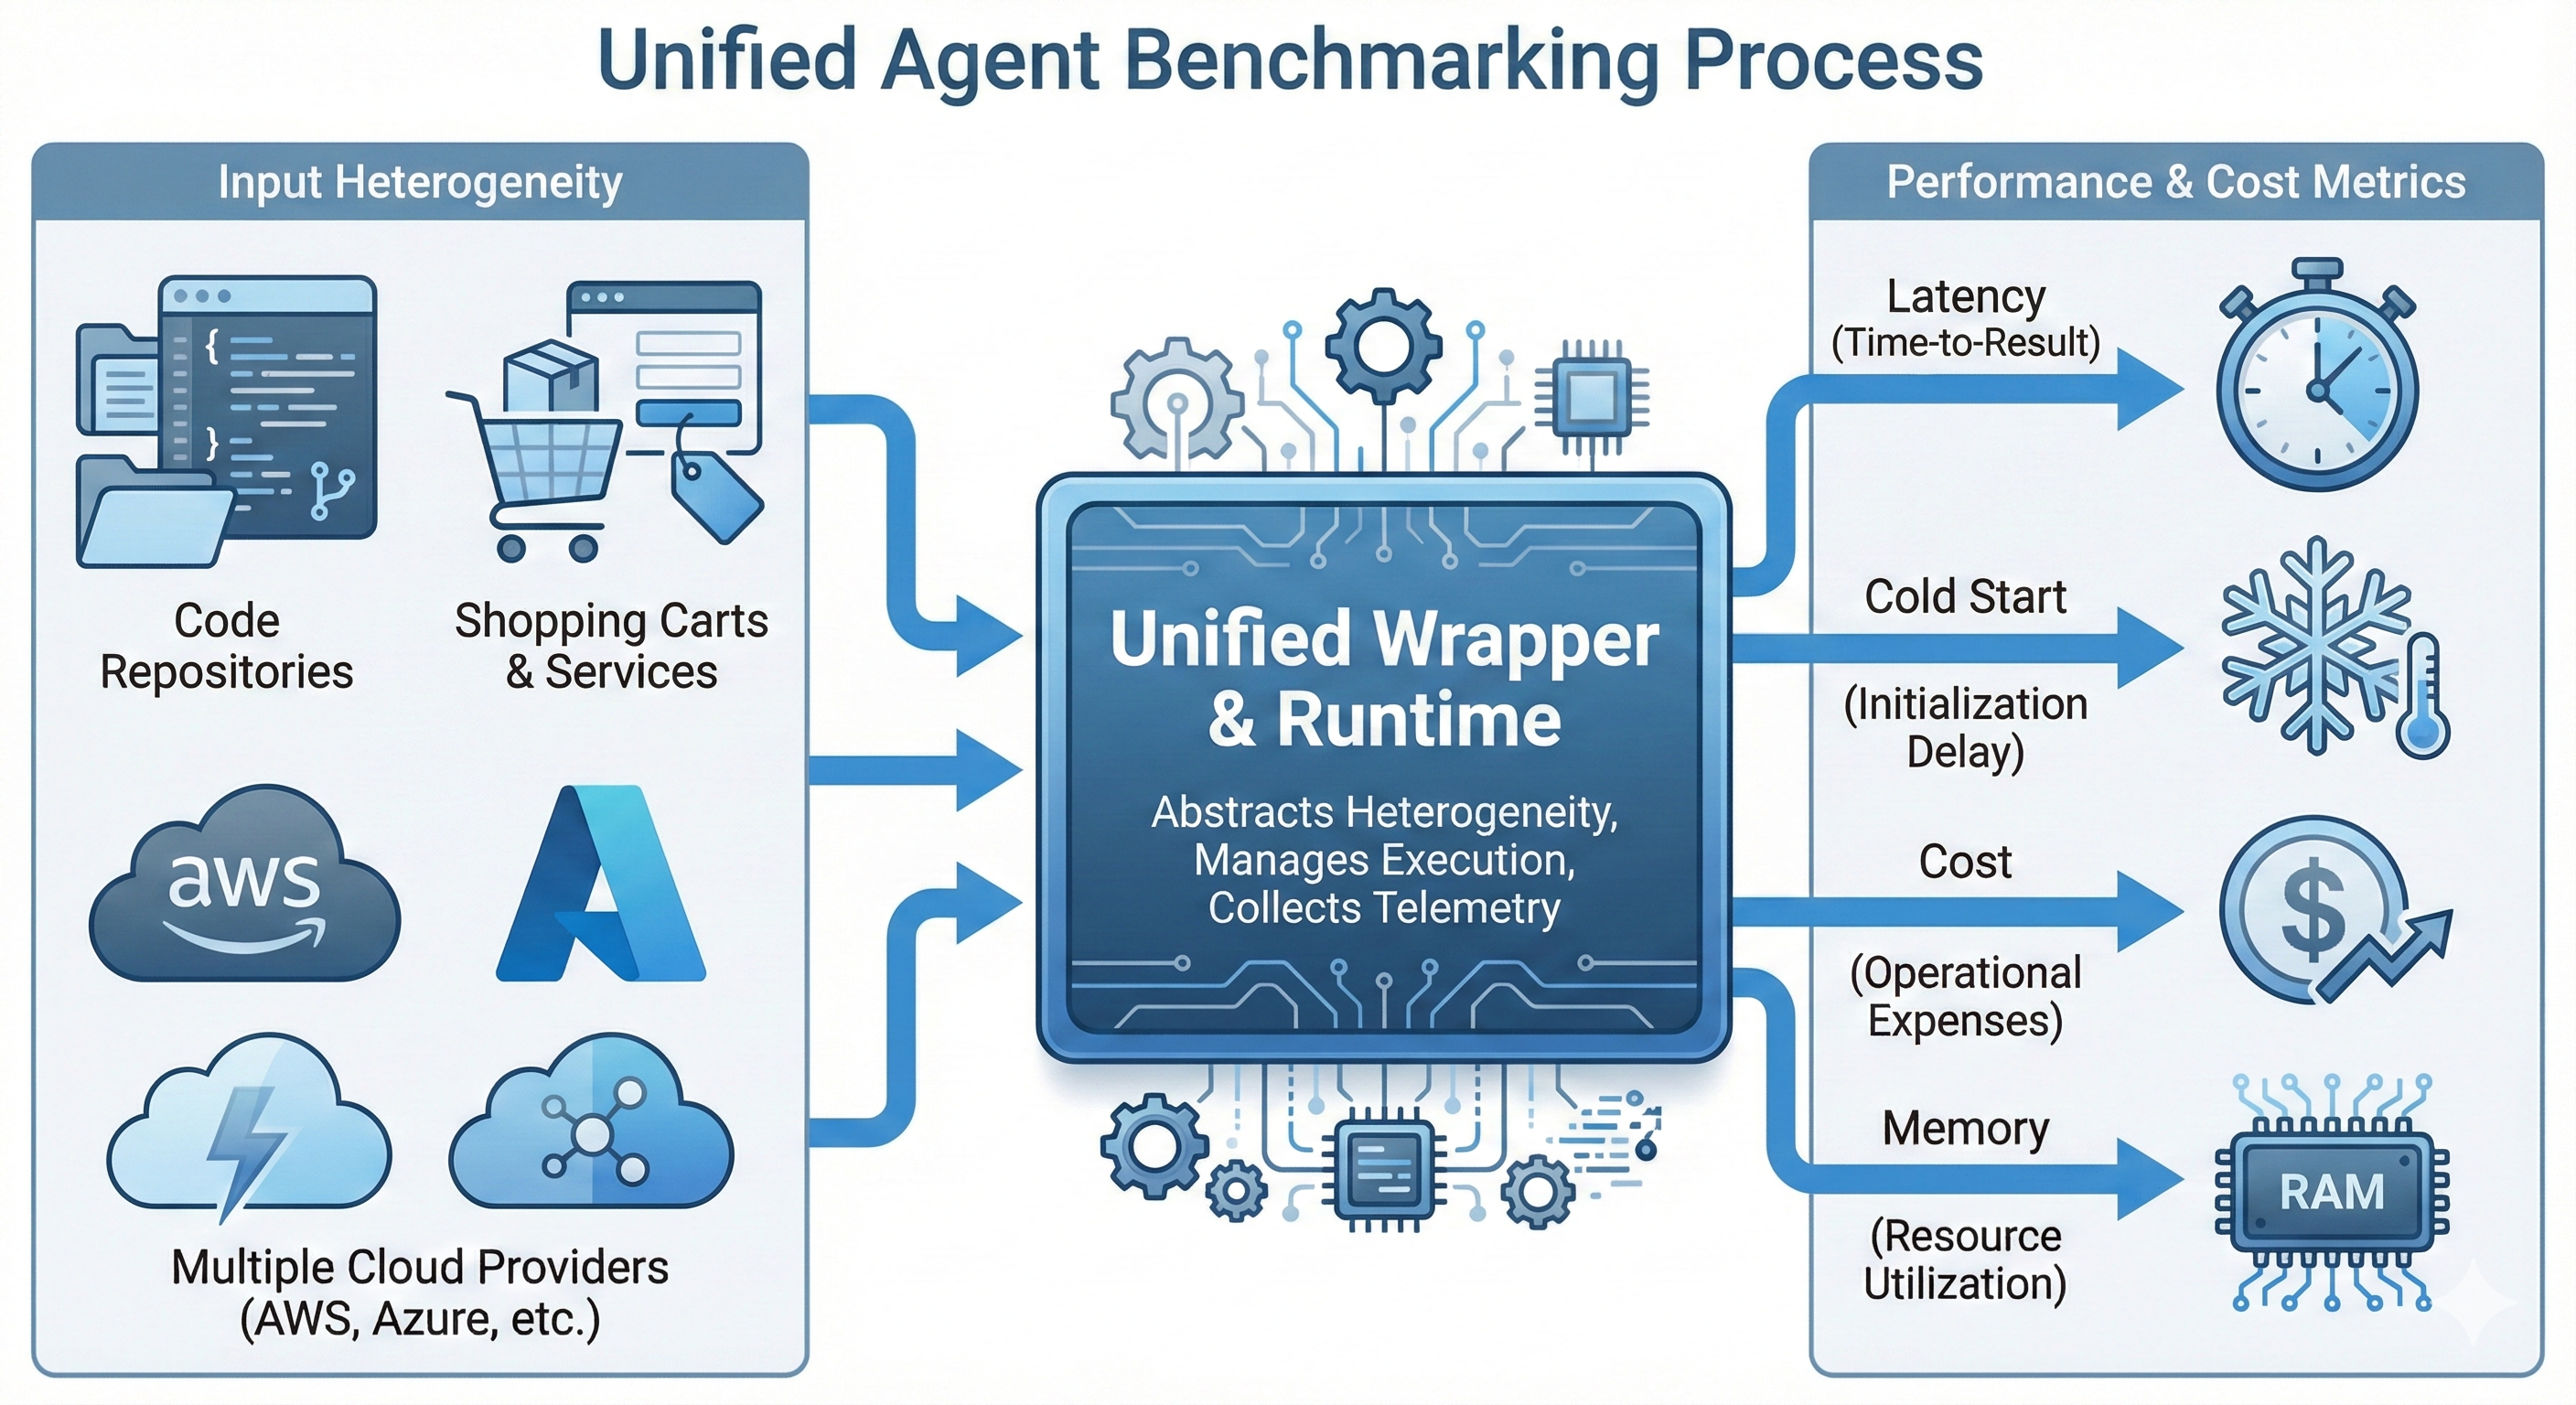
ATSuite is a framework for benchmarking AI agent infrastructure across different execution environments. It separates agent runtime behavior from LLM inference so you can measure how infrastructure choices affect end-to-end latency, cold starts, memory usage, and operating cost.
The project is built for agent workflows that use tools, MCP servers, and serverless functions. Instead of benchmarking model quality, ATSuite benchmarks the systems layer underneath the agent.
Why ATSuite
Modern agents increasingly rely on external tools and execution runtimes such as MCP servers and FaaS platforms. In practice, these runtime choices can have a large impact on:
- End-to-end response time
- Cold start overhead
- Memory consumption
- Invocation and storage cost
- Stateful tool execution behavior
Most agent benchmarks focus on task accuracy. ATSuite focuses on the infrastructure dimension.
How It Works
ATSuite follows a four-stage workflow:
- Capture or prepare an agent trace as a workflow DAG.
- Build each benchmark node into a target runtime form such as FaaS or Session-MCP.
- Deploy the built artifacts to a selected provider.
- Replay the trace and collect infrastructure metrics.
The workflow uses three main node types:
logic: control-flow nodesllm: recorded LLM callstool_use: external tool execution
Core Capabilities
- Unified benchmark format for agent workflow traces
- Support for stateless tools and stateful tools through Virtual Tool Service (VTS) abstractions
- Deployment targets for state-decoupled way (known as FaaS), and state-coupled way (such as cloud Session-MCP, E2B)
- Replay engine for trace-driven benchmark execution
- Analysis tooling for latency, memory, cold starts, and cost
Supported Providers and Modes
ATSuite currently works with these provider targets:
ali_fc
Alibaba Cloud Function Computeali_agentrun
Alibaba Cloud Session-MCP deploymentaws_lambda
AWS Lambdaaws_agentcore
AWS AgentCore Session-MCP deploymentgcp_faas
Google Cloud Functions style deploymentgcp_mcp
Google Cloud Session-MCP deploymentmcp_gateway
External MCP-Gateway/router deployment. ATSuite registers MCP server images and replays against the returned endpoint; sandbox lifecycle is managed outside this project.
SetMCP_GATEWAY_URLandMCP_GATEWAY_IMAGE_PREFIXbefore deploying to this provider.
Provider-specific setup notes live under docs/.
Installation
ATSuite uses uv for dependency management.
Prerequisites:
- Python 3.12+
uv- Docker
- Cloud or gateway credentials for the provider you want to use
Install the default dependency set:
uv sync --group aliyun
Install additional provider dependencies as needed:
uv sync --group aws
uv sync --group gcp
Quickstart
The basic workflow is build, deploy, then replay a trace.
1. Build benchmark images
uv run python -m tools.build_docker_images \
  --config benchmarks/TravelPlanner/config/faas7_mcp2_min.json \
  --provider aws_lambda
2. Deploy the benchmark
uv run python -m tools.deploy \
  --config benchmarks/TravelPlanner/config/faas7_mcp2_min.json \
  --provider aws_lambda
3. Replay the trace
uv run python -m tools.invoker \
  --config benchmarks/TravelPlanner/config/faas7_mcp2_min.json \
  --url-map url_results/faas7_mcp2_min.json \
  --provider aws_lambda \
  --uid demo
CLI Reference
Build images:
uv run python -m tools.build_docker_images --help
Deploy to a provider:
uv run python -m tools.deploy --help
Replay a trace:
uv run python -m tools.invoker --help
Start the trace viewer:
uv run python -m tools.trace_viewer_server --port 8000
Repository Layout
benchmarks/           Benchmark definitions, node code, configs, and traces
atsuite_sdk/           Tool SDK and in-container runtime wrappers
atsuite/                Main runtime, deployment, provider, and analysis code
  analysis/           Analyzer v2: events, collectors, pricing, aggregation, export
  cli/                First-class command implementations
tools/                Compatibility CLI wrappers
dockerfiles/          Provider-specific container build templates
docs/                 Provider guides, workflow docs, and implementation notes
web/trace_viewer/     Browser-based trace viewer
benchmarks/legacy/    Unsupported(still in progress) legacy workloads, including sandbox-only traces
Benchmarks Included
The repository includes several benchmark workloads, including:
TravelPlanner: tool-using travel planning workloadDataSciBench: data science and state-heavy workflowsScientificComputation: scientific tool workflow benchmarkClaudeCodeReview: replayable code-review benchmark
Each benchmark directory contains its own configs, node implementations, traces, and any benchmark-specific instructions.
Benchmark Structure
Each benchmark typically looks like this:
benchmarks/<name>/
  config/             Deployment and pipeline configuration
  nodes/              Tool implementations
  trace/              Captured workflow traces
  README.md           Benchmark-specific notes
A config file maps benchmark nodes to runtime targets and provider-specific deployment units.
Trace Inputs
ATSuite replays prepared workflow traces. A trace is a JSON DAG made of logic, llm, and tool_use nodes. Legacy sandbox traces are kept under benchmarks/legacy/ only as historical fixtures and are not supported by the current runtime path.
Documentation
Useful starting points:
docs/workflow_spec.md: workflow DAG formatdocs/aws.md: AWS notesdocs/gcp.md: GCP notesdocs/ali.md: Alibaba Cloud notesweb/trace_viewer/README.md: trace viewer usage
Creating New Benchmark Nodes
ATSuite exposes tool definitions through the registry in atsuite_sdk.abstract. A typical tool implementation looks like this:
from atsuite_sdk.abstract import registry


@registry.tool()
def my_tool(param: str) -> str:
    """Tool description used in generated schemas."""
    return "result"
To convert an existing agent tool into an ATSuite node layout, see docs/AGENT_TOOL_CONVERSION_GUIDE.md.
Current Scope
ATSuite is an active benchmarking framework rather than a polished end-user platform. Some documentation is still provider-specific or benchmark-specific, and parts of the repository reflect ongoing evaluation work. The top-level flow, however, is stable:
- Prepare a trace
- Build the runtime artifacts
- Deploy to a target provider
- Replay and analyze
Analyzer v2 writes three artifacts under results/<provider>/<benchmark>/:*.events.json for provider-neutral replay observations, *.report.json for
the normalized schema_version=2 report, and *.evidence.jsonl for full raw
provider evidence collected from SLS, CloudWatch, Cloud Logging, or Gateway
observability.
Yorumlar (0)
Yorum birakmak icin giris yap.
Yorum birakSonuc bulunamadi