uptimepage
Health Warn
- License — License: AGPL-3.0
- Description — Repository has a description
- Active repo — Last push 0 days ago
- Low visibility — Only 6 GitHub stars
Code Pass
- Code scan — Scanned 12 files during light audit, no dangerous patterns found
Permissions Pass
- Permissions — No dangerous permissions requested
No AI report is available for this listing yet.
Open-source uptime monitoring with a built-in public status page. HTTP/TCP/DNS/TLS + domain-expiry checks, automatic incidents, subscribers, multi-region probes, alerts (Slack/Telegram/webhook/+), a Terraform provider and an MCP server. One free plan. AGPL — self-host with docker compose.
uptimepage
Status pages + uptime monitoring. Open source, free to start. Live in 5 minutes.
Monitor HTTP, TCP, ICMP ping, cron-job heartbeats, DNS, TLS-certificate and
domain expiry, plus scripted browser login flows, from multiple regions — then
turn green and red into a polished
public status page your customers can subscribe to. Drive it by click, REST
API, or Terraform. Self-host the single binary or use the hosted service.


Try it free → · Docs · Self-host · Terraform · MCP
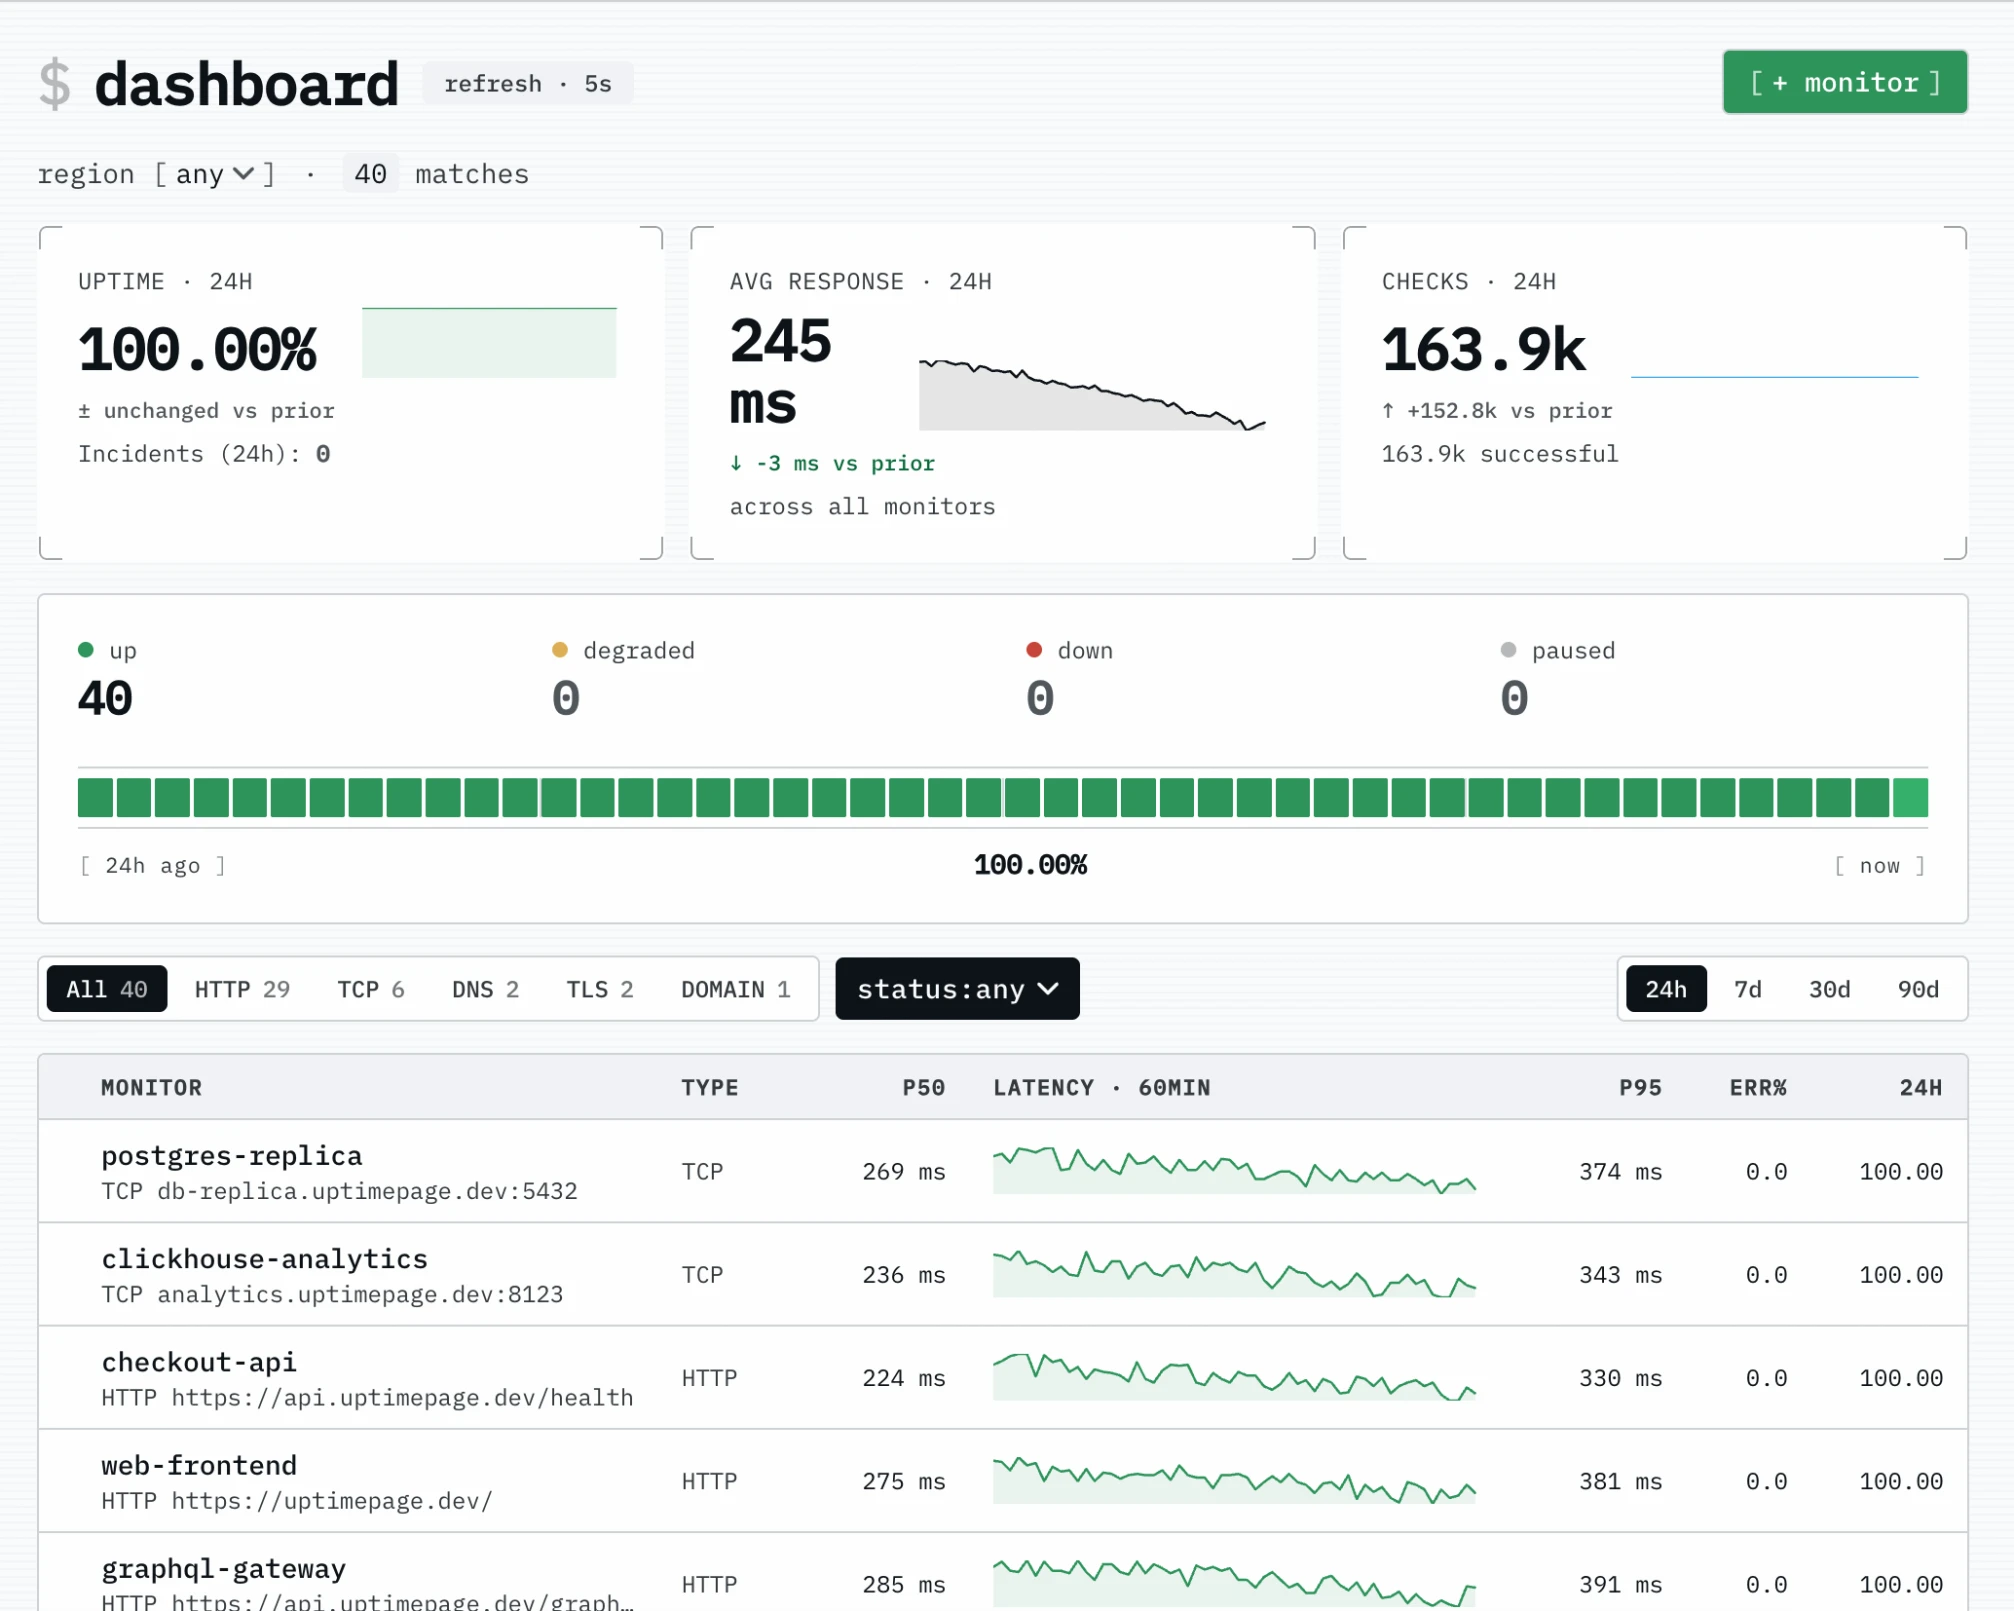
Quick start
Hosted, no install:
- Sign up at uptimepage.dev with GitHub or Google — no card.
- Add a monitor: paste a URL, pick a check type and interval, save.
- Bind a notification channel (Slack, email, PagerDuty, …) so failures reach you.
- Turn on a public status page and share the link.
Prefer code? Drive the same account by REST API, Terraform, or MCP. Want to run it yourself? Go to Self-host.
Why uptimepage
Monitoring with a built-in status page isn't new — the bet here is doing it
free, self-hostable, and fully as code:
- Free hosted tier, no card — and AGPL if you'd rather run it yourself.
- One self-contained binary —
docker compose upand you're live, not a Kubernetes platform to operate. - Everything as code — REST API, scoped tokens, an official Terraform provider, and an MCP server your LLM can query.
- Probes you own — run multi-region agents wherever your users are, on your own boxes.
- Status page + incidents + alerting in one — components, subscribers, and multi-channel paging that repeats until acknowledged, no second tool.
- Core isn't paywalled — checks, status pages, subscribers, the API and every alert channel are in the free tier.
Who it's for
- Founders / small SaaS — a professional status page in minutes, free, no self-host headache.
- Platform / SRE leads — monitors as code, multi-region probes, incident paging to your on-call channels, without vendor sprawl.
- Self-hosters — one binary plus two databases, no SaaS lock-in.
Live status
uptimepage monitors itself. These badges are served by the running app from a
public status page — no third-party service, no cron job updating a JSON file.

| Surface | HTTP | DNS | TLS cert | Domain |
|---|---|---|---|---|
| uptimepage.dev (website) |  |
 |
 |
 |
| app.uptimepage.dev (dashboard) |  |
|||
| mcp.uptimepage.dev (MCP) |  |
Embed your own with the snippet in Settings → Pages → your page → Badge.
Features
| Checks | HTTP, TCP, ICMP ping, heartbeat (inbound dead-man's-switch), DNS, TLS-cert expiry, domain expiry, browser login flow — per-host circuit breaking, designed for ~50k concurrent in-flight |
| Public status page | HTML + JSON + RSS, per-component opt-in, incident narration, maintenance windows, email + webhook subscribers |
| Alerting | Slack, PagerDuty, Discord, Microsoft Teams, Google Chat, Telegram, WhatsApp, SMS, email, webhook, ntfy, Pushover — per-org channels, sealed secrets, fire-once + recovery, repeat until acknowledged |
| Incidents | Internal incident state ⊥ public phase, acknowledge to silence paging, per-monitor reminder cadence |
| Multi-region | Regional probe agents, per-region views, run your own agent anywhere |
| Automation | REST API, scoped API tokens, Terraform provider, MCP server for LLM clients |
| Built on | Rust 1.95 / Tokio / Axum, Postgres + ClickHouse, one ~23 MB self-contained binary |
Live service: https://uptimepage.dev — hosted, free, sign in with GitHub or Google.
Full docs: https://uptimepage.dev/docs
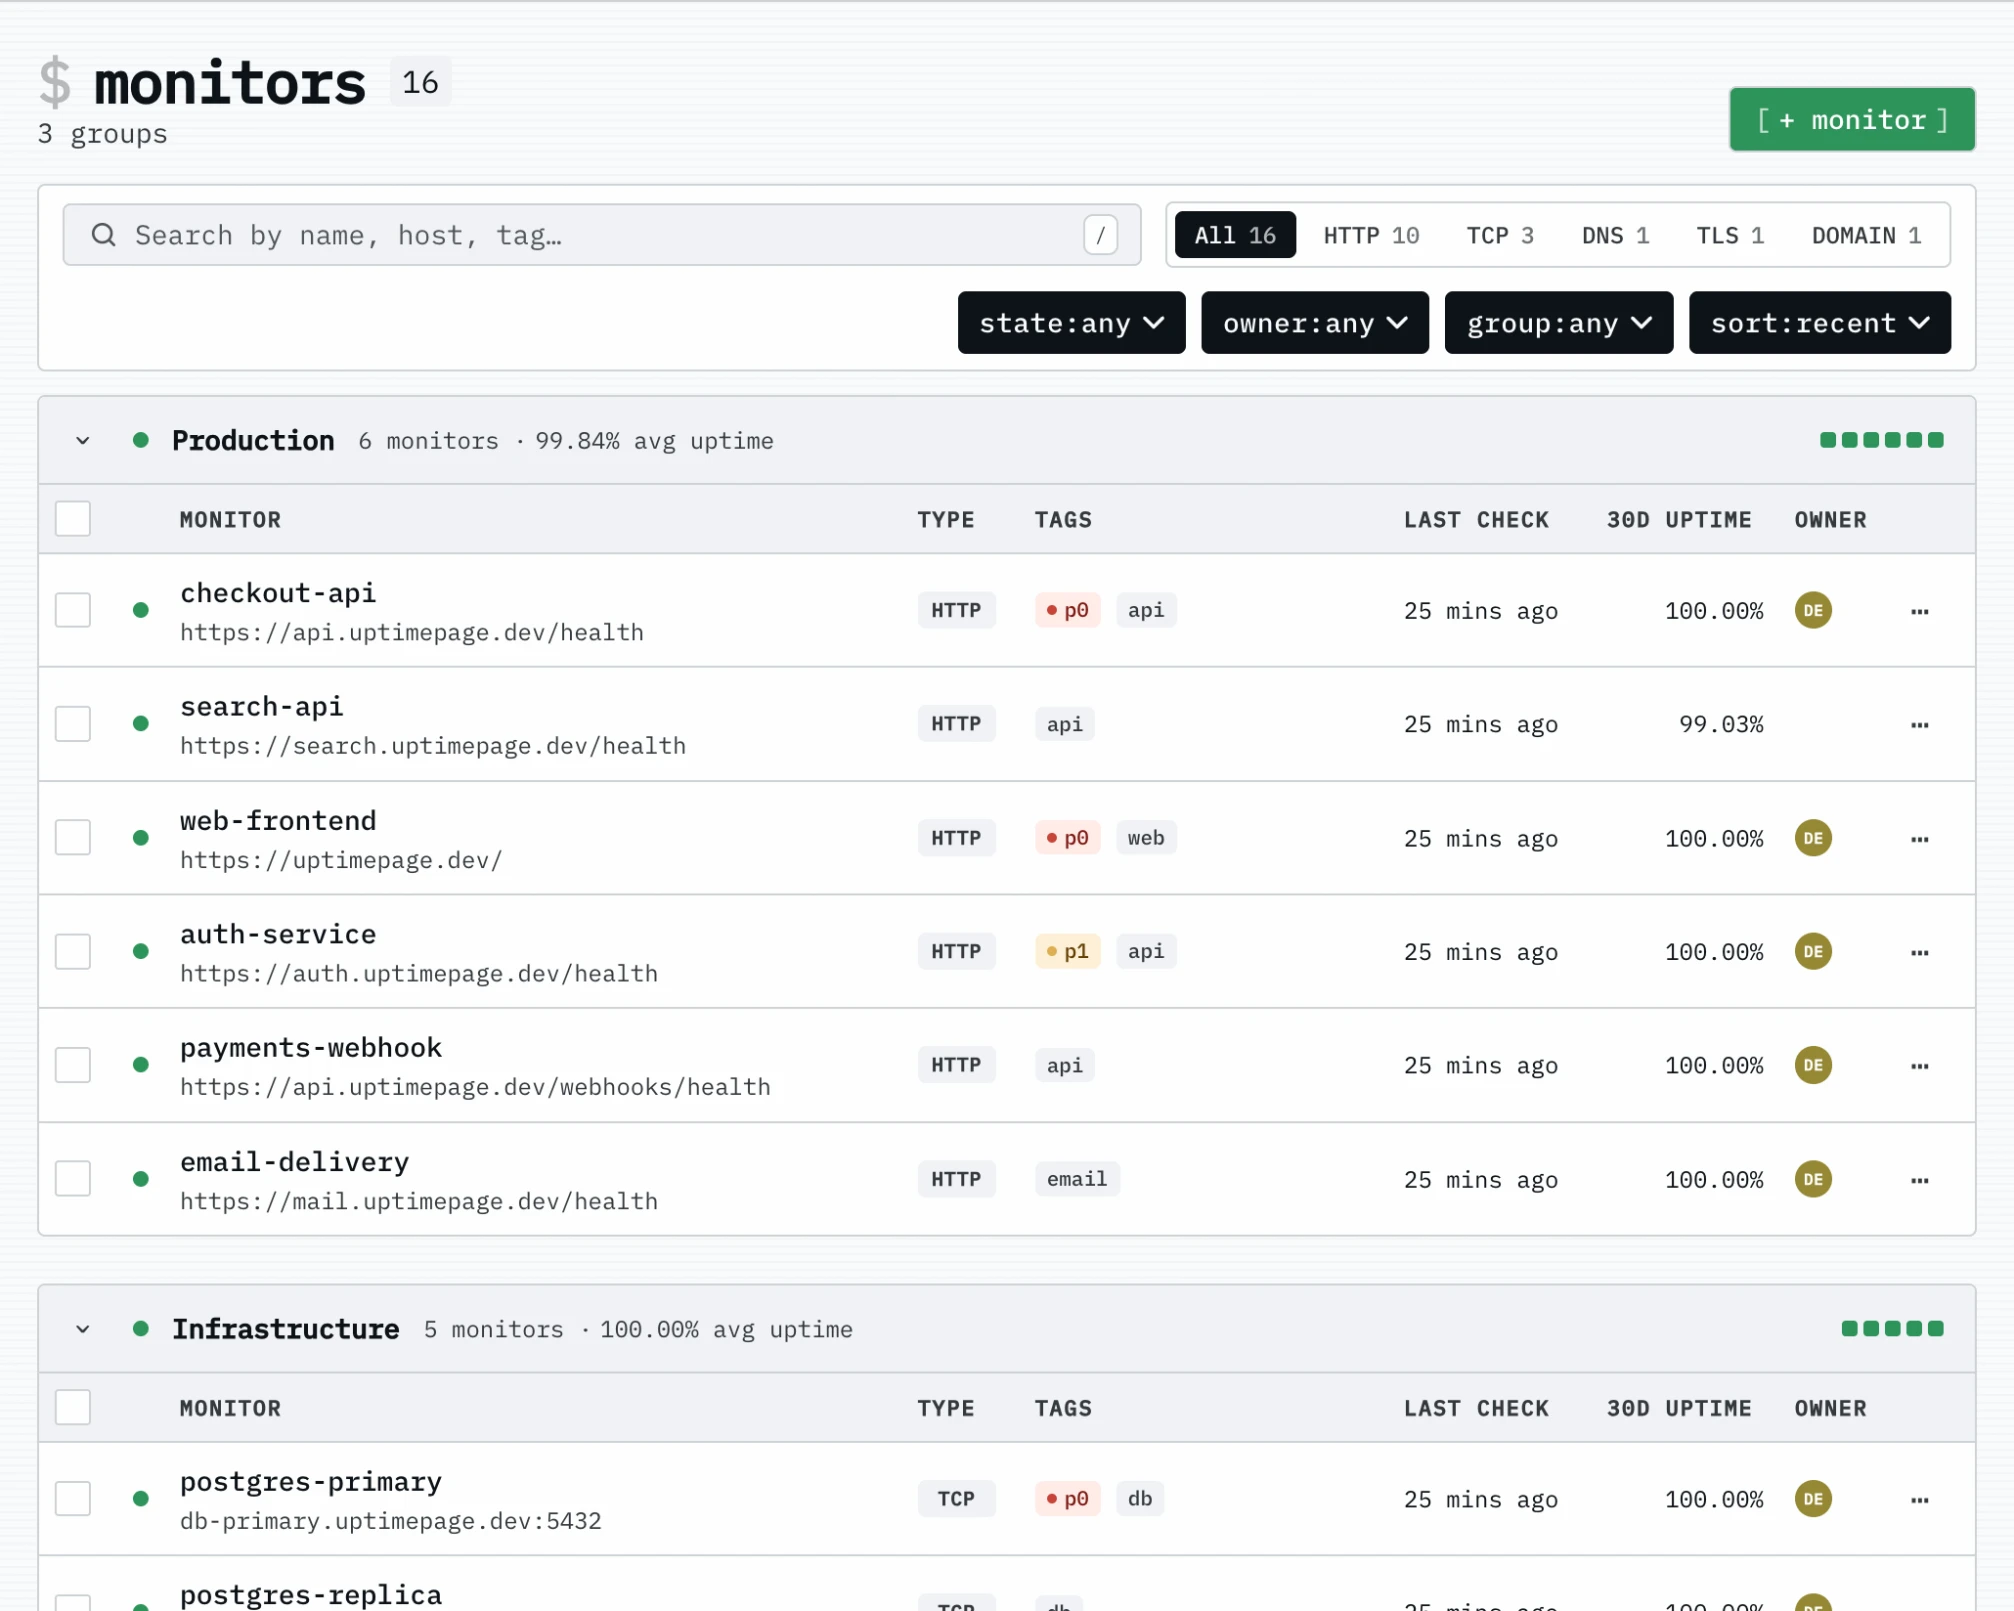
Monitors — grouped by environment, filterable by type, tag, or owner
Check types
| Type | Purpose | Default interval | Floor |
|---|---|---|---|
http |
request a URL, match status / body / latency | 60 s | max(plan_min, 10 s) |
tcp |
open a TCP socket within a timeout | 60 s | max(plan_min, 10 s) |
ping |
ICMP echo request, fail on a missing reply | 60 s | max(plan_min, 10 s) |
heartbeat |
your job pings a URL; a missing ping past period + grace opens an incident | 60 s | max(plan_min, 60 s) |
dns |
resolve a record, optionally match a value | 60 s | max(plan_min, 10 s) |
tls_cert |
open TLS, parse leaf cert, alert before notAfter |
86 400 s (daily) | max(plan_min, 3600 s) |
domain_expiry |
query RDAP, alert before the domain's expiration event |
86 400 s (daily) | max(plan_min, 3600 s) |
flow |
drive a headless browser through login / transaction steps, assert the result | 300 s | max(plan_min, 300 s) |
tls_cert and domain_expiry use warn_days / critical_days thresholds and surface days_remaining plus registrar / cert subject in the result payload. Their floor is 1 hour regardless of plan — these probes track values that change on a scale of days, not minutes. flow runs a real browser, so it only executes where a browser engine is available (its regions clamp to the flow-capable set) and the number of flow monitors is capped per plan; put credentials in an org secret and reference them as {{name}}. See docs/api.md for the full payload shapes.
Public status page
A customer-facing /status page (HTML + JSON + RSS 2.0) is built into the binary. Per-target opt-in via public_status; the page bypasses basic auth at the Caddy layer with a per-IP rate limit, caches for 10 s in-process, and degrades gracefully if ClickHouse is unreachable. Operators narrate incidents (PATCH /api/v1/incidents/{id}, POST /api/v1/incidents/{id}/updates) and schedule maintenance windows (POST /api/v1/maintenance). Visitors subscribe for email or webhook updates. See docs/public-status.md.
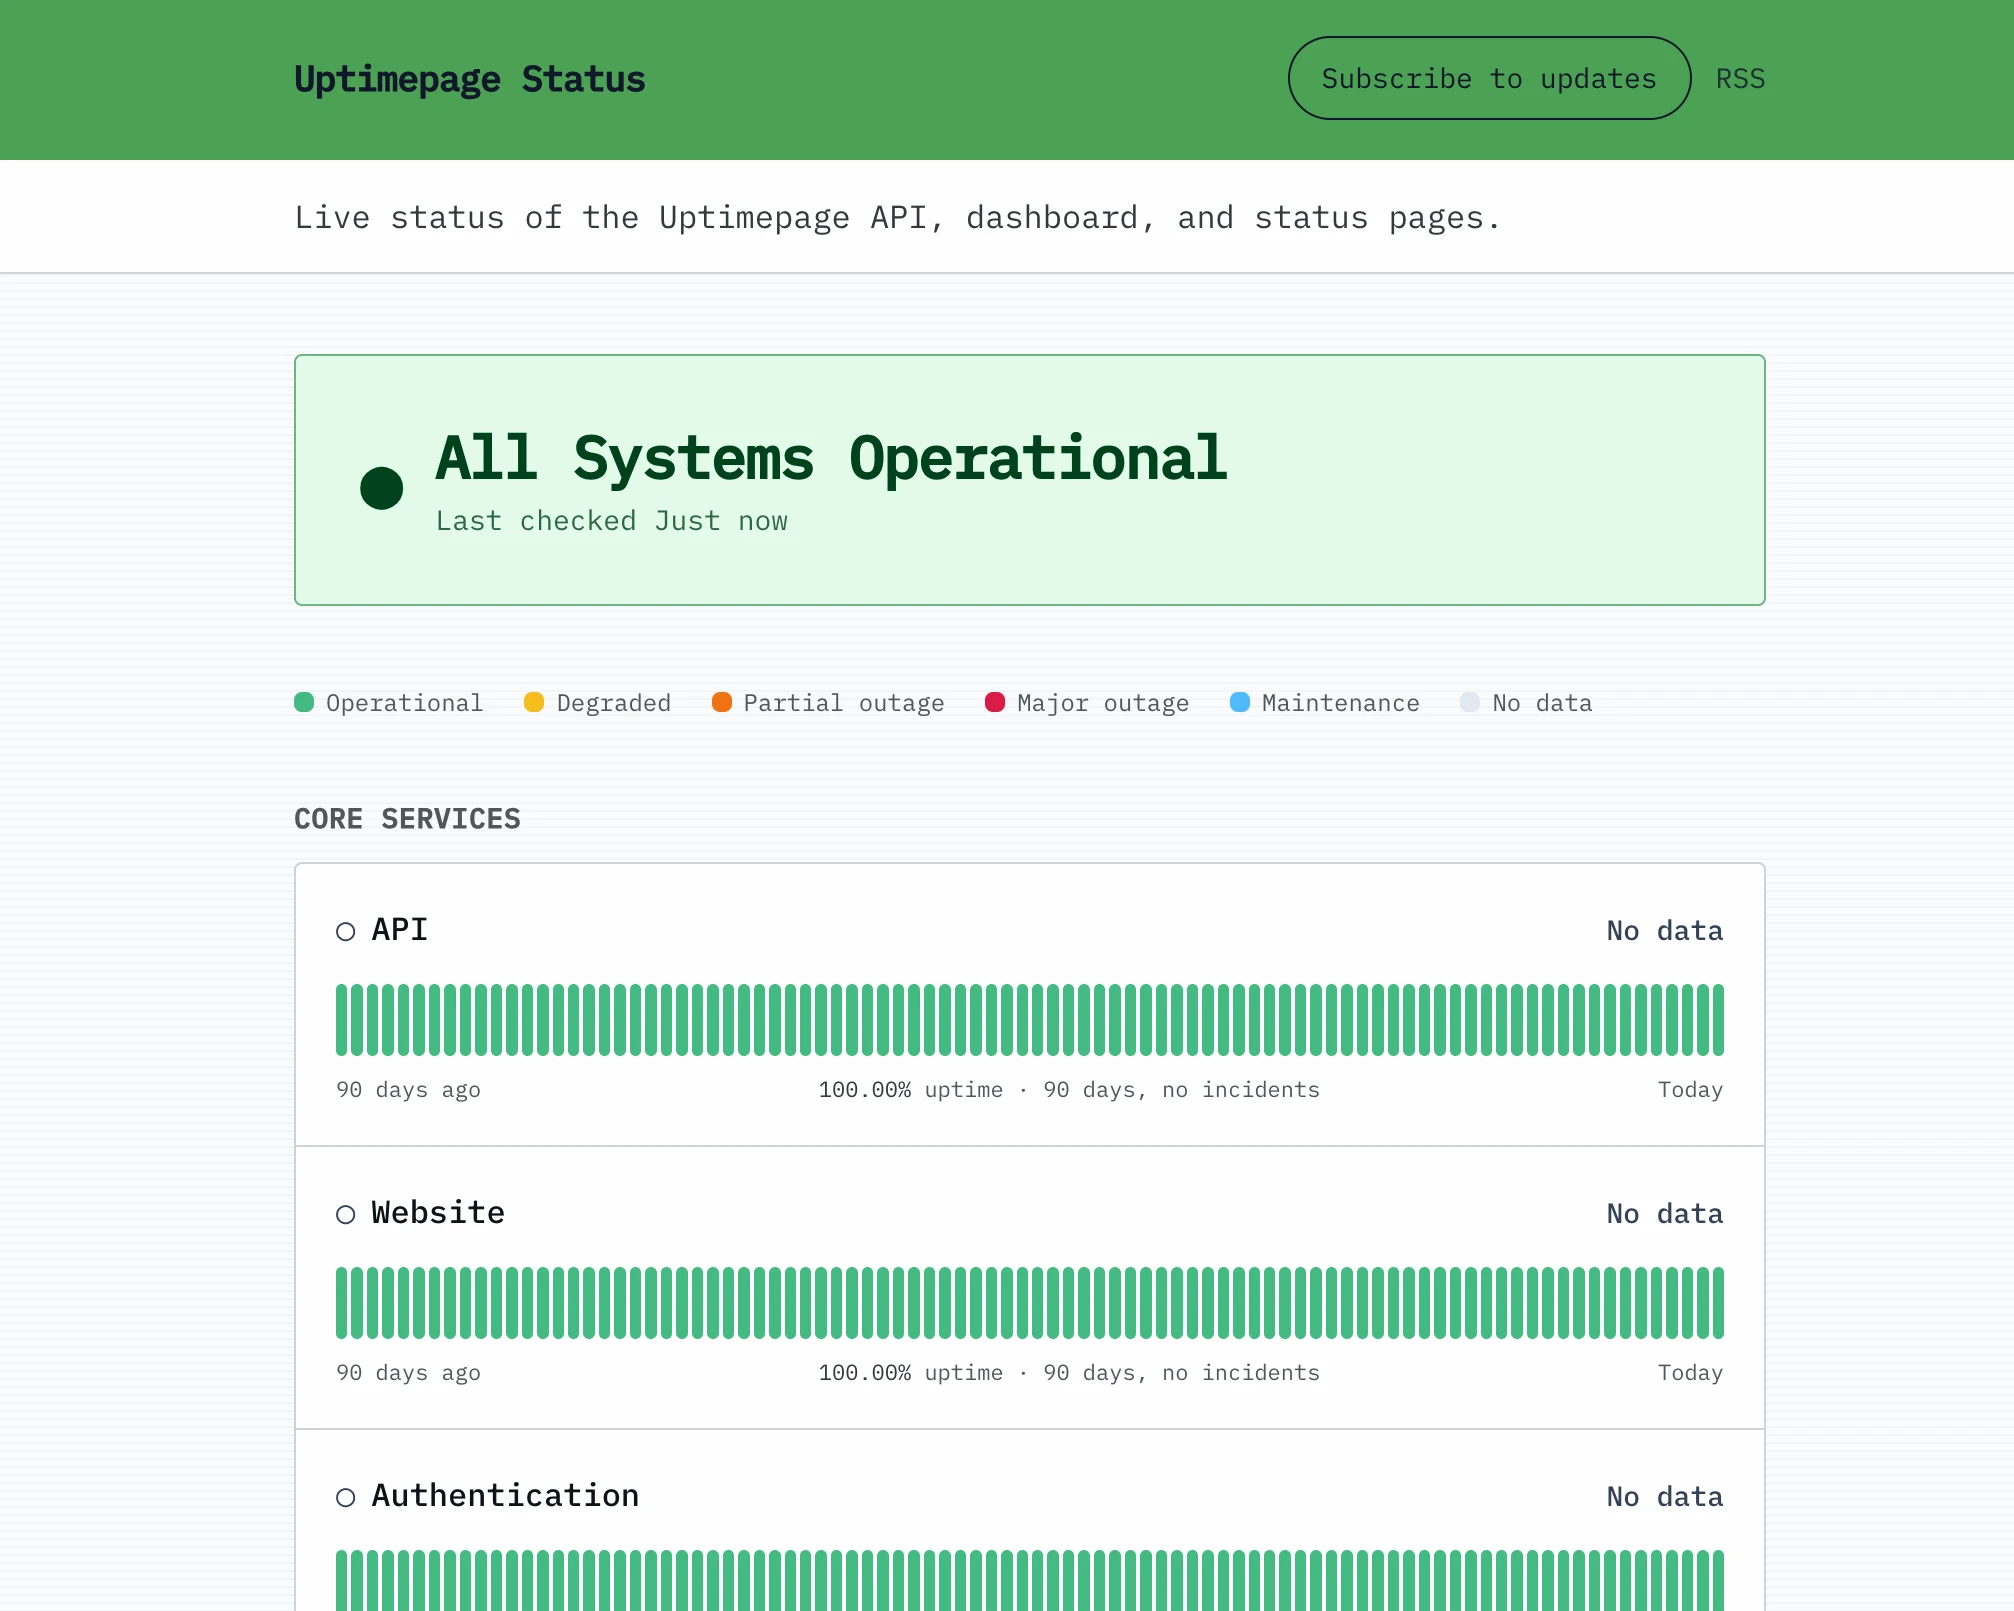
Public status page — 90 days of history per component
Alerting
Notification channels are per-org resources (Slack incoming webhook, generic
HTTP webhook, Telegram bot, SMS gateway, …) created via /api/v1/notification-channels.
Transport secrets are sealed at rest and never echoed back.
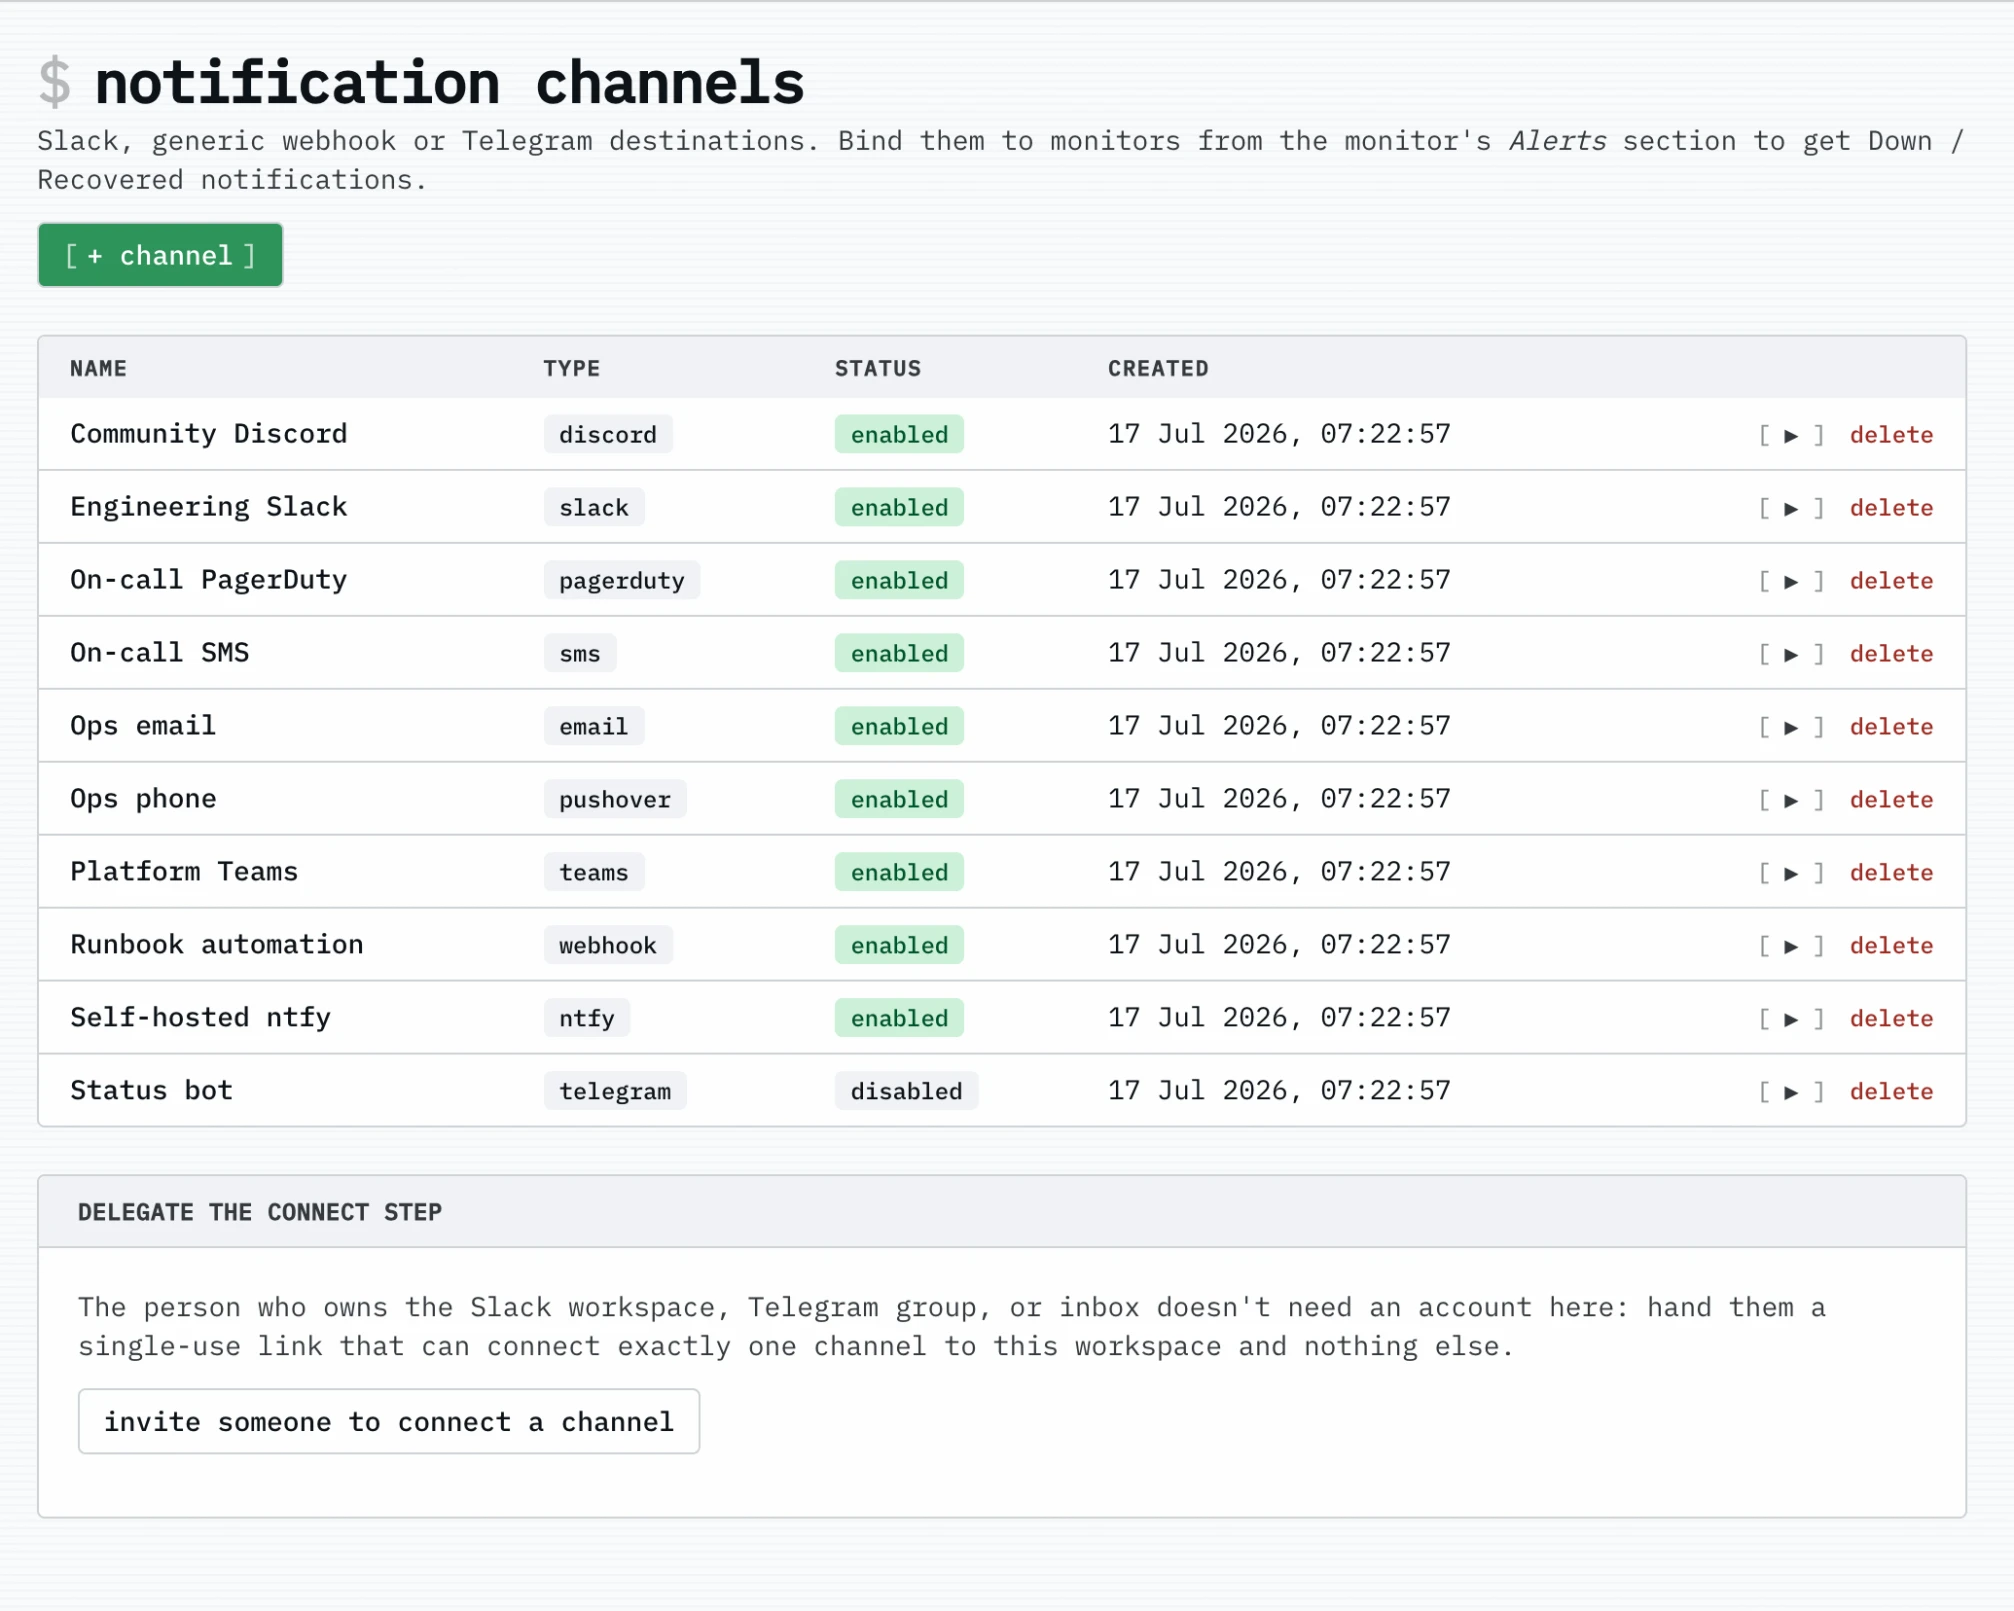
Alerting — Slack, PagerDuty, SMS, webhook, and seven more
A target opts in by binding one or more channels in its alerts array:
"alerts": [
  { "channel_id": "0192…", "after_failures": 3 },
  { "channel_id": "0193…", "after_failures": 6, "notify_recovery": false }
]
Fire-once + recovery semantics. Channels are tenant-isolated — a target can
only bind a channel its own org owns. See docs/api.md for the
full contract.
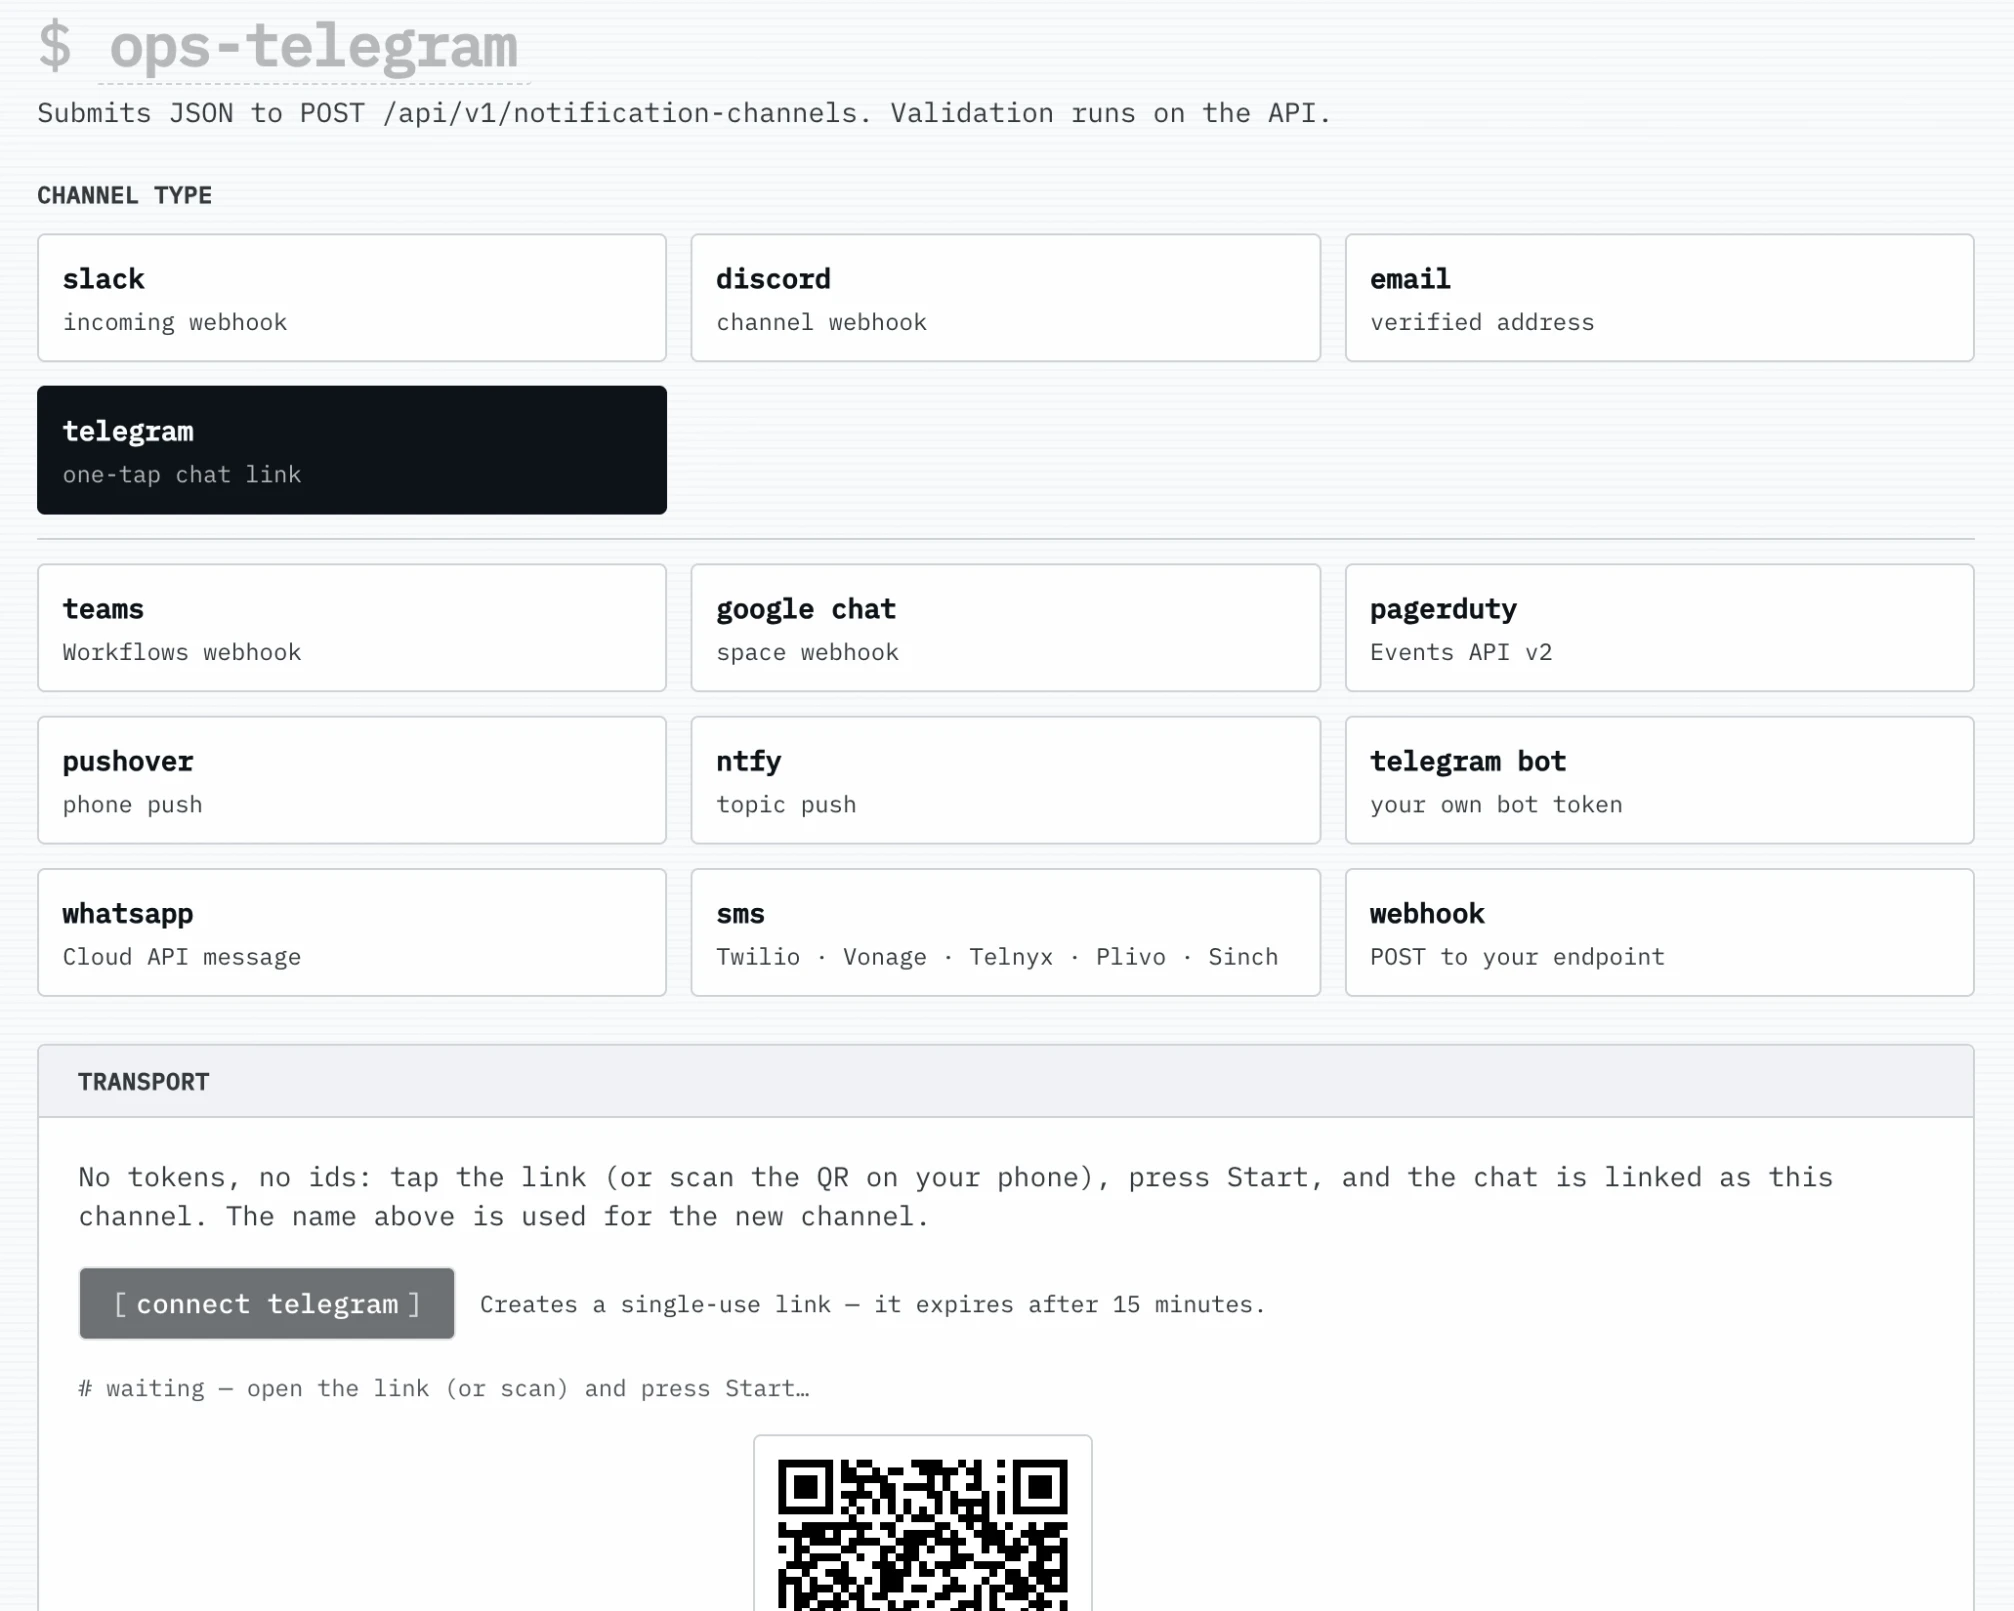
Adding a channel — pick a transport, paste one credential
Multi-region
Run probe agents in the regions your users live in; the control plane assigns
checks per region and the dashboard and status page can be viewed per-region.
Bring your own agent anywhere — a single binary with an org-scoped token. See
docs/multi-region.md.
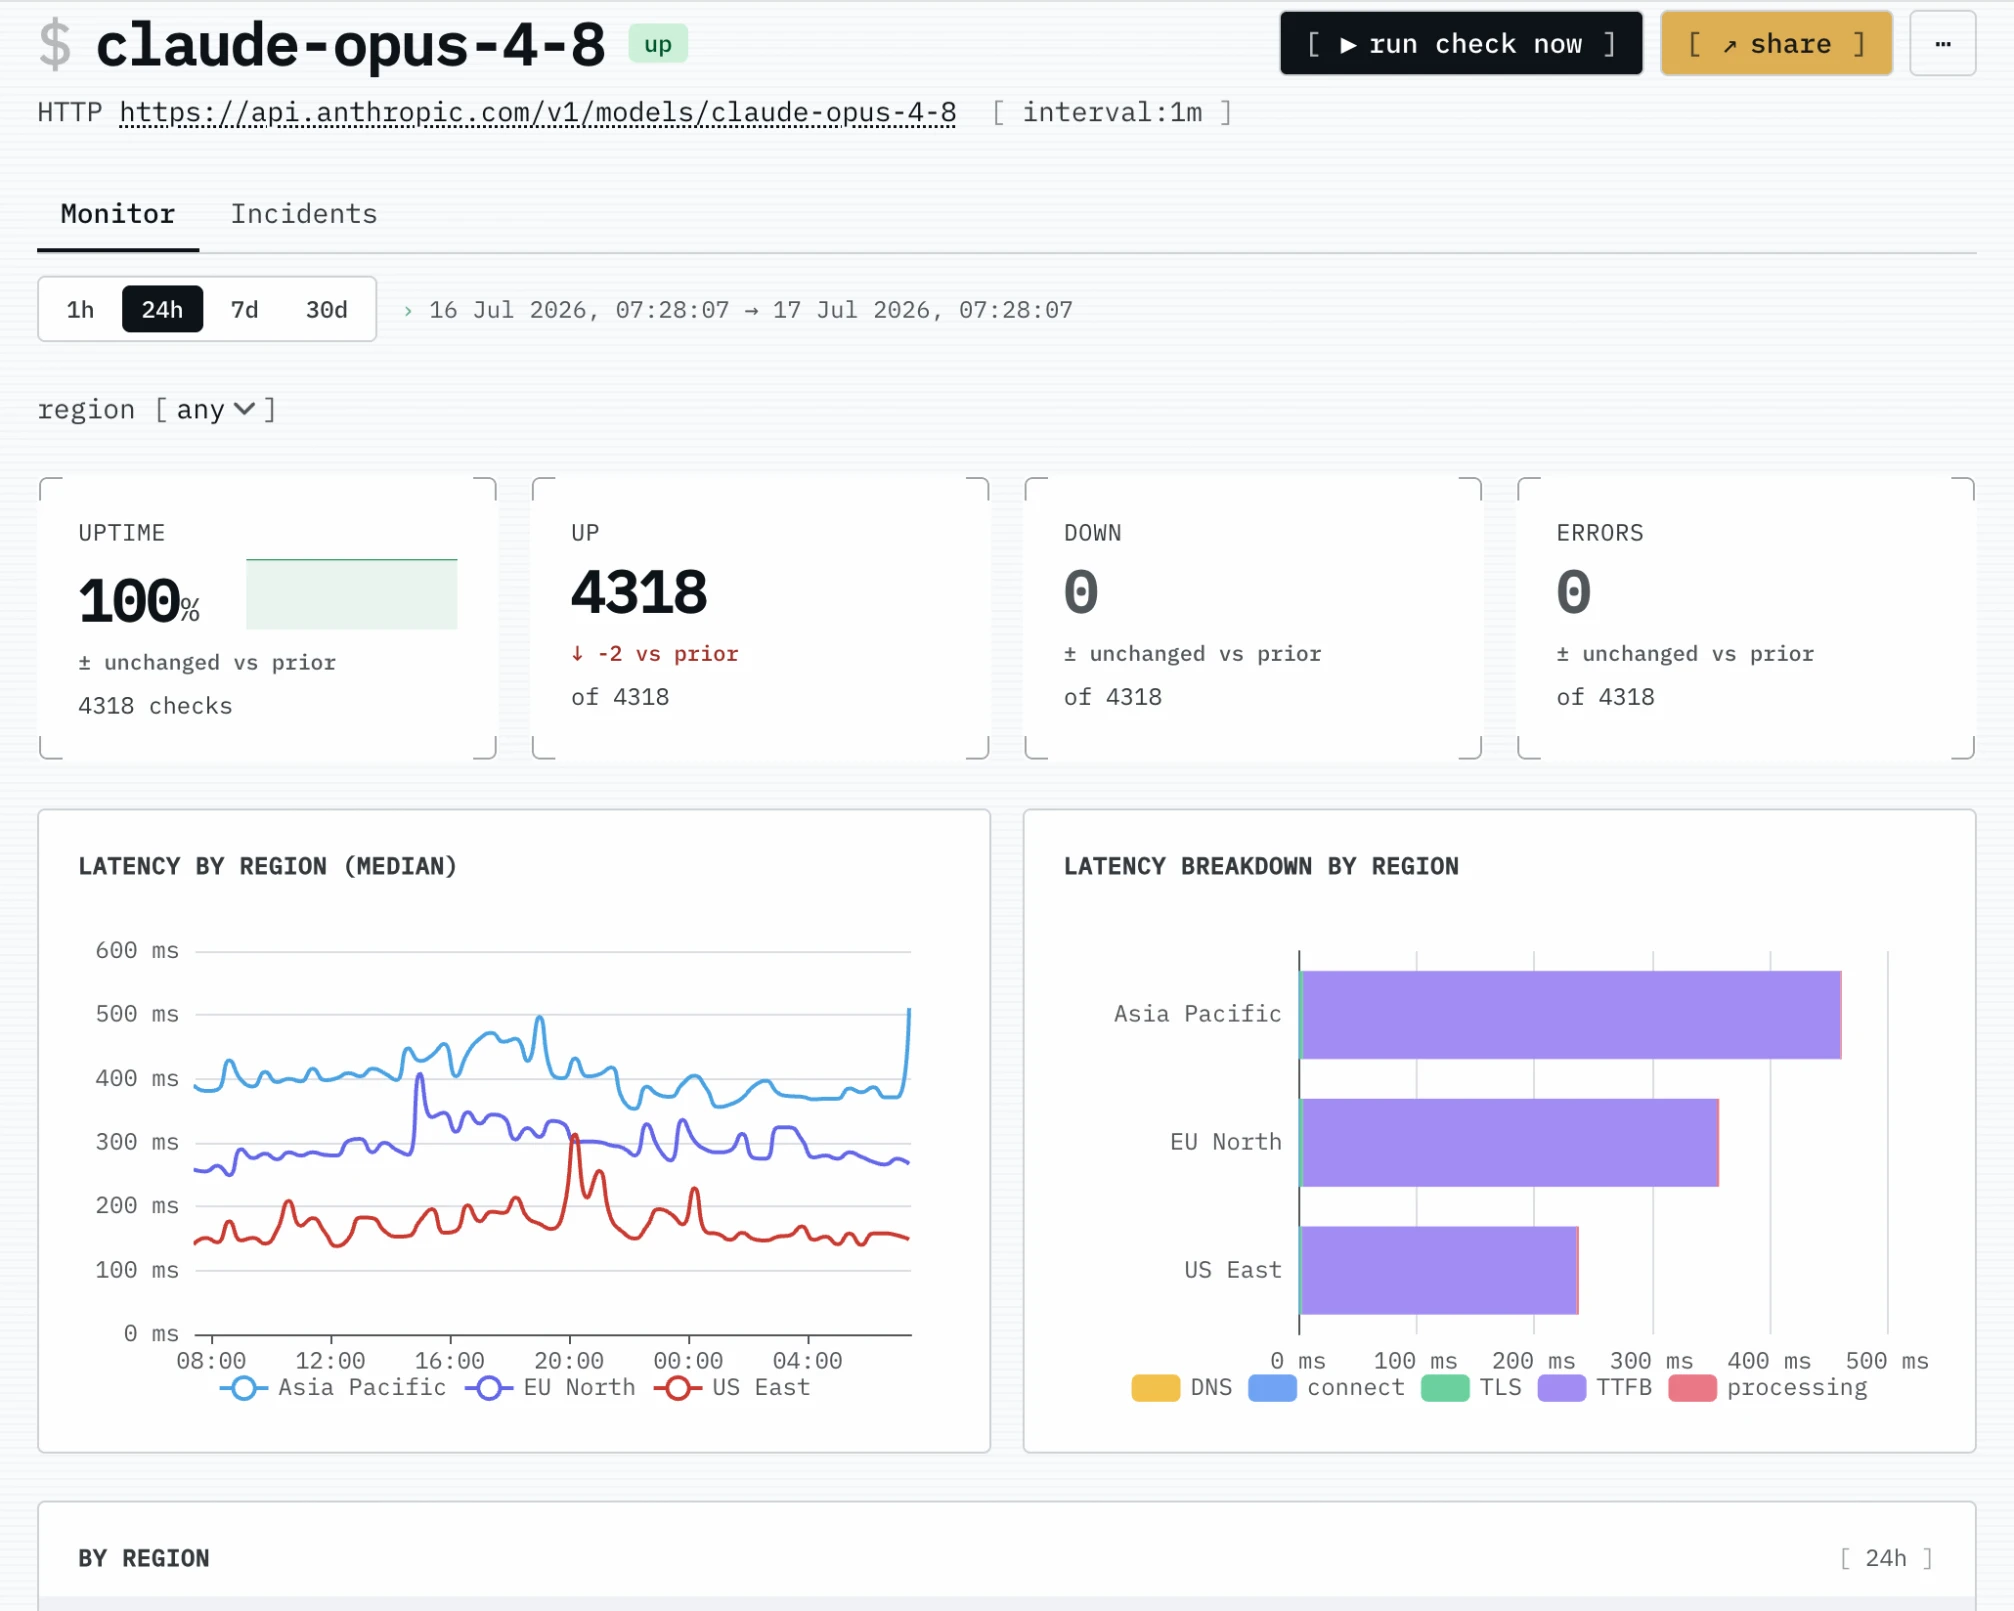
Monitor detail — latency broken down by region
Terraform
Manage targets and notification channels as code with the official provideruptimepage/uptimepage
(source):
terraform {
  required_providers {
    uptimepage = {
      source = "uptimepage/uptimepage"
    }
  }
}

provider "uptimepage" {
  token = var.uptimepage_token # or set UPTIMEPAGE_TOKEN
  org   = "your-org-slug"      # required for managed resources; or UPTIMEPAGE_ORG
  # endpoint defaults to https://app.uptimepage.dev; set it for a self-hosted instance
}

resource "uptimepage_target" "api" {
  name     = "api prod"
  interval = 60
  check = {
    type = "http"
    http = {
      url             = "https://example.com/healthz"
      expected_status = { kind = "exact", exact = 200 }
    }
  }
}
MCP server
An MCP server lets an LLM client (the claude.ai connector, Claude Desktop, an IDE) answer questions about one org's monitors and take a few guarded actions, over Streamable HTTP at /mcp. Ten read-only tools plus six write tools (each scope-gated, confirmed per action, and audited). Auth is an org-bound scoped token — paste one by hand, or use the one-click OAuth 2.1 connector. Off by default; enable with UPTIMEPAGE_MCP_ENABLED=true (+ MCP_OAUTH_ENABLED for the connector). See docs/mcp.md.
Self-host
Docker (recommended)
docker compose up -d
Brings up Postgres 18, ClickHouse 26.3, and the monitor. Migrations for both databases run at process startup — no init-script wiring, no external migrator.
Create the first owner account (the sign-in providers all assume an account already exists, so seed one out of band):
docker compose exec uptimepage uptimepage bootstrap-owner --email [email protected]
It prints, shown only once: a one-time link that signs you straight into the web dashboard, and a full-access API token plus the org slug. Open the link to reach the dashboard; use the token for the API. Create a target:
curl -X POST http://127.0.0.1:8080/api/v1/targets \
  -H 'authorization: Bearer <token>' \
  -H 'x-uptimepage-org: <org-slug>' \
  -H 'content-type: application/json' \
  -d '{
    "name": "example",
    "check": {
      "type": "http",
      "url": "https://example.com/",
      "method": "GET",
      "timeout": 5000,
      "follow_redirects": false,
      "max_redirects": 0,
      "expected_status": { "kind": "exact", "value": 200 },
      "headers": {},
      "verify_tls": true
    },
    "interval": 60,
    "enabled": true,
    "tags": []
  }'
Read uptime, scrape metrics:
curl -H 'authorization: Bearer <token>' -H 'x-uptimepage-org: <org-slug>' \
  http://127.0.0.1:8080/api/v1/targets/<id>/uptime
curl http://127.0.0.1:9090/metrics
The bootstrap link signs you in once. For ongoing sign-in — and for inviting a team — configure a sign-in provider: GitHub or Google OAuth, or a real email provider for magic links ([auth.github] / [auth.google] / [email] in config/default.toml, or the matching env vars). See docs/authentication.md.
Production deployment
For a production deployment with TLS, basic auth, and proper hardening (Caddy edge, Postgres + ClickHouse internal-only, ClickHouse memory cap), see deployment/README.md or docs/deployment.md. The local dev stack above is fine for evaluation; do not expose it to the internet.
Local build
cargo build --release
./target/release/uptimepage
Requires Postgres and ClickHouse reachable at the URLs in config/default.toml, plus a non-empty fingerprint salt (the app refuses to boot without one):
export UPTIMEPAGE_AUTH__FINGERPRINT_SALT=$(openssl rand -base64 32)
To run against the compose stack without rebuilding the container:
docker compose up -d postgres clickhouse
cargo run --release
Docs
Hosted: https://uptimepage.dev/docs
Sources under docs/ — readable directly on GitHub too:
| File | Covers |
|---|---|
| docs/architecture.md | goals, module layout, data flow, key design choices, concurrency model |
| docs/api.md | REST endpoints, check-spec payload shapes, result + uptime queries |
| docs/public-status.md | operator guide to the public /status page: components, incidents, maintenance |
| docs/authentication.md | sign-in, sessions, scoped API tokens, org binding |
| docs/multi-region.md | regional probe agents, the operator surface, running an agent, per-region views |
| docs/mcp.md | MCP server for LLM clients: tools, scopes, OAuth connector, enabling, examples |
| docs/configuration.md | default.toml reference, env override scheme, tuning notes |
| docs/metrics.md | Prometheus series (incl. connect / TLS / pool gauges), OpenTelemetry tracing |
| docs/deployment.md | Docker, bind addresses, migrations, sizing, graceful shutdown |
| docs/development.md | local dev workflow, the web UI (stack, routes, adding a page, tests), faster builds |
| docs/loadtest.md | bin/loadtest envs, macOS gotchas, HTTP/1 vs h2c trade-off, Linux container path |
| docs/benchmarks.md | Criterion micro-benchmarks, single-core throughput, profile breakdown |
| docs/troubleshooting.md | common failures and how to read them off metrics |
Web UI
The single binary serves both the /api/v1/* JSON surface and a server-rendered HTML UI at / — askama compile-time templates, HTMX for partial swaps and JSON forms (no SPA framework), Tailwind CSS 4, and lazy-loaded ECharts. Every UI mutation hits an existing /api/v1/* endpoint, so the API stays the single source of truth. Stack, routes, the add-a-page recipe, and UI tests are in docs/development.md.
Legal
A running instance serves its policies at /terms, /privacy, /cookies,/impressum, /abuse-policy, /security-policy, and an RFC 9116/.well-known/security.txt. The source documents are indocs/legal/. GDPR self-service (data export, account
deletion, recovery) lives under /settings/account.
License
uptimepage is licensed under AGPL-3.0. See LICENSING.md
for what this means in practice.
If you'd like to contribute, see CONTRIBUTING.md.
For security disclosures, see SECURITY.md.
Reviews (0)
Sign in to leave a review.
Leave a reviewNo results found