alive-analysis
Health Gecti
- License — License: MIT
- Description — Repository has a description
- Active repo — Last push 0 days ago
- Community trust — 37 GitHub stars
Code Gecti
- Code scan — Scanned 12 files during light audit, no dangerous patterns found
Permissions Gecti
- Permissions — No dangerous permissions requested
Bu listing icin henuz AI raporu yok.
Data analysis workflow kit for AI coding agents. Structure your analysis with the ALIVE loop — Ask, Look, Investigate, Voice, Evolve.
alive-analysis
Structured analysis workflow for AI coding agents — every analysis traceable, repeatable, and team-shareable.


Why this exists
You ask Claude to investigate a metric drop. It gives you an answer. You act on it.
Three months later: "Why did we change that?" — gone. No reasoning, no data checks, no audit trail.
Or you open a new chat and explain the whole context again from scratch, repeating work that already happened.
alive-analysis solves this by turning every analysis into a structured, version-controlled workflow. Claude guides you through a five-stage loop. Each stage produces a markdown file. Everything stays in your repo, searchable by you and by Claude.
The result: a growing knowledge base of how your team thinks, not just what it decided.
How it works
You describe a question  →  /analysis-new
                                 ↓
         Claude walks you through 5 stages:
         ASK → LOOK → INVESTIGATE → VOICE → EVOLVE
                                 ↓
              Each stage = one markdown file in analyses/
                                 ↓
         Files are Git-tracked, full-text searchable,
         readable by Claude in future conversations
                                 ↓
         Six months later: /analysis-search "checkout drop"
         → Claude surfaces context, findings, and follow-ups
Installation
# Clone the repo
git clone https://github.com/with-geun/alive-analysis.git /tmp/alive-analysis

# Install — pick your platform
bash /tmp/alive-analysis/install.sh              # Claude Code
bash /tmp/alive-analysis/install.sh --cursor     # Cursor
bash /tmp/alive-analysis/install.sh --both       # Both

# One-time setup — run in your AI agent chat (not the terminal)
/analysis-init    # Configure language, team, data stack, key metrics
/analysis-new     # Start your first analysis
That's it. Claude handles the rest.
The ALIVE Loop
Every analysis follows the same five-stage structure. Each stage has a clear purpose, a checklist, and a quality gate before moving forward.
| Stage | Question | Output |
|---|---|---|
| ❓ ASK | What do we want to know — and why? | Hypothesis tree, scope, success criteria |
| 👀 LOOK | What does the data actually show? | Data quality verdict, SQL templates |
| 🔍 INVESTIGATE | Why is it really happening? | Results with confidence levels |
| 📢 VOICE | So what — and now what? | Recommendations, audience-specific messages |
| 🌱 EVOLVE | What would change the conclusion? | Follow-up analyses, impact tracking |
You never skip a stage without a deliberate choice. The loop enforces analytical discipline — even when you're in a hurry.
Three Modes
Full Mode — for decisions that matter
Five separate files, one per stage. ~40-item checklists. All specialist agents available. Use this when the decision is high-stakes, when you'll need to explain your reasoning, or when you want the full audit trail.
analyses/active/F-2026-0303-001_checkout-drop/
├── 01_ask.md
├── 02_look.md
├── 03_investigate.md
├── 04_voice.md
└── 05_evolve.md
Quick Mode — for fast turnaround
Everything in one file. Compressed checklist. Same ALIVE structure, just lighter. Use this for exploratory questions, morning standups, or anything you need in under an hour. If it grows in scope, /analysis-promote converts it to Full automatically.
analyses/active/quick_Q-2026-0308-001_dau-check.md
Learn Mode — for building the skill
Guided scenarios with rubric-based scoring, progressive hints, and common-mistake detection. Seven real-world scenarios across two levels. Use this onboard new analysts, practice unfamiliar analysis types, or train interns.
analyses/active/L-2026-0220-002_signup-drop-scenario/
All Commands
Core workflow
| Command | What it does |
|---|---|
/analysis-init |
One-time setup: language, team name, data stack, key metrics |
/analysis-new |
Start a new analysis — choose Full or Quick, set the question |
/analysis-next |
Move to the next ALIVE stage with quality gate check |
/analysis-status |
Show current stage, checklist progress, open questions |
/analysis-archive |
Mark complete, move to analyses/archive/ |
/analysis-list |
Browse all analyses with filters (type, stage, analyst, tags) |
/analysis-promote |
Upgrade a Quick analysis to Full when scope expands |
Finding and reviewing past work
| Command | What it does |
|---|---|
/analysis-search |
Full-text search across all analyses — titles, findings, hypotheses |
/analysis-retro |
Generate a retrospective report for a period (--last-month, --last-quarter, --all) |
/analysis-dashboard |
Export analyses to JSON → load into the visual team dashboard |
/analysis-dr |
Manage Decision Records — the team's methodology decision log |
/analysis-wiki |
Maintain the Analysis Wiki — AI-compiled knowledge base from all analyses |
Specialist agents
| Command | What it does |
|---|---|
/analysis-agent |
Show which specialist agents are recommended for the current stage |
/analysis-agent {number} |
Run a specific agent directly |
/analysis-agent "{alias}" |
Run by alias (e.g. "stats", "causal", "ethics") |
Experiments and monitoring
| Command | What it does |
|---|---|
/analysis-new (Experiment type) |
Start an A/B test analysis — adapted ALIVE loop with pre-registration |
/monitor-setup |
Configure metric monitoring with alert thresholds |
/analysis-new --from-alert {alert-id} |
Escalate a metric alert directly into a new analysis |
Education mode
| Command | What it does |
|---|---|
/analysis-learn |
Start a learning scenario — choose level and scenario |
/analysis-learn-next |
Get feedback on your current stage and advance |
/analysis-learn-hint |
Request a hint (three levels: direction → specific → near-answer) |
/analysis-learn-review |
Complete the scenario with a scored review and skill radar |
31 Specialist Agents
At each ALIVE stage, a routing engine reads your analysis context and recommends the right specialists from a pool of 31 agents. You choose which ones to run.
Required gates (auto-run, no confirmation needed)
These four run automatically when their trigger condition is met:
| Agent | When it runs |
|---|---|
| scope-guard | Detects multi-question mixing or scope expansion — offers 3 options to contain it |
| data-quality-sentinel | Checks data completeness before you leave LOOK |
| ethics-guard | Flags PII exposure, survivorship bias, fairness issues |
| reproducibility-keeper | Verifies steps are documented enough to replay |
Optional specialists by stage
ASK — problem-framer, hypothesis-gen, metric-translator, sampling-designer
LOOK — data-scout, tracking-auditor, lineage-mapper, sql-writer
INVESTIGATE — eda-agent, stats-agent, experiment-designer, causal-agent, root-cause-analyst, ml-agent, forecast-agent, anomaly-detector, chart-recommender, dashboard-designer, peer-reviewer
VOICE — narrative-agent, exec-summarizer, decision-memo-writer
EVOLVE — metric-definer, semantic-layer-engineer, governance-steward
The routing engine scores each agent against your current context (analysis type, domain, data signals) and presents the top 3 with a plain-language explanation: "This analysis involves a before/after metric change with no randomization — the causal-agent can assess whether DID or RDD is appropriate here."
Agents can be disabled per-project in .analysis/agents.yml.
Experiment Support (A/B Testing)
When you run /analysis-new and choose Experiment type, the ALIVE loop adapts:
DESIGN → VALIDATE → ANALYZE → DECIDE → LEARN
Key enforcements:
- Pre-registration lock: Analysis plan is written and locked before results are revealed — prevents post-hoc rationalization
- SRM detection: Sample Ratio Mismatch flagged automatically during VALIDATE
- Guardrail metrics: Counter-metrics defined alongside primary metric to catch unintended side effects
- Multiple comparison correction: Alerts when running many variants without adjustment
- Statistical validity: The stats-agent verifies power, sample size, and test selection before you call significance
Metric Monitoring
/monitor-setup
Configure thresholds for your key metrics. When an alert fires, escalate it directly into an analysis:
/analysis-new --from-alert {alert-id}
The ALIVE context pre-fills with the alert data — metric name, value, time window, relevant segments. You start at ASK with context already loaded.
Analysis Search and Retrospective
Search across all past analyses
/analysis-search "checkout funnel"
Full-text search across titles, hypotheses, findings, and follow-ups. Returns matching analyses with surrounding context, cross-references to related analyses, and suggestions for follow-up work.
Automatic retrospective
/analysis-retro --last-quarter
Aggregates all analyses in a period into a structured report:
- Activity summary (analyses by type, analyst, stage completion)
- Impact tracking (recommendations → decisions → outcomes)
- Recurring patterns and unresolved follow-ups
- Team-level metrics (acceptance rate, decision speed, analysis accuracy over time)
Output: analyses/.retro/retro_{period}.md
Analysis Memory System (v1.4)
Two features that give your team persistent analytical memory — so knowledge compounds instead of disappearing into chat history.
Decision Records — /analysis-dr
An append-only log of methodology decisions, adapted from the software engineering concept of Architecture Decision Records (ADR).
The problem it solves: Claude keeps suggesting "what if we try Bayesian A/B testing?" even though your team decided that two months ago. Or a new analyst uses a different DAU definition than everyone else. Decision Records prevent this by giving AI a permanent record of what's already been decided — and why.
Five decision types:
| Type | What it captures |
|---|---|
| Metric | How a metric is defined ("DAU = core feature usage, not app launch") |
| Methodology | Statistical method choices ("A/B tests: Bayesian, 95% credibility") |
| Scope | Segment or time window standards ("new user = first 7 days, D0 inclusive") |
| Model | Algorithm selection and why alternatives were rejected |
| Principle | Analytical standards ("causal claims require DiD/RD/IV") |
Append-only: Decisions are never edited or deleted. If reversed, the old DR is marked Superseded by DR-NNN — so future analysts understand why the team thought differently at that time.
/analysis-dr new        # Write a new decision record
/analysis-dr scan       # Find DR candidates from existing analyses
/analysis-dr list       # Show all recorded decisions
/analysis-dr show 003   # Show DR-003 in detail
DRs integrate with the agent system — 6 methodology-suggesting agents (hypothesis-gen, stats-agent, metric-definer, metric-translator, experiment-designer, causal-agent) check decision records before suggesting alternatives. No more debating the same methodology question twice.
Analysis Wiki — /analysis-wiki
A structured, AI-maintained knowledge base compiled from your team's analyses. Based on Andrej Karpathy's LLM Wiki concept: instead of searching raw files every time, AI pre-compiles knowledge into structured pages that grow as analyses accumulate.
How it works: After archiving analyses, run /analysis-wiki update. AI reads every archived analysis and builds structured pages:
analyses/wiki/metrics/dau.md— everything learned about DAU across all analyses: key findings, validated/rejected hypotheses, watch pointsanalyses/wiki/patterns/simpson-paradox.md— recurring patterns with context on when and how they appearedanalyses/wiki/hypotheses/INDEX.md— cross-analysis hypothesis results (prevents re-testing what's already answered)
Health checking: /analysis-wiki check finds contradictions (same hypothesis validated in one analysis, rejected in another), stale pages, and orphan claims without source links.
/analysis-wiki update       # Scan archives → build/update all wiki pages
/analysis-wiki check        # Find contradictions, stale content, gaps
/analysis-wiki show dau     # Display the DAU knowledge page
How it's different from other features:
| Feature | Use when |
|---|---|
/analysis-search |
Find a specific past analysis |
/analysis-retro |
Summarize what happened in a time period |
| Dashboard | Explore analysis relationships visually |
/analysis-wiki |
Know everything your team has learned about a metric or pattern |
DR + Wiki together: DR answers "How did we decide to measure this?" Wiki answers "What have we learned from measuring it?"
Getting started:
- Run
/analysis-init— createsanalyses/decisions/andanalyses/wiki/with seeded INDEX files - Run a few analyses and archive them
- Run
/analysis-dr scan— AI scans archived analyses and proposes methodology decisions to record - Run
/analysis-wiki updateafter 3+ archives — AI compiles metric/pattern/hypothesis pages - Run
/analysis-wiki checkperiodically to catch contradictions and stale knowledge
Note on Quick analyses: Wiki pages are primarily built from Full analyses (5-stage files). Quick analyses (single-file) contribute less to the wiki since they don't have separate stage files.
Team Dashboard
Visualize your entire analysis history as an interactive node graph.
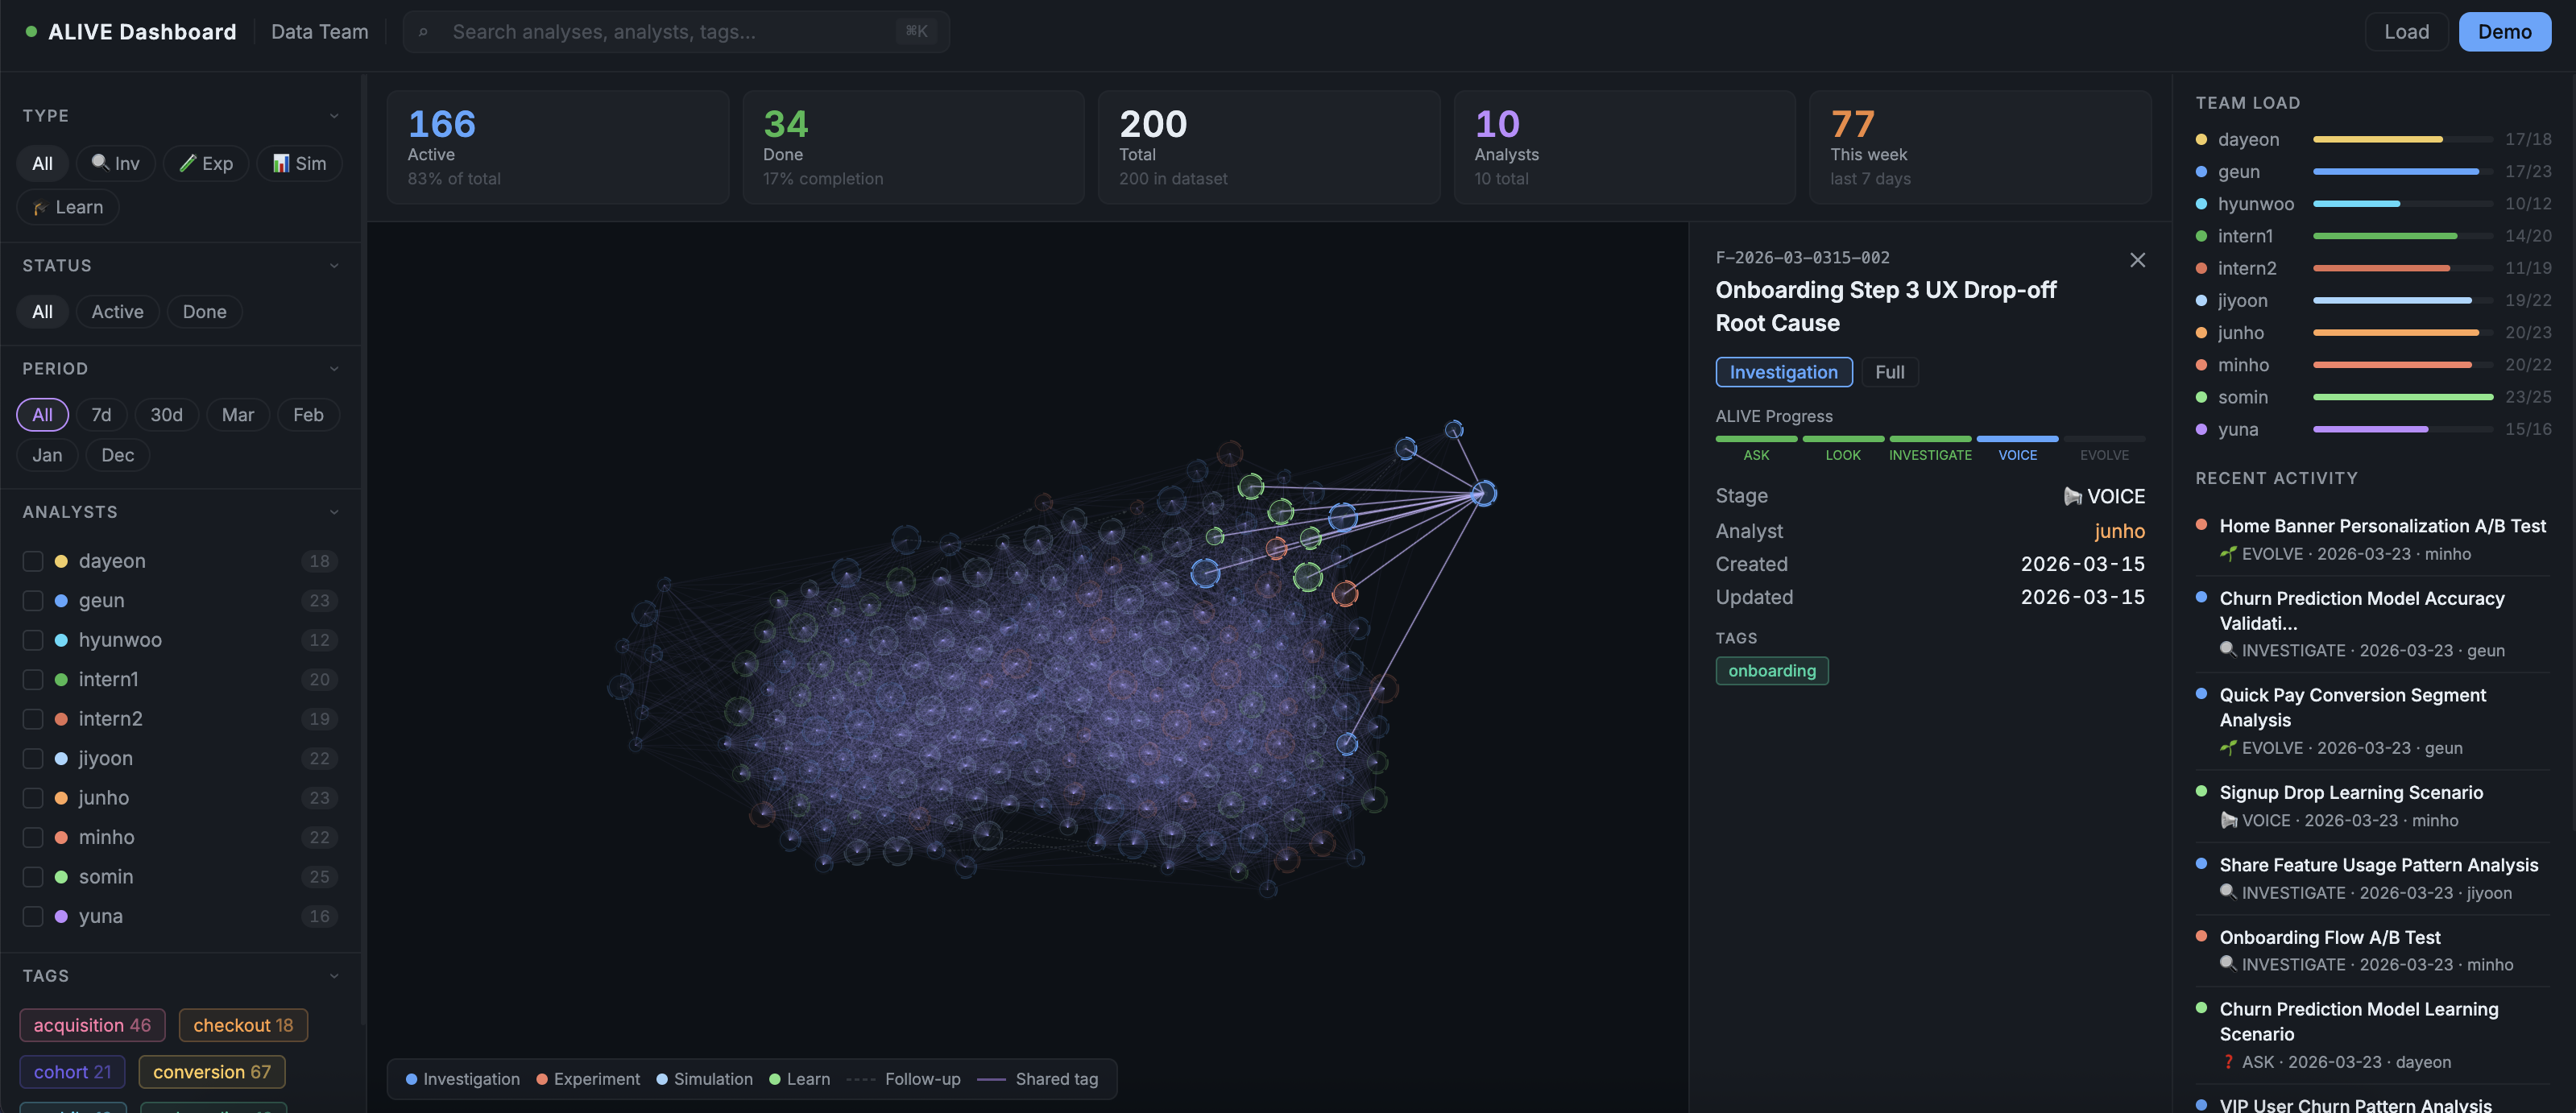
What the graph shows:
- Each node = one analysis
- Node size = ALIVE stage progress (small = just started, large = complete)
- Node color = analysis type (Investigation / Experiment / Simulation / Learn)
- Arc ring = which stages are done
- Dashed edges = follow-up connections between analyses
- Solid edges = analyses sharing the same tags
- Click a node → connected analyses stay highlighted, everything else fades
Filters: analyst, tags, type, status, date range. ⌘K to search.
Setup:
# Export your analyses to JSON
bash dashboard/export.sh > export.json

# Open in any browser — no server needed
open dashboard/alive-dashboard.html
# Click Load → paste the JSON
Add metadata per analysis to enrich the graph:
# analyses/active/F-2026-0303-001_checkout-drop/meta.yml
analyst: geun
tags: [checkout, conversion]
followups: [F-2026-0305-001]
keyFinding: "2.4pp drop confirmed. Mobile UX root cause."
MCP Server — Let Claude Query Your Analyses
Install the MCP server and Claude can access your full analysis history directly — in any MCP-compatible client.
npm install -g alive-analysis-mcp
Claude Desktop (~/Library/Application\ Support/Claude/claude_desktop_config.json):
{
  "mcpServers": {
    "alive-analysis": {
      "command": "alive-analysis-mcp",
      "args": ["--analyses-dir", "/path/to/your/analyses"]
    }
  }
}
Claude Code (.claude/mcp.json in your project):
{
  "alive-analysis": {
    "command": "alive-analysis-mcp",
    "env": { "ALIVE_ANALYSES_DIR": "./analyses" }
  }
}
What Claude can do with MCP connected
| Tool | Example prompt |
|---|---|
alive_list |
"List all experiments from last quarter" |
alive_get |
"Show me the full findings from F-2026-0303-001" |
alive_search |
"Find any analysis that mentions SRM or sample ratio" |
alive_dashboard_export |
"Give me the JSON to load into the dashboard" |
With MCP active, Claude remembers your team's analysis history across sessions. New team members can ask "What did we learn about checkout drop?" and get a full briefing — without anyone digging through files.
MCP Registry: io.github.with-geun/alive-analysis
Works with Claude Desktop, Claude Code, Cursor, Zed, Windsurf, and any other MCP-compatible client.
Education Mode — Learn Product Analysis
Seven real-world scenarios with guided feedback. Designed to build analytical thinking, not just teach tool mechanics.
Beginner scenarios (20–30 min, Quick format)
| Scenario | Question | Skills practiced |
|---|---|---|
| b1-signup-drop | "Why did signups drop yesterday?" | Platform-specific root cause, data triangulation |
| b2-onboarding-comparison | "Which onboarding flow is better?" | Simpson's Paradox, SRM validation, counter-metrics |
| b3-turnover-cost | "How much does turnover cost us?" | Quantification, multi-component estimation |
Intermediate scenarios (45–60 min, Full format)
| Scenario | Question | Skills practiced |
|---|---|---|
| i1-dau-drop | "Why did DAU drop 15%?" | Multi-lens analysis, hypothesis elimination, confidence scoring |
| i2-delivery-fee | "Should we lower delivery fees?" | Policy simulation, sensitivity analysis, uncertainty communication |
| i3-ab-test-checkout | "Did the new checkout improve conversion?" | Experiment validity, SRM detection, guardrail metrics |
| i4-churn-prediction | "Can we predict which users will churn?" | ML pipeline, feature selection, model card, drift monitoring |
How feedback works
At each stage, Claude evaluates your work against a rubric and gives you specific feedback — not generic praise. Stuck? Three progressive hint levels: direction → specific → near-answer. Made a common mistake? It gets flagged with an explanation of why it matters.
Graduation path: two Beginner scenarios at 70%+ → unlock Intermediate → 75%+ on Intermediate → production-ready.
/analysis-learn              # Pick a scenario
/analysis-learn-hint         # Get a hint without giving away the answer
/analysis-learn-review       # See your score and skill radar
Situational Protocols
Built into the workflow for situations that derail most analyses:
Scope creep guard — When a second question appears inside an analysis, the agent detects it and offers three options: park it as a follow-up, swap the primary question, or explicitly expand scope with documented trade-offs.
Rabbit hole guard — After three rounds on a sub-question, checks whether it's still actionable. If not, surfaces a decision point.
Data quality emergency — Five response options: patch with available data, scope down, pause until data is ready, report with explicit caveats, or reframe the question entirely.
Analysis independence — Built-in safeguards against pressure to reach predetermined conclusions. If the prompt pattern looks like conclusion-first reasoning, it gets flagged.
Obsidian Integration
Your analyses/ folder works as an Obsidian vault out of the box.
Use [[F-2026-0305-001]] wiki-links in your markdown — Obsidian's graph view picks them up and draws the same connections the team dashboard shows. Useful for teams that prefer Obsidian for knowledge management alongside the code workflow.
File Structure
your-project/
├── analyses/
│   ├── active/
│   │   ├── F-2026-0303-001_checkout-drop/    # Full analysis
│   │   │   ├── 01_ask.md
│   │   │   ├── 02_look.md
│   │   │   ├── 03_investigate.md
│   │   │   ├── 04_voice.md
│   │   │   ├── 05_evolve.md
│   │   │   ├── meta.yml
│   │   │   └── assets/
│   │   │       └── queries/
│   │   └── quick_Q-2026-0308-001_dau-check.md  # Quick analysis
│   ├── archive/                               # Completed analyses
│   ├── decisions/                             # Analysis Decision Records
│   │   ├── INDEX.md                           # DR index (auto-updated)
│   │   └── DR-NNN.md                          # Individual decision files
│   └── wiki/                                  # AI-maintained knowledge base
│       ├── INDEX.md
│       ├── metrics/                           # One page per metric
│       ├── patterns/                          # Recurring analytical patterns
│       └── hypotheses/                        # Cross-analysis hypothesis results
├── .analysis/
│   ├── config.md          # Team settings (language, data stack, metrics)
│   ├── agents.yml         # Enable/disable individual agents
│   ├── checklists/        # Stage checklists — edit to customize
│   ├── status.md          # Current analysis state
│   ├── agent-state.md     # Agent suppression history
│   ├── models/            # ML model registry
│   ├── metrics/           # Metric definitions and monitors
│   └── decisions/         # Per-analysis business decision memos (VOICE stage output, not DR records)
Analysis IDs by type:
F-YYYY-MMDD-NNN— Investigation or Modeling (Full)Q-YYYY-MMDD-NNN— Quick checkE-YYYY-MMDD-NNN— Experiment / A/B testS-YYYY-MMDD-NNN— SimulationL-YYYY-MMDD-NNN— Learn scenario
Platform Support
| Feature | Claude Code | Cursor 2.4+ |
|---|---|---|
| Full ALIVE loop | ✅ | ✅ |
| All 25+ commands | ✅ | ✅ (batch interaction) |
| 31 specialist agents | ✅ | ✅ |
| Education mode | ✅ | ✅ |
| MCP server | ✅ | ✅ |
| Team dashboard | ✅ | ✅ |
| Decision Records (DR) | ✅ | ✅ |
| Analysis Wiki | ✅ | ✅ |
Cursor uses a batch interaction model — all required inputs presented at once rather than sequentially, optimized for Cursor's agent loop behavior.
What it's not
Not a BI tool. The team dashboard visualizes your analysis history, not your business metrics. alive-analysis structures your thinking, not your reporting.
Not a data pipeline. It doesn't connect to databases or run queries automatically. It helps you think through what queries to run and why.
Not opinionated about your data stack. Works with any combination of SQL, Python, R, notebooks, or spreadsheets. The methodology is tool-agnostic.
Changelog highlights
| Version | What shipped |
|---|---|
| v1.4.0 | Analysis Memory System — Decision Records (DR) + Analysis Wiki (LLM Wiki concept) |
| v1.3.0 | Team Dashboard (interactive node graph), MCP server (alive-analysis-mcp on npm + MCP Registry) |
| v1.2.0 | 31 specialist agents — registry, router, 31 dedicated prompts, Cursor full agent table |
| v1.1.0 | Education mode — 7 scenarios, Common Mistakes feedback, 4 commands × 2 platforms |
| v1.0.0 | Analysis search, automatic retrospective, unified README |
| v0.3.0 | A/B testing module, metric monitoring, Quick→Full promotion, platforms split (Claude Code / Cursor) |
Full changelog: CHANGELOG.md
Contributing
Issues and PRs welcome. See CONTRIBUTING.md.
License
MIT — with-geun
Yorumlar (0)
Yorum birakmak icin giris yap.
Yorum birakSonuc bulunamadi