drawlib
Health Gecti
- License — License: Apache-2.0
- Description — Repository has a description
- Active repo — Last push 0 days ago
- Community trust — 12 GitHub stars
Code Gecti
- Code scan — Scanned 12 files during light audit, no dangerous patterns found
Permissions Gecti
- Permissions — No dangerous permissions requested
Bu listing icin henuz AI raporu yok.
Python library for Illustration & Docs as Code for AI Agents.
Drawlib
Pure-Python Library for "Illustration as Code" & "Illustrated Documentation as Code"
Drawlib is a declarative Python drawing library and integrated multi-format documentation compiler engineered for software developers and autonomous AI coding agents. Instead of maintaining brittle diagrams in external GUI tools (draw.io, Visio, PowerPoint) and manually pasting exported screenshots into wikis, Drawlib lets you author, animate, localize, version-control, and compile architectural diagrams, quantitative charts, technical documents, and 16:9 slide decks entirely from code in Git.

- Official Website & Documentation: English (
www.drawlib.com) | 日本語 (www.drawlib.com/ja/) - Repository Guides & Whitepapers:
Why Drawlib?
1. SmartArt Infographics, Quantitative Charts & Declarative Animations
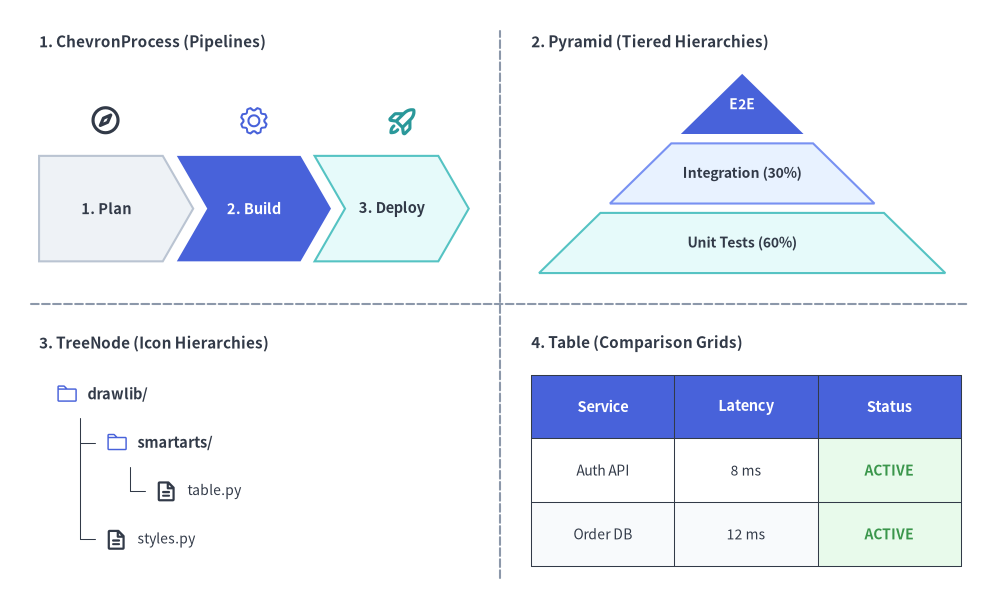
Compose executive-ready infographics (drawlib.smartarts), quantitative data plots (drawlib.charts), and multi-frame APNG / WebP / GIF animations (drawlib.anim) on the exact same coordinate canvas:
- 18 SmartArt Components (
drawlib.smartarts): High-level structured layouts includingChevronProcess,Cycle,Table,TreeNode,MindMapNode,Pyramid,BoxList,CardList,KpiCards,Roadmap,Panel,BulletPoints,GridLayout, syntax-highlightedSourceCode, offline vector maps (GeoMap), andMonthCalendar/WeekCalendar/DayCalendar.
- 9 Quantitative Charts (
drawlib.charts): Pure-PythonBarChart,LineChart,AreaChart,PieChart,RadarChart,ScatterChart,GanttChart, andHeatmapChart/HeatmapOverlaystyled with the same design tokens as surrounding diagrams—no low-level Matplotlib boilerplate required. - Declarative Animations (
drawlib.anim): Turn any diagram, chart, or workflow into a crisp multi-frame APNG, WebP, or GIF animation (Animation(fps=..., loop=0)) that plays natively inside GitHubREADME.mdfiles, pull requests, and HTML documentation sites.
2. Auto-Layout Graphs & Software Engineering Diagrams
Stop hand-tuning complex node coordinates. Combine automatic graph layout solvers (drawlib.graph) with domain-specific software engineering diagrams (drawlib.diagrams):
- 5 Auto-Layout Coordinate Solvers (
drawlib.graph): Pure coordinate calculators (ArchitectureGraph,LayerGraph,TreeGraph,RadialGraph,GridGraph) that compute overlap-free node centers (.xy), nested cluster bounds, andoffset()fine-tuning viaget_layout()for seamless rendering withdrawlib.diagramsanddrawlib.shapes.
- 6 Technical Diagram Engines (
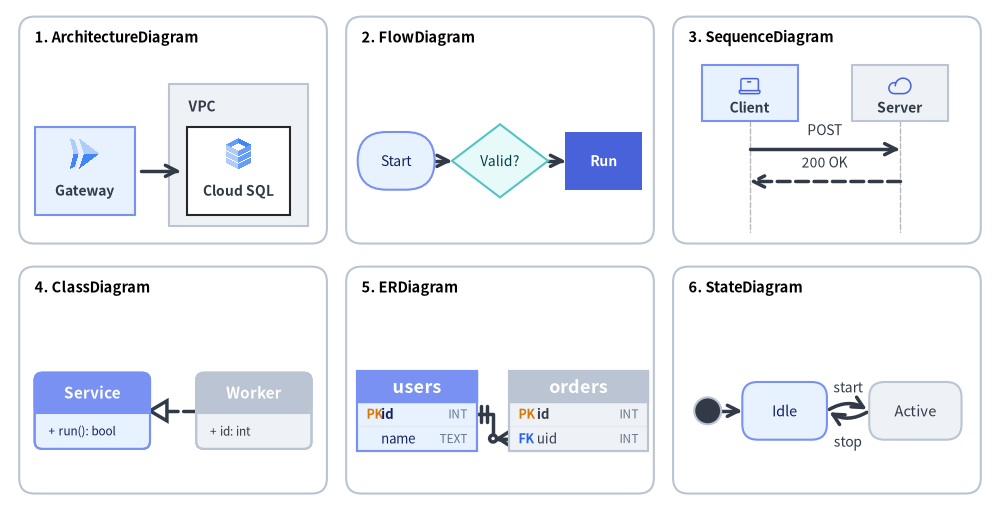
drawlib.diagrams):- Cloud Architecture (
ArchitectureDiagram): Nested VPC/subnet boundaries, multi-tier service cards, and official cloud provider icons. - Flowcharts (
FlowDiagram): Process steps, decision branches, and orthogonal connectors. - Sequence Diagrams (
SequenceDiagram): Client/server lifelines, synchronous/asynchronous calls, activation bars, and loop/alt frames. - State, UML Class & ER Diagrams (
StateDiagram,ClassDiagram,ERDiagram): State lifecycles, object-oriented class hierarchies, and relational database schemas.
- Cloud Architecture (
3. 34 Icon Suites (4,500+ Icons), 43 Primitives & Semantic Design System
At its core, Drawlib cleanly separates Content (geometry, coordinates, structure) from Style (colors, typography, borders, themes)—just like HTML and CSS:
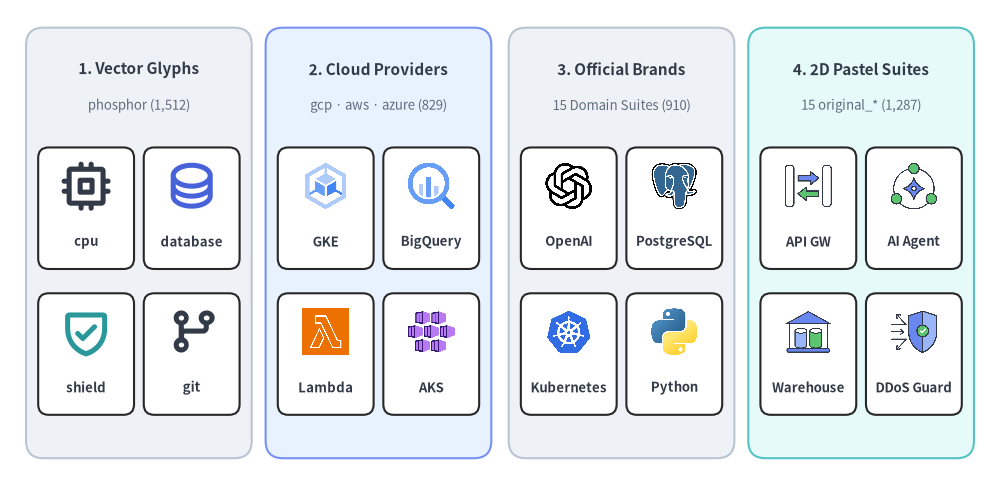
- 34 Standardized Icon Suites (
drawlib.icons): Over 4,500 offline-cached vector icons spanning Phosphor (1,512icons across5weights), Cloud Providers (gcp,aws,azure), 15 Official Tech Brand Suites (ai,cicd,cloud,code,compute,container,data,database,k8s,linux,mobile,monitoring,network,security,workspace), and 15 Flat 2D Suites (original_*). - Rich Primitives (
drawlib.shapes,lines,images,text,fonts):- 43 Geometric Shapes: Spanning
basic,polygon,arrow,badge,container, andsymbolprimitives. - Lines & Connectors: Straight, curved (
bend), quadratic/cubic Bezier, and rounded polylines with rich arrowheads ("->","<-","<->"). - Images & Nested Canvases: Non-destructive
Dimagetransformations (crop(),sepia(),grayscale(),mosaic(),mirror()) plus in-memory diagram nesting viaget_dimage_from_code(). - Multilingual Typography: Automatic on-demand font caching (
FontRoboto,FontSansSerif,FontSerif,FontSourceCode,FontJapanese,FontChinese,FontKorean,FontArabic, etc.).
- 43 Geometric Shapes: Spanning
- 7-Role Semantic Style System (
drawlib.styles):- 6 built-in themes (
default,google,essentials,monochrome,warm,cold) accessed viaStyles.<Token>(Styles.Neutral,Styles.PrimaryFlat,Styles.SecondaryNeutral,Styles.MutedDashed,Styles.SuccessNeutral,Styles.WarningNeutral,Styles.DangerNeutral).
- 6 built-in themes (
4. Illustrated Documentation & 16:9 Slide Deck as Code (Multi-Locale Ready)
Author Markdown files with embedded ```drawlib code fences inside a unified drawlib.toml project. A single build compiles your repository into web portals, GitHub Markdown, PDFs, editable Word documents, HTML slide decks, and PowerPoint files:
- Unified
drawlib.toml& Multi-Locale (<lang>/) Architecture: Configure project metadata,[build]flags, and[i18n]locales (langs = ["en", "ja"]) indrawlib.tomlwith built-in structural parity checks across<src_dir>/<lang>/trees and locale-suffixed deliverables (*_<lang>.pdf,*_<lang>.docx,*_<lang>.pptx). - 4 Project Scaffolds (
drawlib init <type>):drawlib init site [-l en,ja]: Multi-page documentation website (docs_html/with language switcher, search, and sidebar TOC) and GitHub Markdown (docs_markdown/).drawlib init doc [-l en,ja]: Linear technical specification or whitepaper (*_html/,*_markdown/, vector*_<lang>.pdf, plus editable MS Word*_<lang>.docxviadrawlib build docx).drawlib init slide [-l en,ja]: 16:9 presentation slide deck (::: block+::: notespeaker notes) with native SVG typography, Presenter View, keyboard navigation (slide_html/), vectorslide_<lang>.pdf, and editable MS PowerPointslide_<lang>.pptxviadrawlib build pptx.drawlib init images: Standalone batch Python illustration scripts (images_src/->images/) backed by sub-millisecond.drawlib/cache.dbincremental caching.
- AI Inner Loop & Human Outer Loop: Built from the ground up for AI coding agents (Claude Code, Cursor, Gemini, Codex). Agents query
drawlib rules show <topic>on demand, render headless coordinate-grid previews viadrawlib show -g, and multimodally self-correct text clipping or layout defects—freeing engineers to focus on high-level architecture and review.
Installation
Install drawlib from PyPI using pip or uv (Python >= 3.11):
pip install drawlib
# or: uv add drawlib
PDF, MS Word (.docx), and MS PowerPoint (.pptx) export work out of the box—playwright, python-docx, and python-pptx are standard dependencies, and headless Chromium (chromium-headless-shell) downloads automatically on your first drawlib build pdf or drawlib build pptx run.
- Offline / Air-Gapped / CI Environments: Pre-download all fonts, icons, maps, and headless Chromium ahead of time with
drawlib cache download --all(or Chromium only withdrawlib cache download --browser). - Minimal Linux Containers (e.g.,
python:3.12-slimlacking OS shared libraries such aslibnss3orlibgbm1): Install OS browser dependencies once viaplaywright install-deps chromium(orplaywright install --with-deps --only-shell chromium).
Verify the installation:
drawlib --version
Quick Start
1. Standalone Python Script (5-Step Drawing Workflow)
Every Drawlib script follows a clean 5-step pattern: Import -> Setup Canvas -> Draw Zones (Optional) -> Shapes & Lines -> Save:
Create client_server.py:
from drawlib.canvas import save, setup
from drawlib.lines import line
from drawlib.shapes import circle, rectangle
from drawlib.styles import Styles
from drawlib.text import text

setup(width=100, height=44)
# Optional: boundary zone
rectangle((50, 22), 92, 36, style=Styles.MutedDashed)
circle((25, 22), 12,
       style=Styles.Neutral, text="Client")
rectangle((75, 22), 26, 20,
          style=Styles.PrimaryFlat, text="Server")
line((37, 22), (62, 22),
     arrow_head="->", style=Styles.DarkBold)
text((49.5, 27), "REST API", style=Styles.DarkBold)
save()
Run the script with Python to generate client_server.png:
python client_server.py
Core Principles at a Glance
- Bottom-Left Origin
(0, 0):setup(width=100, height=44)defines a Cartesian coordinate canvas wherexspans0..100(left to right) andyspans0..44(bottom to top). - Predictable Coordinate Anchors: Core primitives (
rectangle,circle,icon,image,text) anchor at their center(cx, cy)for effortless alignment, while high-levelChartsandDiagramsanchor at bottom-left(x0, y0). - 50%+ Neutral Baseline: Ground supporting shapes in calm neutral tokens (
Styles.Neutral,Styles.SecondaryNeutral,Styles.MutedDashed) and reserve saturated fills (Styles.PrimaryFlat) for 1–2 focal elements. - Non-Destructive Style Patching (
.patch()): Customize any preset token cleanly viaStyles.MutedBold.patch(text_size=10)orStyles.Primary.patch(shape_line_width=2).
2. Illustrated Documentation & Slide Deck Workflow
Scaffold a multi-page documentation site, linear whitepaper, or 16:9 slide deck in seconds (pass -l en,ja for multi-locale <src_dir>/<lang>/ projects):
# Initialize a bilingual multi-page documentation site in docs_src/ (en/ & ja/)
drawlib init site -l en,ja

# Or initialize a 16:9 presentation slide deck in slide_src/
drawlib init slide -l en,ja
Inside your Markdown files (docs_src/en/index.md), embed Python drawing blocks using the ```drawlib fence:
# System Architecture

Below is our core request routing pipeline:

```drawlib code=fold align=center file=service_routing.png caption="Service Routing Pipeline"
from drawlib.canvas import save, setup
from drawlib.lines import line
from drawlib.shapes import rectangle
from drawlib.styles import Styles

setup(width=100, height=40)
rectangle((25, 20), width=30, height=16, r=2, style=Styles.Neutral, text="Ingress")
rectangle((75, 20), width=30, height=16, r=2, style=Styles.PrimaryFlat, text="Core API", text_style=Styles.WhiteBold)
line((40, 20), (60, 20), arrow_head="->", style=Styles.DarkBold)
save()
```
Compile, export, and preview with the drawlib CLI:
# Build HTML site, GitHub Markdown, or PDF via generated build script
./docs_src/build.sh

# Export editable MS Word (.docx) or MS PowerPoint (.pptx) per locale
drawlib build docx doc_src/ -o spec.docx --generate-index   # -> spec_en.docx, spec_ja.docx
drawlib build pptx slide_src/ -o deck.pptx                  # -> deck_en.pptx, deck_ja.pptx

# Launch local HTTP server with pre-flight broken-link verification
drawlib serve docs_html/ --check

# Render a single diagram with coordinate grid (-g) for visual layout inspection
drawlib show docs_src/en/index.md service_routing.png -g -o preview_grid.png
3. CLI Reference Summary
| Command | Description |
|---|---|
drawlib init <site|doc|slide|images> [-l <langs>] |
Scaffold a documentation site, linear spec, 16:9 slide deck, or image project (drawlib.toml) |
drawlib build <html|markdown|pdf|docx|slide|pptx|image> |
Compile sources into HTML, Markdown, PDF, MS Word (.docx), HTML Slides, MS PowerPoint (.pptx), or PNG/APNG/WebP images |
drawlib serve <html_dir> [--check] |
Start a local HTTP server for built HTML docs/slides with broken-link verification |
drawlib show <file> [target] [-g] |
Render and inspect a single script or embedded Markdown diagram (with optional coordinate grid) |
drawlib rules show [topic] |
On-demand CLI manual for AI coding agents (overview, style-guide, review-guide, api, lib-*) |
drawlib cache <list|download|clear> |
Manage local font, icon, map, and headless Chromium caches (--all, --browser, --images) |
Links & Resources
- Official Documentation: English (
https://www.drawlib.com/) | 日本語 (https://www.drawlib.com/ja/) - PyPI Package: https://pypi.org/project/drawlib/
- GitHub Repository: https://github.com/yuichi110/drawlib
- License: Apache License 2.0
Yorumlar (0)
Yorum birakmak icin giris yap.
Yorum birakSonuc bulunamadi