clawd-insights
Health Pass
- License — License: MIT
- Description — Repository has a description
- Active repo — Last push 0 days ago
- Community trust — 33 GitHub stars
Code Fail
- os.homedir — User home directory access in agents/codex-log-monitor.js
- fs module — File system access in agents/codex-log-monitor.js
- os.homedir — User home directory access in agents/gemini-log-monitor.js
- process.env — Environment variable access in agents/gemini-log-monitor.js
- fs module — File system access in agents/gemini-log-monitor.js
Permissions Pass
- Permissions — No dangerous permissions requested
No AI report is available for this listing yet.
Local-first analytics dashboard + desktop pet for your Claude Code, Codex CLI and Cursor sessions. Timeline view + AI-generated session summaries powered by your own local LLM.
clawd-insights
A local-first analytics dashboard for your AI coding sessions
"Hello Clawd, it's time for your weekly report"
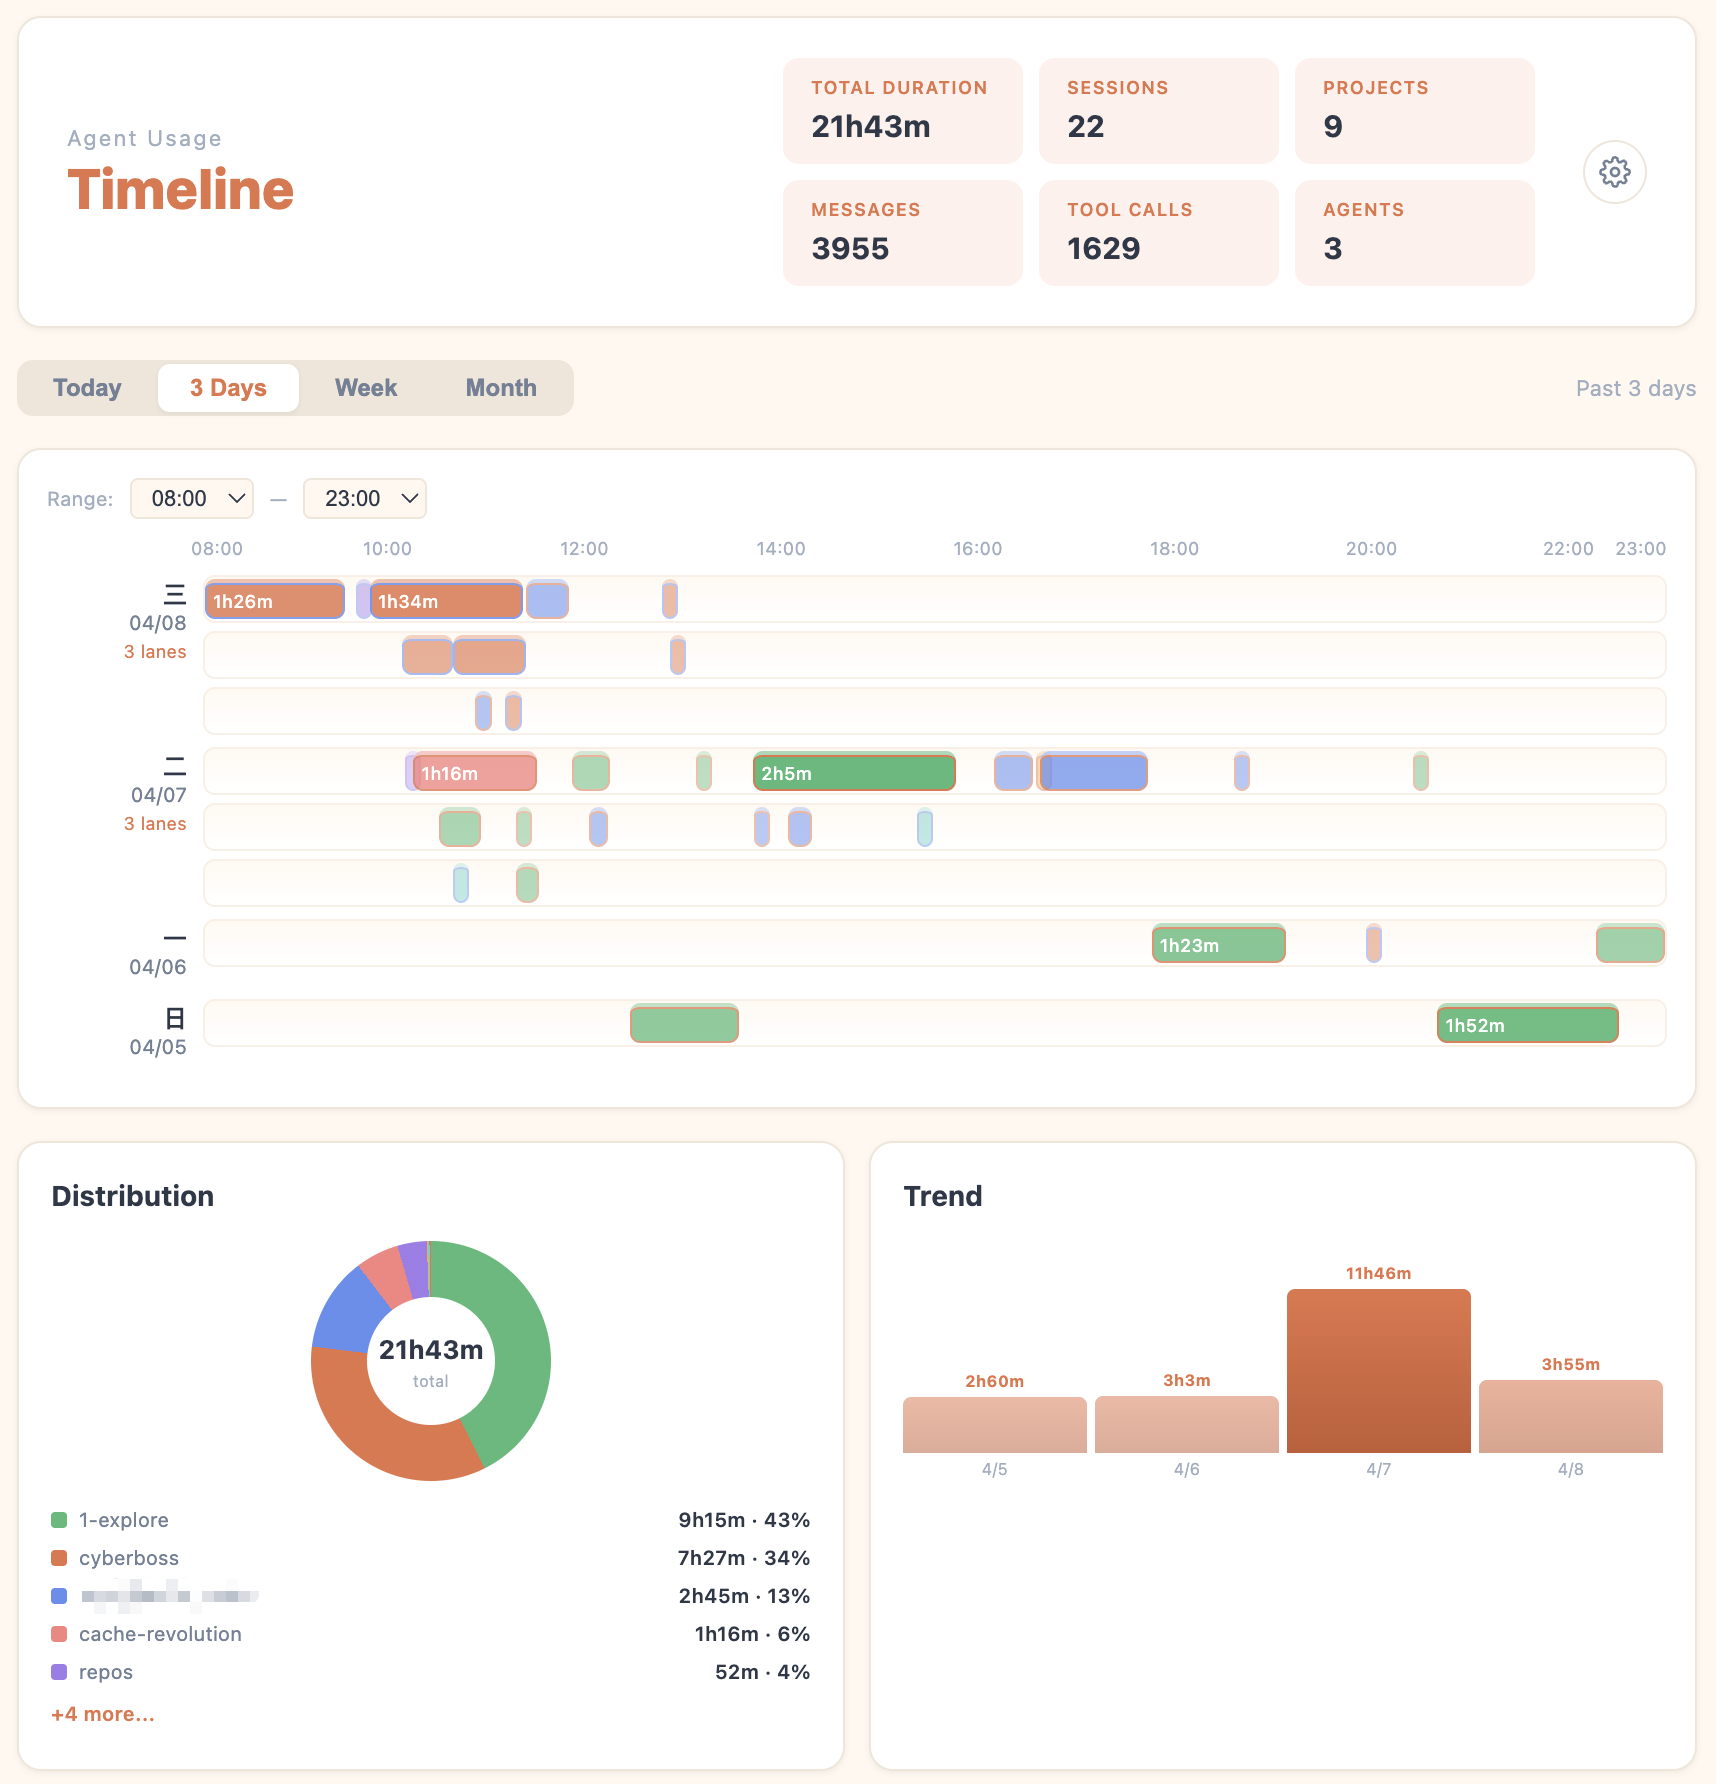
Timeline view — every session, traced |
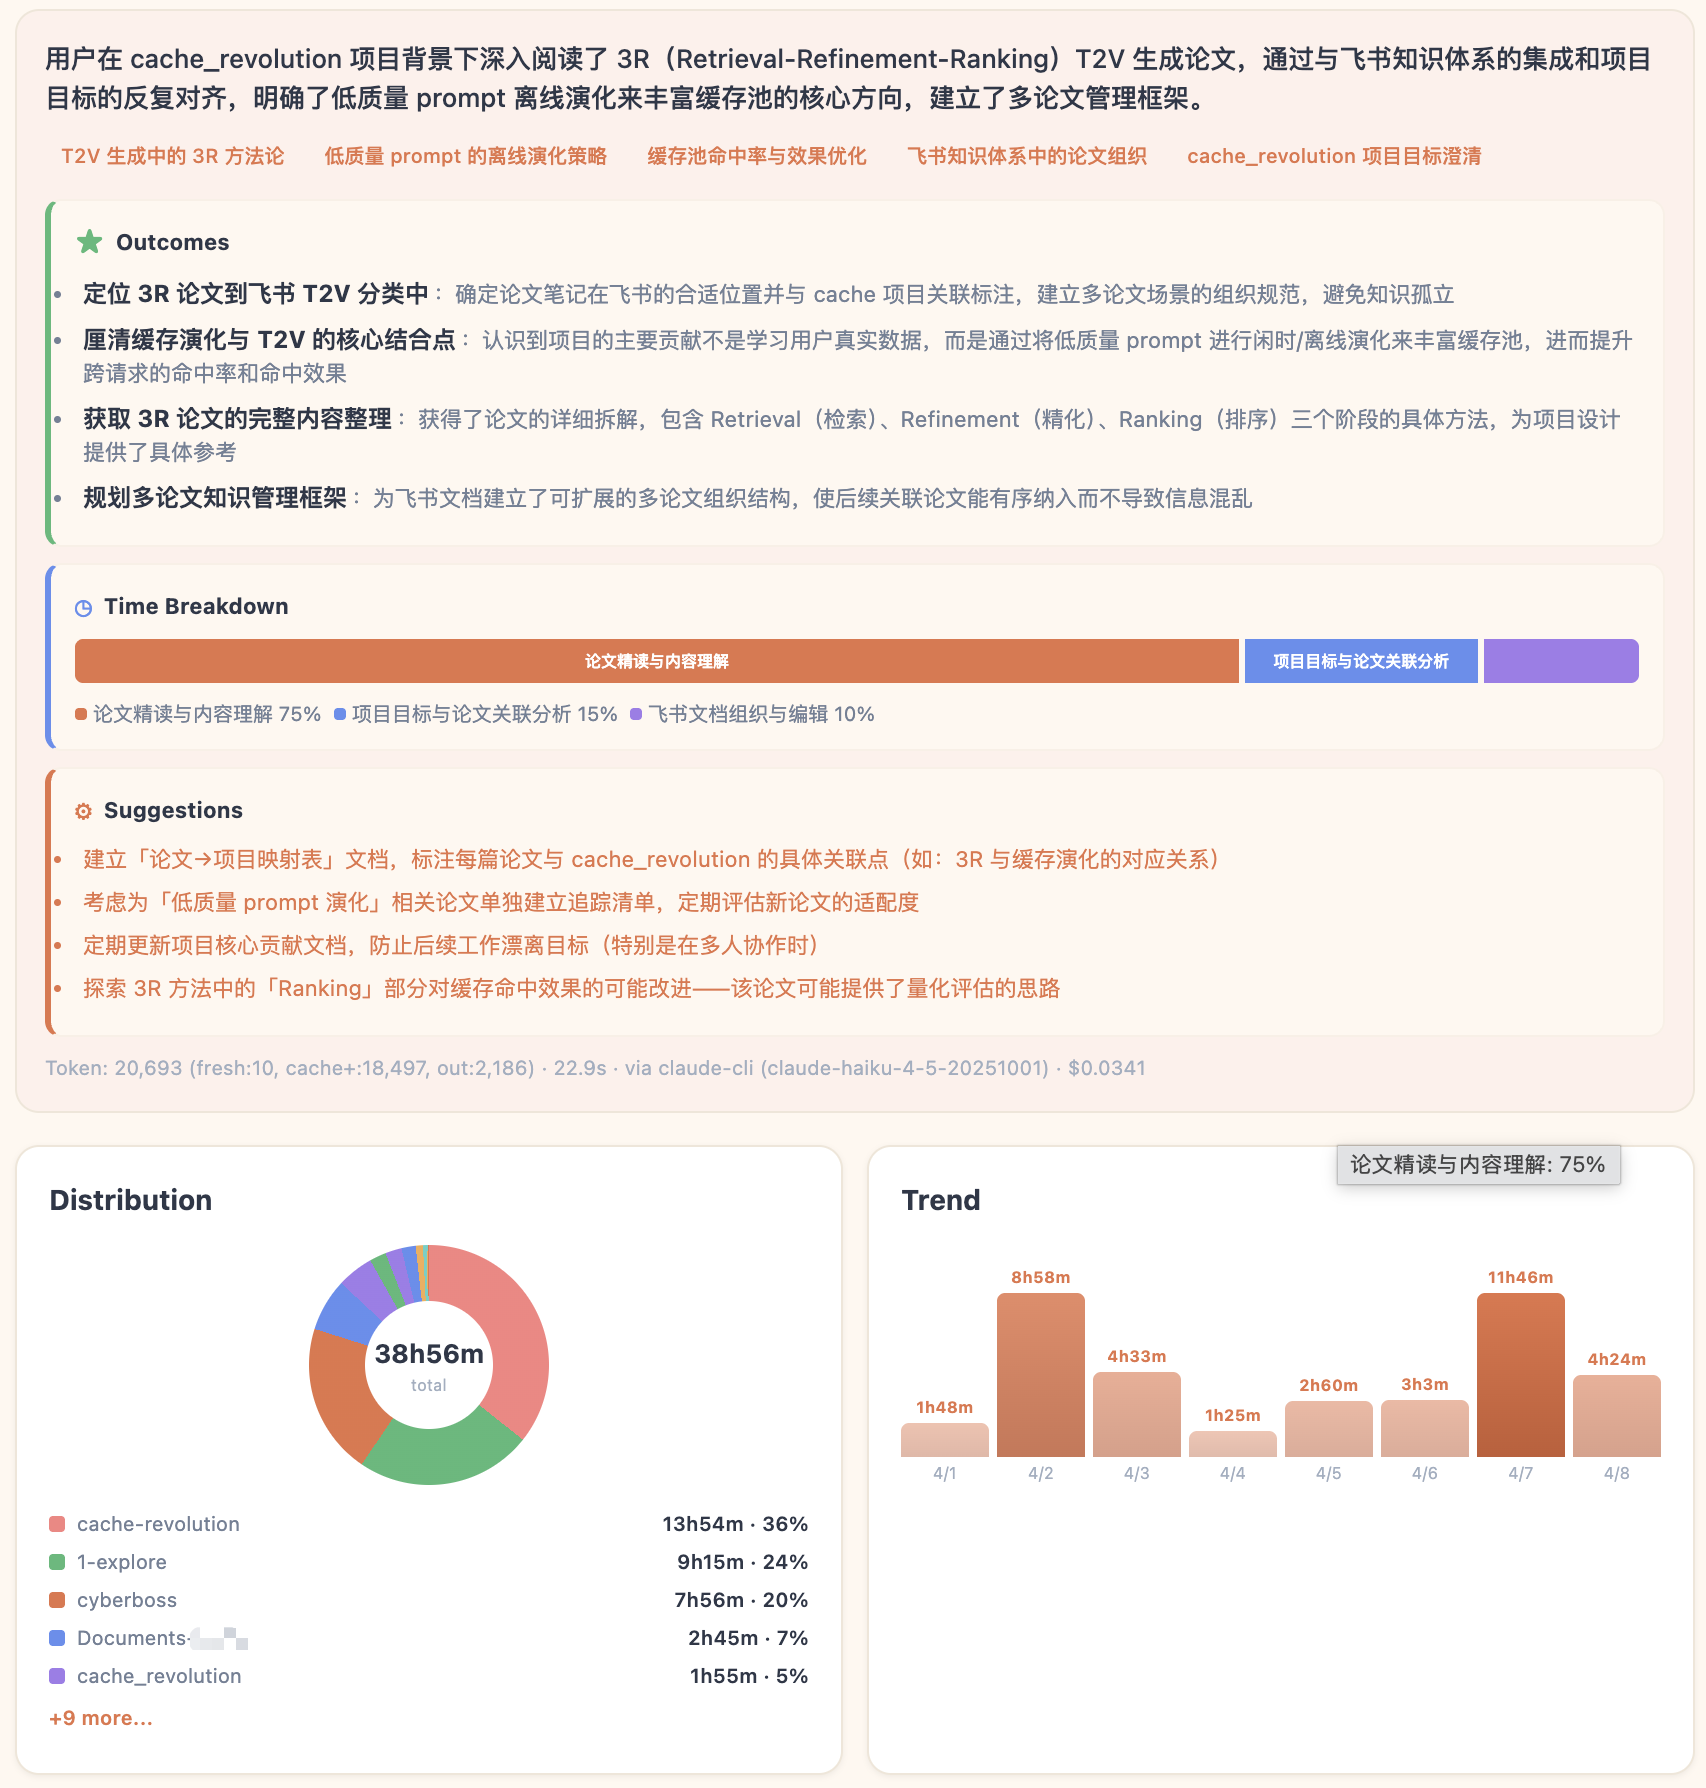
AI session review — what you tried, what you learned |
Clawd Insights automatically scans the conversations you've already had with Claude Code, Codex CLI, Cursor and other agents, and turns them into a timeline plus AI-generated session summaries. No more scrolling through endless chat history — it builds the knowledge cards for you.
Every conversation leaves an imprint. No idea you tried, no bug you wrestled with, no decision you made together with the Agent is ever wasted — they all come back into view in the Analytics Dashboard.
All data stays on your machine. AI analysis runs through your own local claude / codex CLI (or an API / Ollama backend you configure). Your conversations never touch a third party.
Currently focused on macOS. Windows/Linux may work, but they are not the primary supported environments yet. Requires Node.js.
Quick Install
git clone https://github.com/yx0716/clawd-insights.git && cd clawd-insights && npm install && npm start
A small crab appears on your desktop — on macOS, right-click it to open the Analytics Dashboard. For provider setup and analysis workflows, see Getting Started below.
Features
| Capability | What you get |
|---|---|
| Timeline view | Visualize every session by date / project / agent / duration — at a glance, see when you worked, on what, and for how long |
| Local history scan | Reads ~/.claude/projects/, ~/.codex/sessions/, ~/.cursor/projects/ directly. No upload, no telemetry |
| AI session review | Per-session summary from the user's point of view: what you were trying to do, what you walked away with, key topics, time breakdown |
| Flexible backends | Local claude CLI, local codex CLI, or fall back to a configured API provider / Ollama — your choice, your keys. Add any number of custom OpenAI-compatible endpoints (Zhipu AI, DeepSeek, OpenRouter…) for cheap session analysis |
| Batch pre-analysis | Pre-compute summaries for recent sessions and reuse provider-aware cached results |
| Cost tracking | See token usage and cost per analysis run |
| Quick access | Open from the tray menu, the right-click menu on the desktop pet, or a global shortcut |
Usage examples

① Open right-click → Dashboard |
② Pick a provider Local CLI / API / Ollama |
③ Tweak settings gear ⚙ → AI Provider |
④ Run analysis batch or per-session |
Getting Started
1. Install and run
git clone https://github.com/yx0716/clawd-insights.git && cd clawd-insights && npm install && npm start
Once it launches, a small crab (the default theme) appears on your desktop — that's the Clawd pet, and every entry point to the dashboard goes through it.
2. Open the Analytics Dashboard
There are three ways to open it — pick whichever feels natural:
- Right-click the desktop pet → choose Analytics Dashboard from the context menu
- Click the tray icon (menu bar on macOS) → Analytics Dashboard
- Keyboard shortcut: macOS
⌘ + Shift + Option + A
The first time you open it, you'll see your timeline immediately — it just reads the session logs already on your disk. No setup required for that part.
3. Configure an AI Provider for session summaries
The timeline works out of the box. But to make the dashboard automatically generate a recap summary for each session, you need to point it at something that can call a large language model — an AI Provider (the analysis backend). There are three options:
| Provider type | What it is | Setup | Best for |
|---|---|---|---|
| Local CLI (recommended) | Reuses the claude (Claude Code) or codex CLI you already have installed. Uses your existing subscription, no extra API charges. |
Nothing — auto-detected | Anyone already using Claude Code or Codex — zero overhead |
| API key | An API key from Anthropic, OpenAI, or another provider. Pay-per-token. | Paste your key into the dashboard settings | Users without a local CLI who don't mind a small token cost |
| Ollama | A locally-hosted open model server (e.g. Ollama). | Point the dashboard at your Ollama endpoint | Fully offline, never sends data to the cloud |
💡 Strong recommendation: if you already have Claude Code or Codex CLI installed, do nothing — the dashboard auto-detects them and reuses your existing subscription quota. Cheapest and easiest path.
If you don't want to configure a provider right now, click Skip on the startup screen. You can always set it up later in the settings.
4. Where to configure / change the provider later
If you skipped step 3, or you want to switch providers later, you can adjust it via AI Provider Settings at any time:
Open the Analytics Dashboard → click the gear icon ⚙ in the top-right → AI Provider Settings dialog appears.
The dialog has two sections:
- LOCAL CLI DETECTION — shows whether the dashboard found
claudeandcodexon your machine. Green dot = found (with version + path); red dot = missing. If you see green dots, everything is working — proceed to the next step. - API PROVIDER (FALLBACK) — if no local CLI is installed, you can use an API key for AI session analysis (Claude / OpenAI / Ollama / …) — just paste the key and you're set.
- CUSTOM ANALYSIS PROVIDERS — add any number of OpenAI-compatible endpoints (Zhipu AI, DeepSeek, OpenRouter, university APIs, etc.) as dedicated analysis backends. See below.
Tip: if your
claudeorcodexwas installed via NVM, fnm, or Volta, auto-detection may miss it. Runwhich claudeorwhich codexin your terminal and paste the output into the Claude binary path / Codex binary path override field.
Custom Analysis Providers
You can add cheap, dedicated API endpoints specifically for session analysis — keeping your expensive coding models for actual work.
Why this matters: your coding sessions use Claude Code or Codex (subscription or pay-per-token). Session analysis is a much simpler task — a glm-4-flash call costs ~$0.0001 vs ~$0.01 for a Sonnet call. Adding a cheap custom provider lets you analyze hundreds of sessions for pennies.
Adding a custom provider
- Open the Analytics Dashboard → click the gear icon ⚙ → AI Provider Settings
- Scroll to Custom Analysis Providers → click + Add Provider
- Fill in the form:
- Provider Name — a friendly label (e.g.
Zhipu AI GLM-4-Flash) - Type —
OpenAI-Compatiblefor most providers;Claudefor Anthropic-format;Ollamafor local - API Endpoint — your provider's base URL (the
/v1/chat/completionspath is appended automatically for OpenAI-compatible) - API Key — your key (stored locally in your prefs file, never uploaded)
- Model — the model identifier
- Provider Name — a friendly label (e.g.
- Click Test Connection to verify, then Save
The provider immediately appears in the provider pill dropdown on every session card — click it to switch which backend analyzes that session.
Popular cheap providers
| Provider | Type | Endpoint | Recommended model |
|---|---|---|---|
| Zhipu AI (智谱) | OpenAI-Compatible | https://open.bigmodel.cn/api/paas/v4 |
glm-4-flash |
| DeepSeek | OpenAI-Compatible | https://api.deepseek.com |
deepseek-chat |
| OpenRouter | OpenAI-Compatible | https://openrouter.ai/api/v1 |
google/gemini-flash-1.5 |
| Ollama (local) | Ollama | http://localhost:11434 |
qwen2.5:7b |
| University API | OpenAI-Compatible | your institution's endpoint | gpt-4o-mini |
Quick self-check
- You have used
Claude Code,Codex, orCursor Agentlocally, and it is still available now - Local session history exists
Quick check
- Open Settings and look at
Local CLI Detection - Switch to
WeekorMonthand check whether the timeline shows any sessions
5. Start AI session analysis
Method A: Batch pre-analysis (auto-prompted on dashboard open)
Every time you open the Analytics Dashboard, if there are unanalyzed sessions, the dashboard automatically pops up a dialog — Pre-analyze Sessions — letting you analyze a whole time range in one go.
Note: the dashboard's own internal AI summary jobs are automatically excluded from the timeline and session stats. Even if you launch
npm startfrom some other directory, those internal analysis runs will not be counted as work sessions.
Available scopes:
- Today — every session from today
- 3 Days — the last 3 days
- Week — the last 7 days
- Custom — your last N sessions
Pick a scope, hit confirm, and the dashboard runs through them in the background, showing an Analyzing 1/N, 2/N, ... progress bar. Already-analyzed sessions are auto-skipped (per-provider cache), so re-clicking never wastes tokens.
Best for: first-time users, monthly retrospectives, catching up on a backlog.
Method B: Click a single session (from the timeline or the sessions list)
If you only want to review one specific session, no batch needed, just click it:
- From the timeline — in Timeline view, click any colored block (each block is a session) and the detail card slides out on the right
- From the Sessions list — click any session card in the right-side list
Either way, the dashboard will:
- Show the cached summary first if it exists (sessions previously batch-analyzed are tagged
Analyzedand open instantly) - If not yet analyzed, the click immediately kicks off a single-session analysis — the card shows an
Analyzing…tag, and the result appears in seconds to tens of seconds
Best for: you already know which session you want to revisit, ad-hoc lookups, day-to-day "scrolling through" history.
In summary:
- First time using it → run Method A on Week once, or pick a custom range/count for the sessions you want analyzed. Takes a few minutes and costs more tokens upfront, but every record opens instantly afterwards.
- Daily use → after that initial batch, switch to Method B — pick specific sessions as needed. Only fresh ones require a manual trigger.
- Token-sensitive → use Method B on demand. Only analyze the sessions you actually want to read — zero wasted tokens.
About cost: Local CLI (Claude Code / Codex subscription) analysis uses your existing subscription quota — typically no extra charges. In API key mode, the dashboard shows token usage and cost in the top status bar after each analysis completes, so you always know what you're spending.
How it works
Clawd runs two independent data paths side by side:
Your Agent                              Clawd
  │                                      │
  ├── live events ──→ hook / poll / plugin ──→ 🦀 pet animation
  │                                      │
  └── chat history ──→ local JSONL files ────→ 📊 insights dashboard
Path ①: Live awareness → pet animation
While an agent works (calling tools, waiting for input, erroring out, finishing a task…) it emits events. Clawd captures them through three integration modes and drives the pet accordingly:
| Mode | How it works | Latency | Agents |
|---|---|---|---|
| Command hook | Agent fires an event → automatically runs a script → script HTTP-POSTs the event to Clawd's local server (127.0.0.1:23333) |
Near zero | Claude Code, Copilot CLI, Gemini CLI, Cursor Agent, Kiro CLI |
| Log polling | Clawd scans the agent's JSONL log file every ~1.5 s and detects new entries | ~1.5 s | Codex CLI, Gemini CLI (fallback) |
| In-process plugin | Plugin runs inside the agent's own runtime, forwarding events with zero overhead | Zero | opencode |
All events map to the same state machine: idle → thinking → working → happy / error → sleeping. The pet plays the matching SVG animation. When multiple sessions run simultaneously, it auto-switches to juggling / building / conducting animations.
Multi-agent coexistence: Claude Code, Codex, Copilot, Gemini, Cursor, Kiro, and opencode can all run at the same time. Clawd tracks each session independently and displays the highest-priority state.
Path ②: Offline analysis → insights dashboard
Every conversation you have with an agent is saved as JSONL on your disk:
| Agent | Local history path |
|---|---|
| Claude Code | ~/.claude/projects/ |
| Codex CLI | ~/.codex/sessions/ |
| Cursor Agent | ~/.cursor/projects/ |
The insights dashboard reads these files directly to generate timelines and AI summaries. It doesn't go through hooks and doesn't require the pet to be running — as long as chat history exists on disk, the dashboard works.
Note: the analytics scanner currently covers only the three agents above. Copilot CLI, Gemini CLI, Kiro CLI, and opencode still drive pet animations, but their local histories are not yet wired into the dashboard scanner.
FAQ
Q: Does the dashboard need internet?
Scanning and the timeline are fully offline. Whether AI summaries need internet depends on which provider you pick: Local CLI uses whatever network stack Claude Code / Codex normally use; Ollama is fully offline; API key mode talks to the cloud.
Q: Are my conversations uploaded anywhere?
No. Clawd Insights collects zero telemetry. The provider step is your CLI or your API key calling the model you chose directly — no third-party server in the middle.
Q: I don't have Claude Code or Codex. Can I still use it?
Yes. You can use the timeline view alone (completely free, no LLM required), or paste an Anthropic / OpenAI API key into AI Provider Settings to enable the cloud path.
Lineage & Credits
Clawd Insights is the analytics layer built on top of rullerzhou-afk/clawd-on-desk, the lovely desktop pet that turns your coding agent's state into pixel art. Everything that makes the pet delightful — animations, permission bubbles, multi-agent state tracking, mini mode, the lot — is still here, untouched. What this fork adds is one extra question: what if every conversation you've ever had with the agent was searchable, summarised, and waiting for you on a single dashboard?
That dashboard is the new piece. It scans your local history (Claude Code, Codex CLI, Cursor Agent today; more agents on the way), draws a timeline, and lets your own LLM write per-session summaries — all without sending a byte to a third party.
Multi-agent state tracking carried over from upstream: Claude Code, Codex CLI, Copilot CLI, Gemini CLI, Cursor Agent, Kiro CLI, and opencode. For the desktop pet's own feature list (mini mode, click reactions, themes, remote SSH, etc.), see the upstream README.
Huge thanks to @rullerzhou-afk and every contributor who shaped the original Clawd — this project wouldn't exist without that foundation.
License
Source code: MIT License.
Artwork (assets/) is NOT covered by MIT. All rights reserved by their respective copyright holders. See assets/LICENSE.
- Clawd character is the property of Anthropic. Unofficial fan project, not affiliated with Anthropic.
- Calico cat (三花猫) artwork by 鹿鹿 (@rullerzhou-afk). All rights reserved.
- Third-party contributions: copyright retained by respective artists.
Reviews (0)
Sign in to leave a review.
Leave a reviewNo results found